This tool is the Ghidra version of AntiDebugSeeker.
It can be used in two ways: as a Ghidra Script and as a module.
Through this tool, users can automatically extract potential anti-debugging methods used by malware, making it easier for analysts to take appropriate action.
The main functionalities of this plugin are as follows:
- Extraction of Windows API that are potentially being used for anti-debugging by the malware
(All subsequent API represent the Windows API) - In addition to API, extraction of anti-debugging techniques based on key phrases that serve as triggers, as some anti-debugging methods cannot be comprehensively identified by API calls alone.
Additionally, the file that defines the detection rules is designed to easily add keywords you want to detect.
This allows analysts to easily add new detection rules or make changes.
For packed malware, running this plugin after unpacking and fixing the Import Address Table is more effective.
-
AntiDebugSeeker.java (Ghidra Script)/
ghidra_11.0.1_AntiDebugSeeker.zip (Zip Folder containing the compiled files including AntiDebugSeekerPlugin.java : Ghidra Module Extension) -
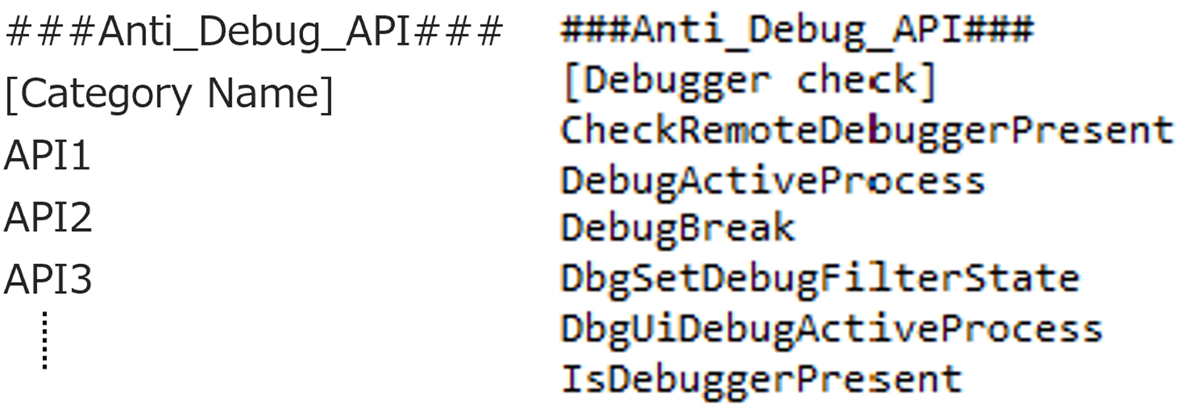
anti_debug_Ghidra.config (Converted for Ghidra : A file containing rules for detecting anti-debugging techniques)
-
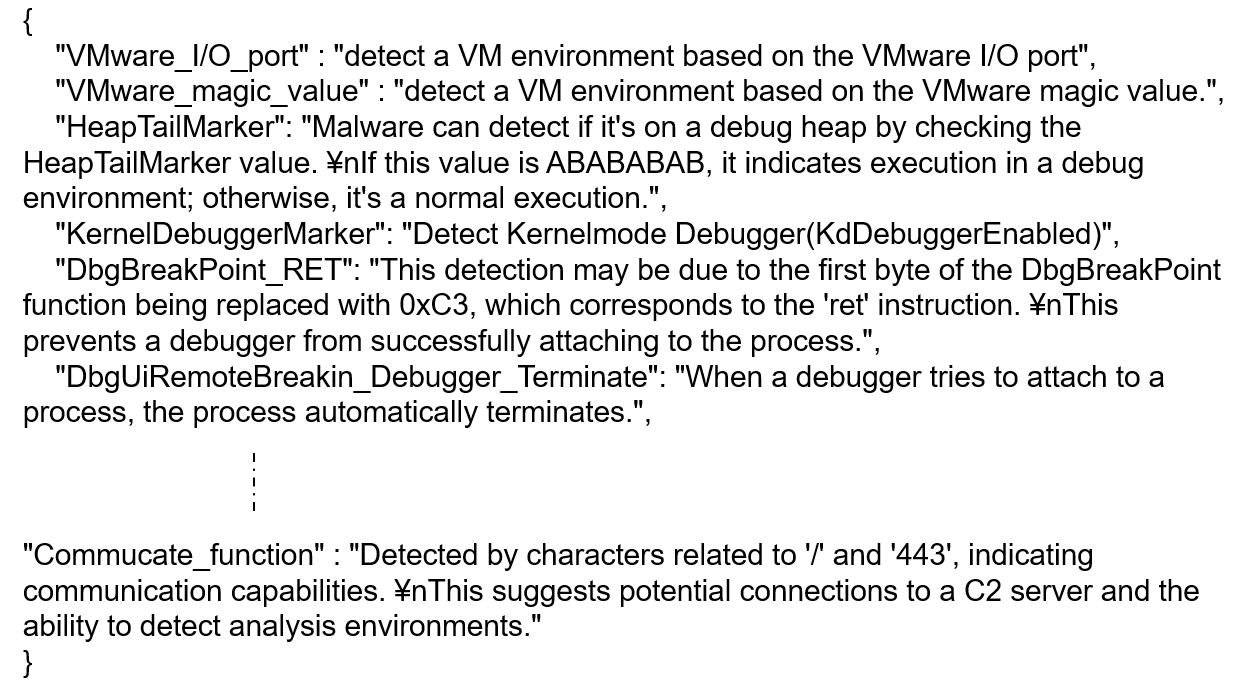
anti_debug_techniques_descriptions_Ghidra.json (Converted for Ghidra : A file containing descriptions of the detected rules)
There are sections named Anti_Debug_API and Anti_Debug_Technique.
- Anti_Debug_API
you can freely create categories and add APIs that you wish to detect. (exact match)
- Anti_Debug_Technique
You can set between one to three keywords. (partial match)
The basic flow of the search is as follows:
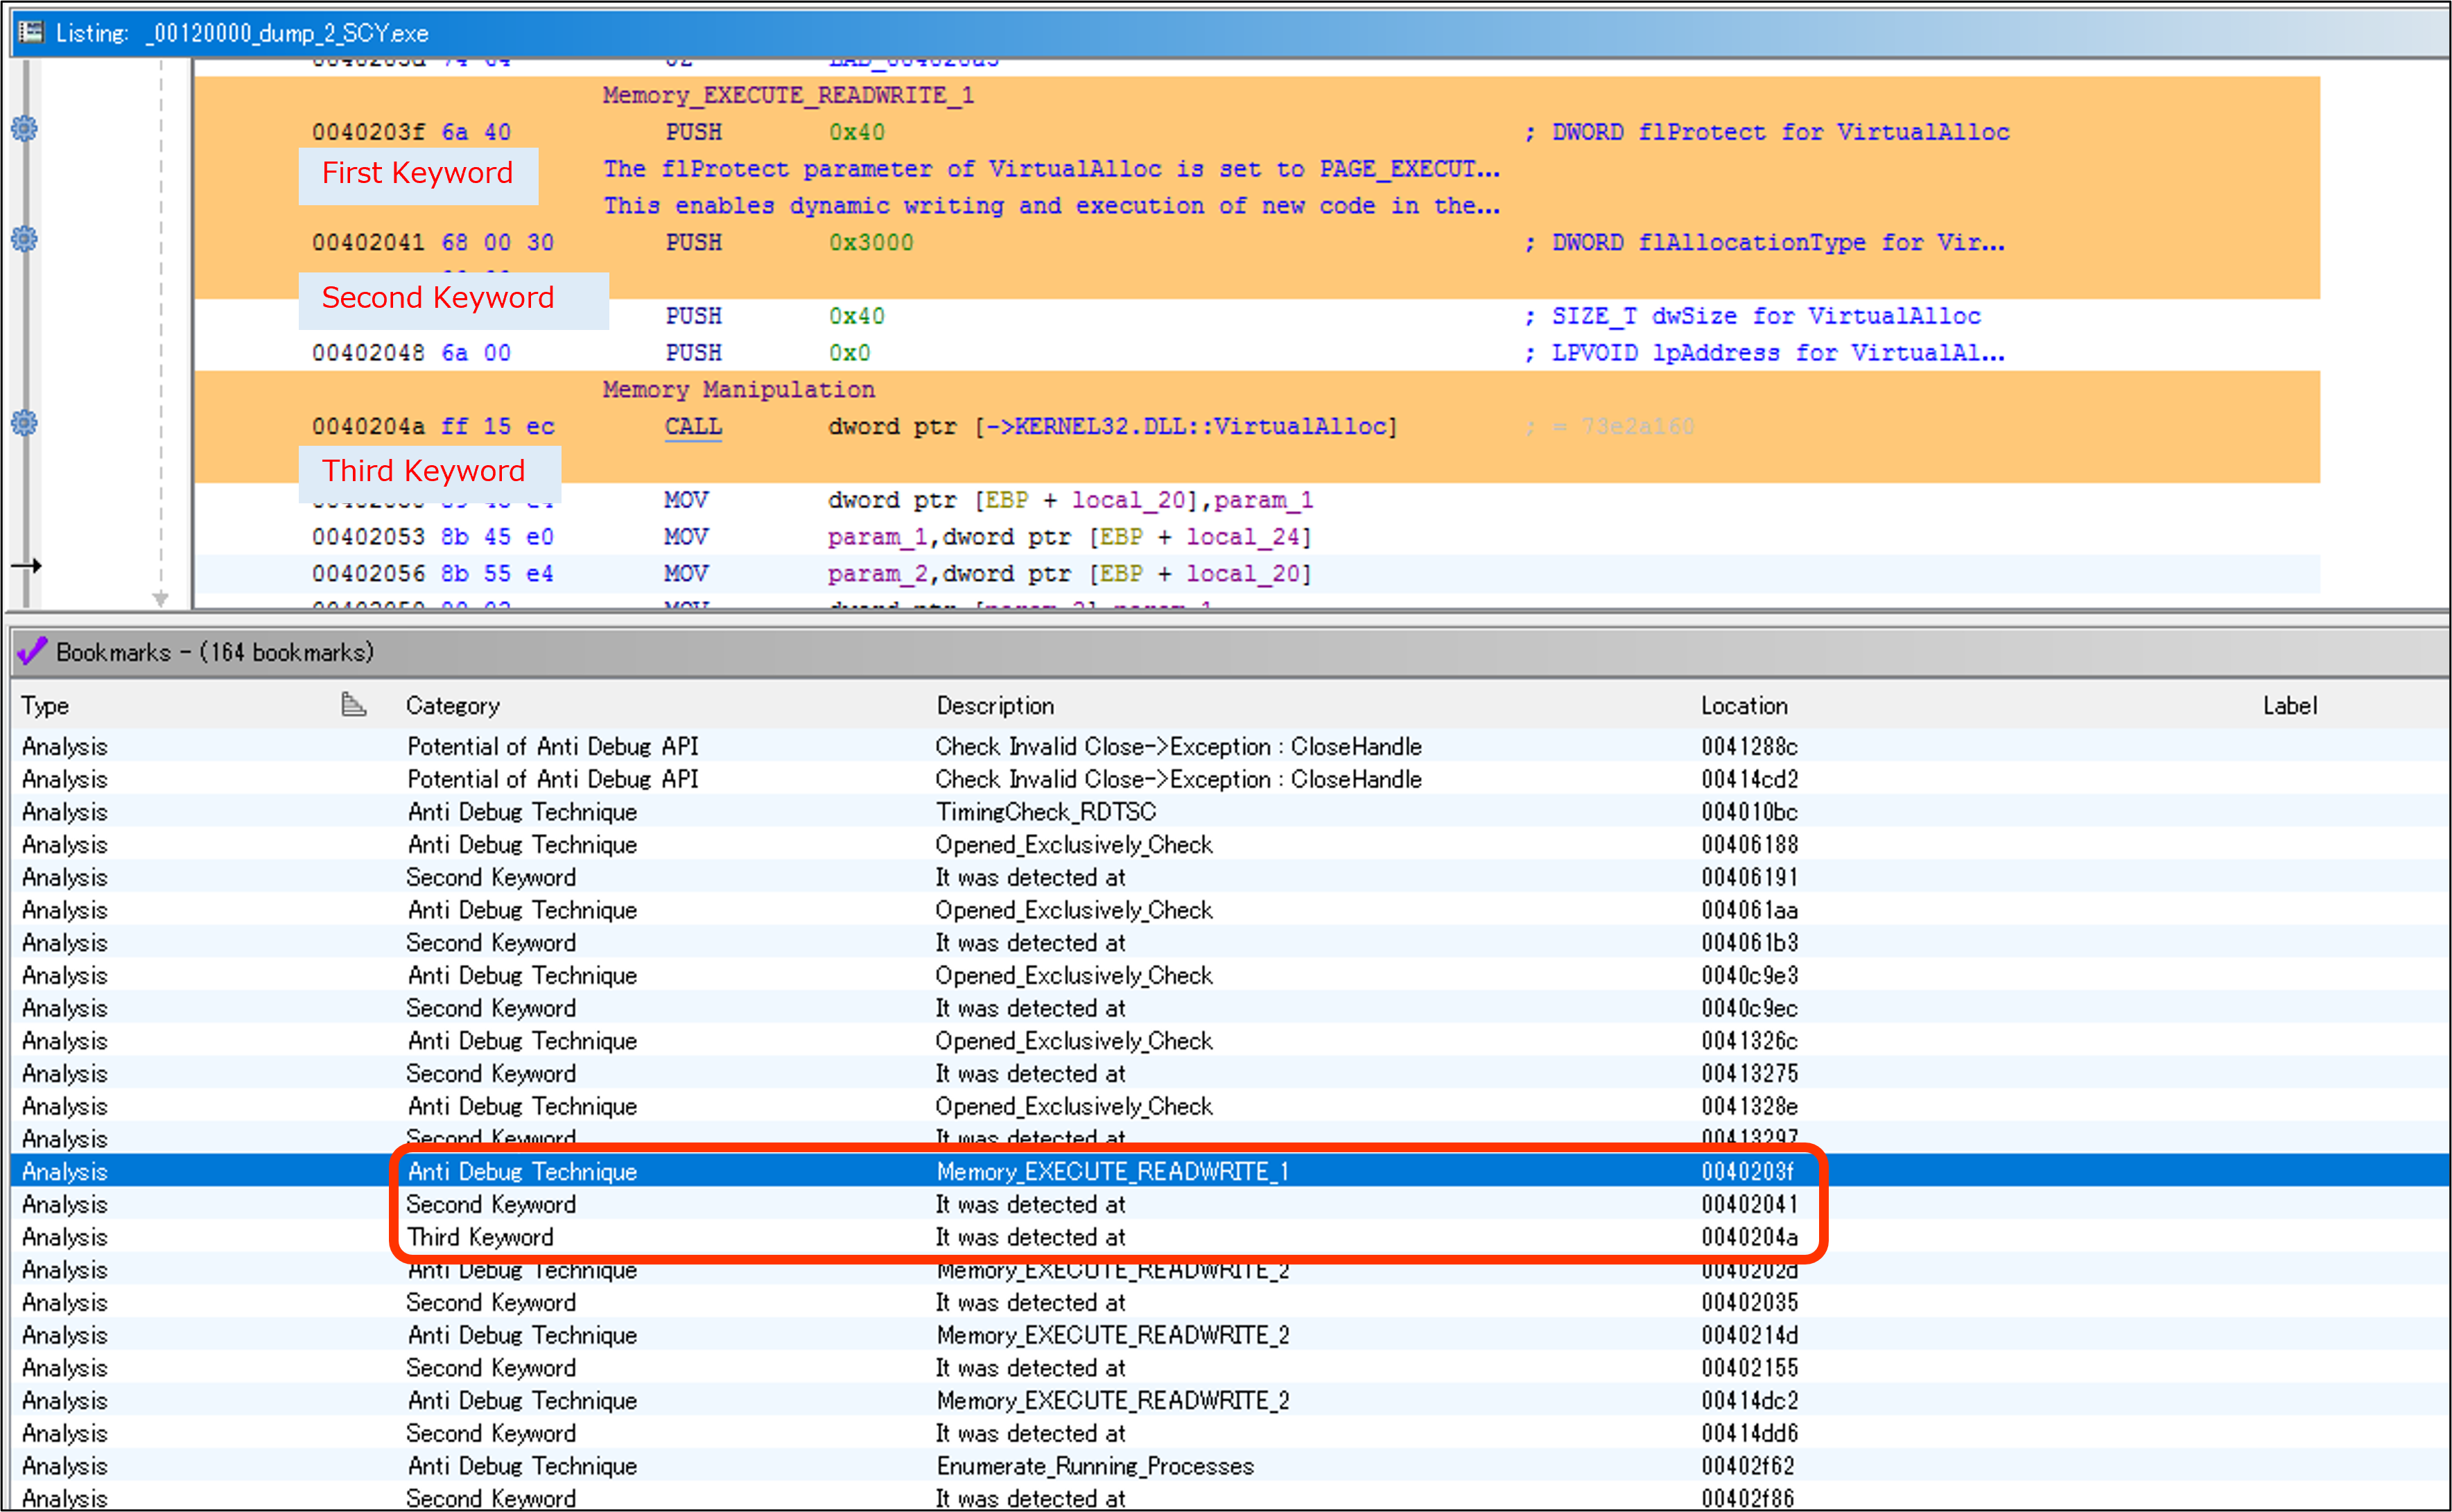
First, search for the first keyword. If it is found, search within the specified number of bytes (default is 80 bytes) for the second keyword.
The same process is then applied for searching for the third keyword.
If you want to set a custom search range instead of using the default value, you can specify 'search_range=value' at the end of the keyword you've set.
This allows you to change the search range for each rule you've configured.
anti_debug_techniques_descriptions.json contains the descriptions of the rules defined in the Anti_Debug_Technique section.
The values defined in this file can be referenced on the disassembly screen, allowing you to check the descriptions of the rules.
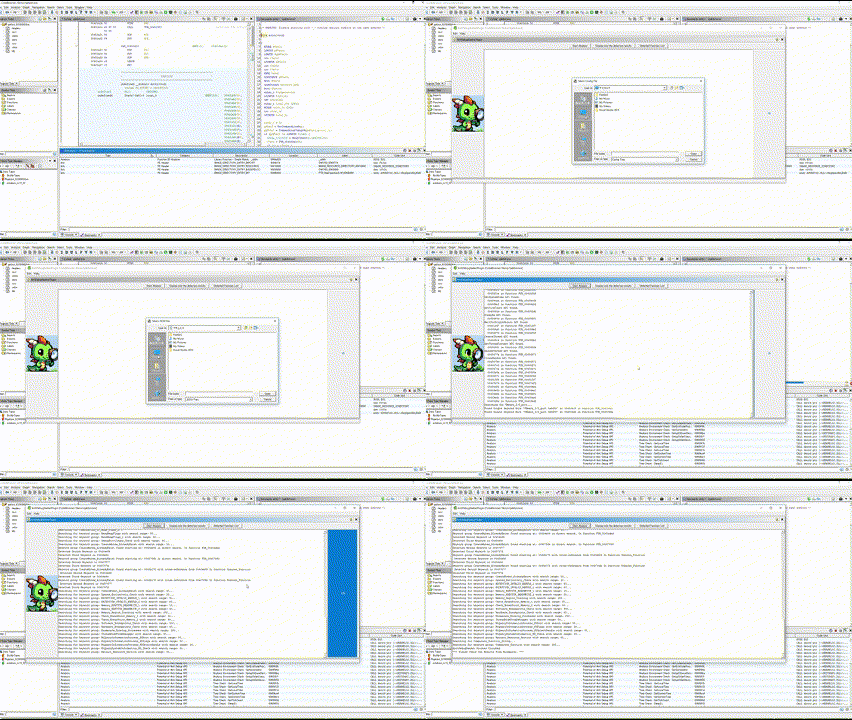
Script Manager > AntiDebugSeeker.java > Run Script
When the script is executed, a message saying "Select the Configuration File" is displayed,
so specify the anti_debug_Ghidra.config that defines the detection rules, then click Open.
After selecting the config file, a message saying "Select the JSON Description File" is displayed,
so specify the anti_debug_technique_descriptions_Ghidra.json, which contains the descriptions of the detection rules, and click Open.
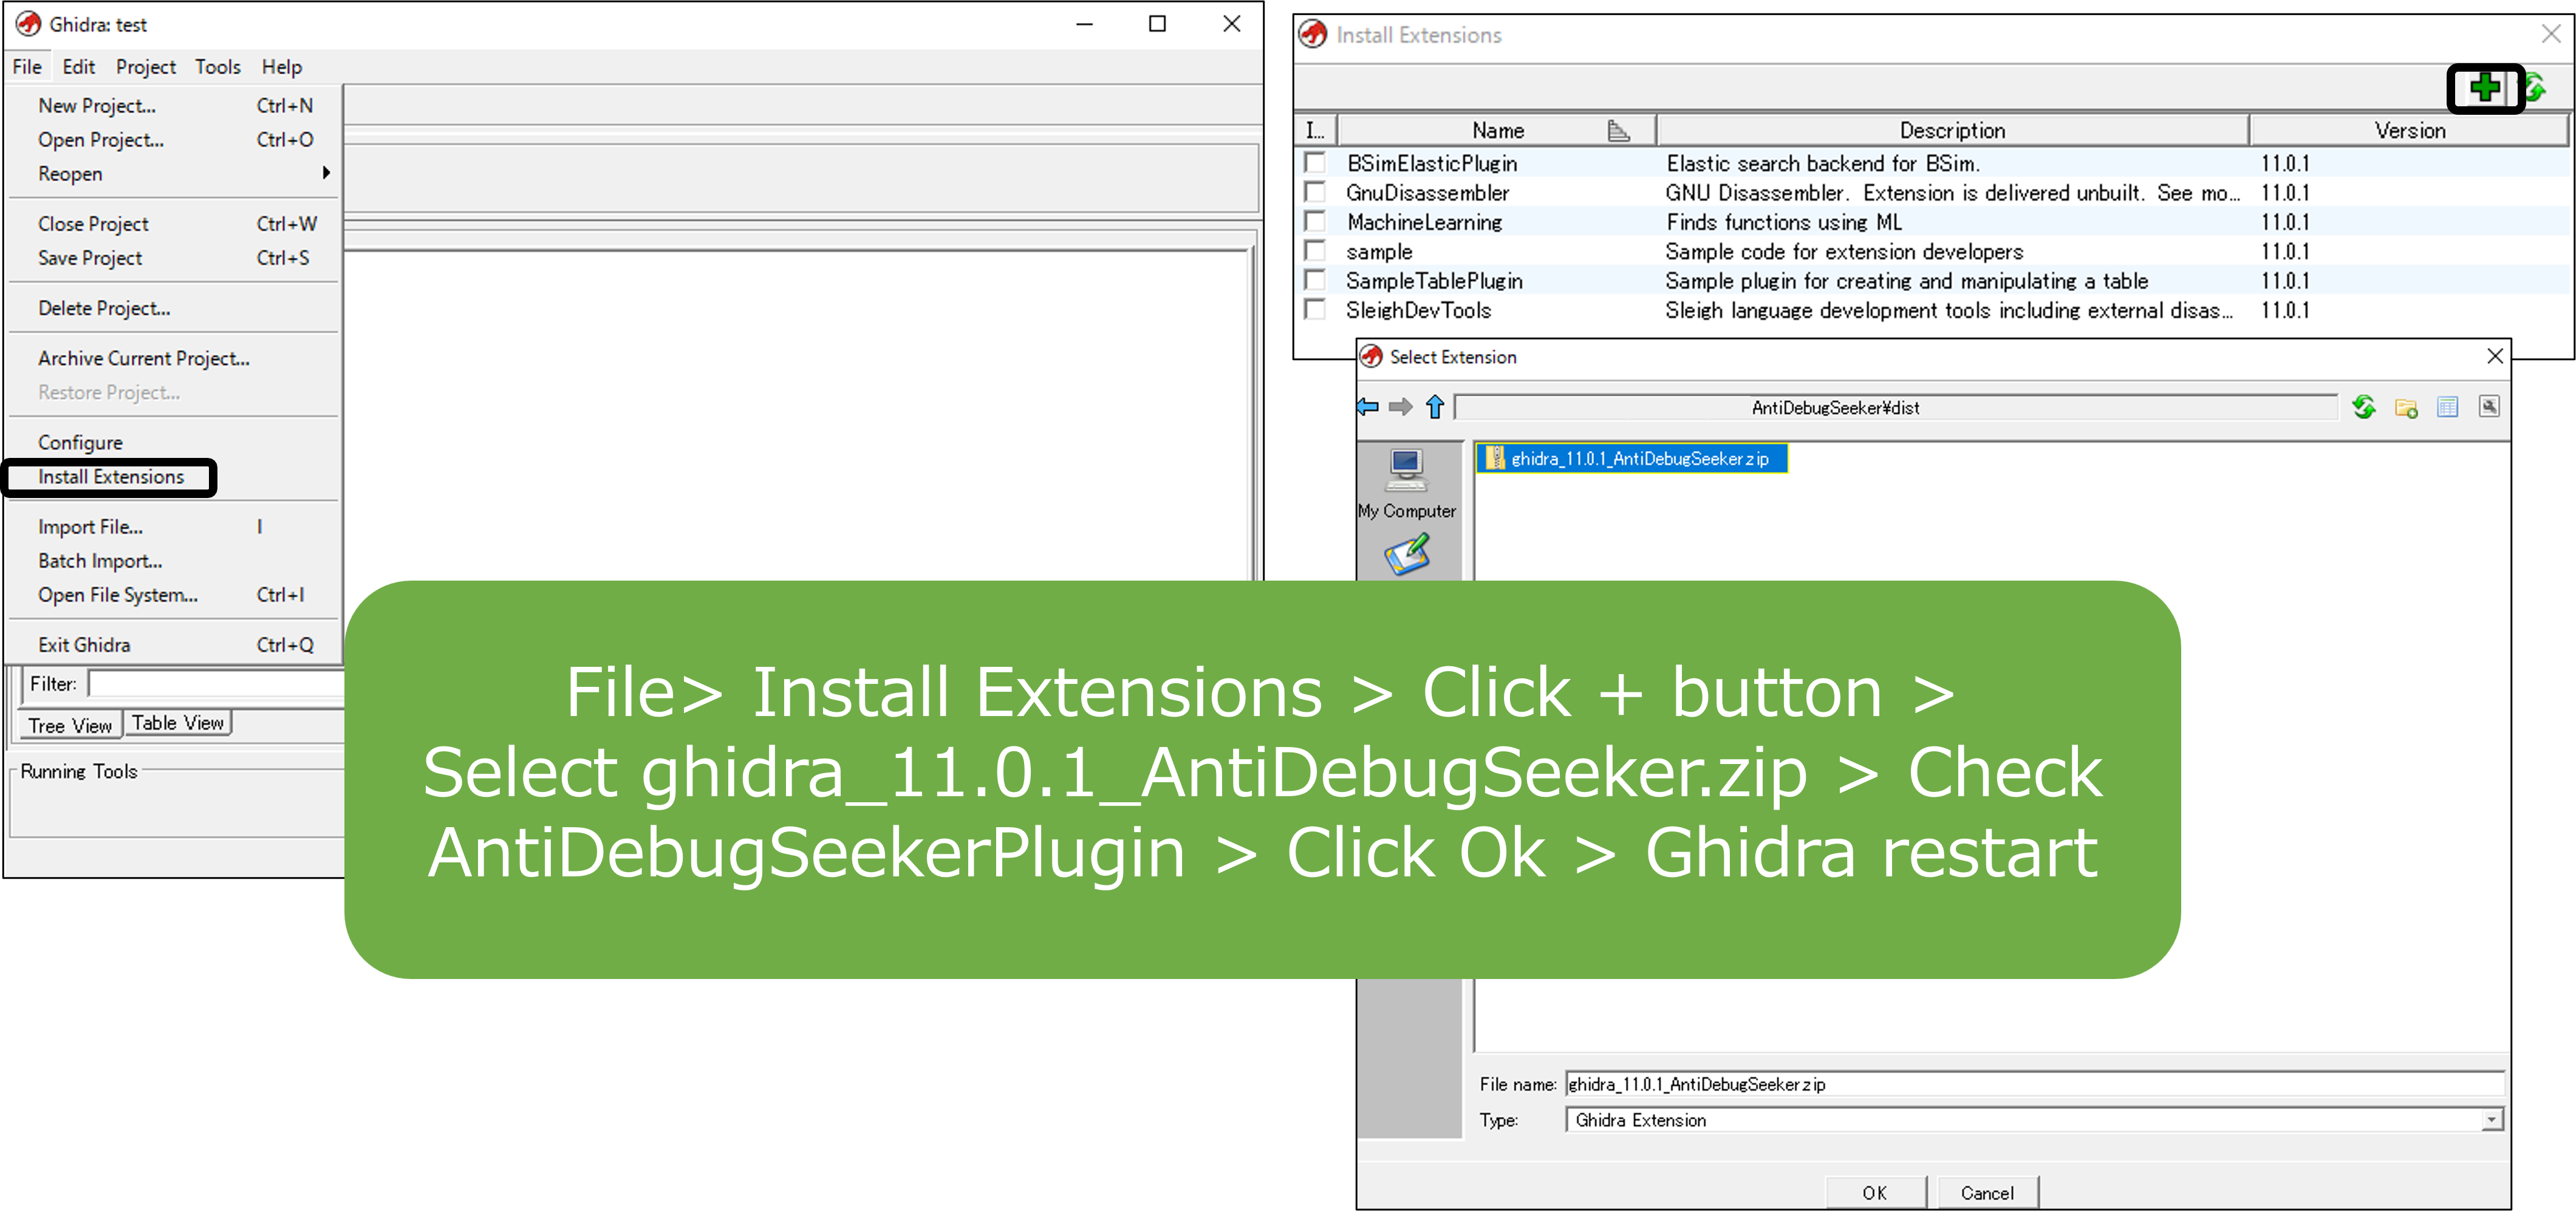
Initial Setup
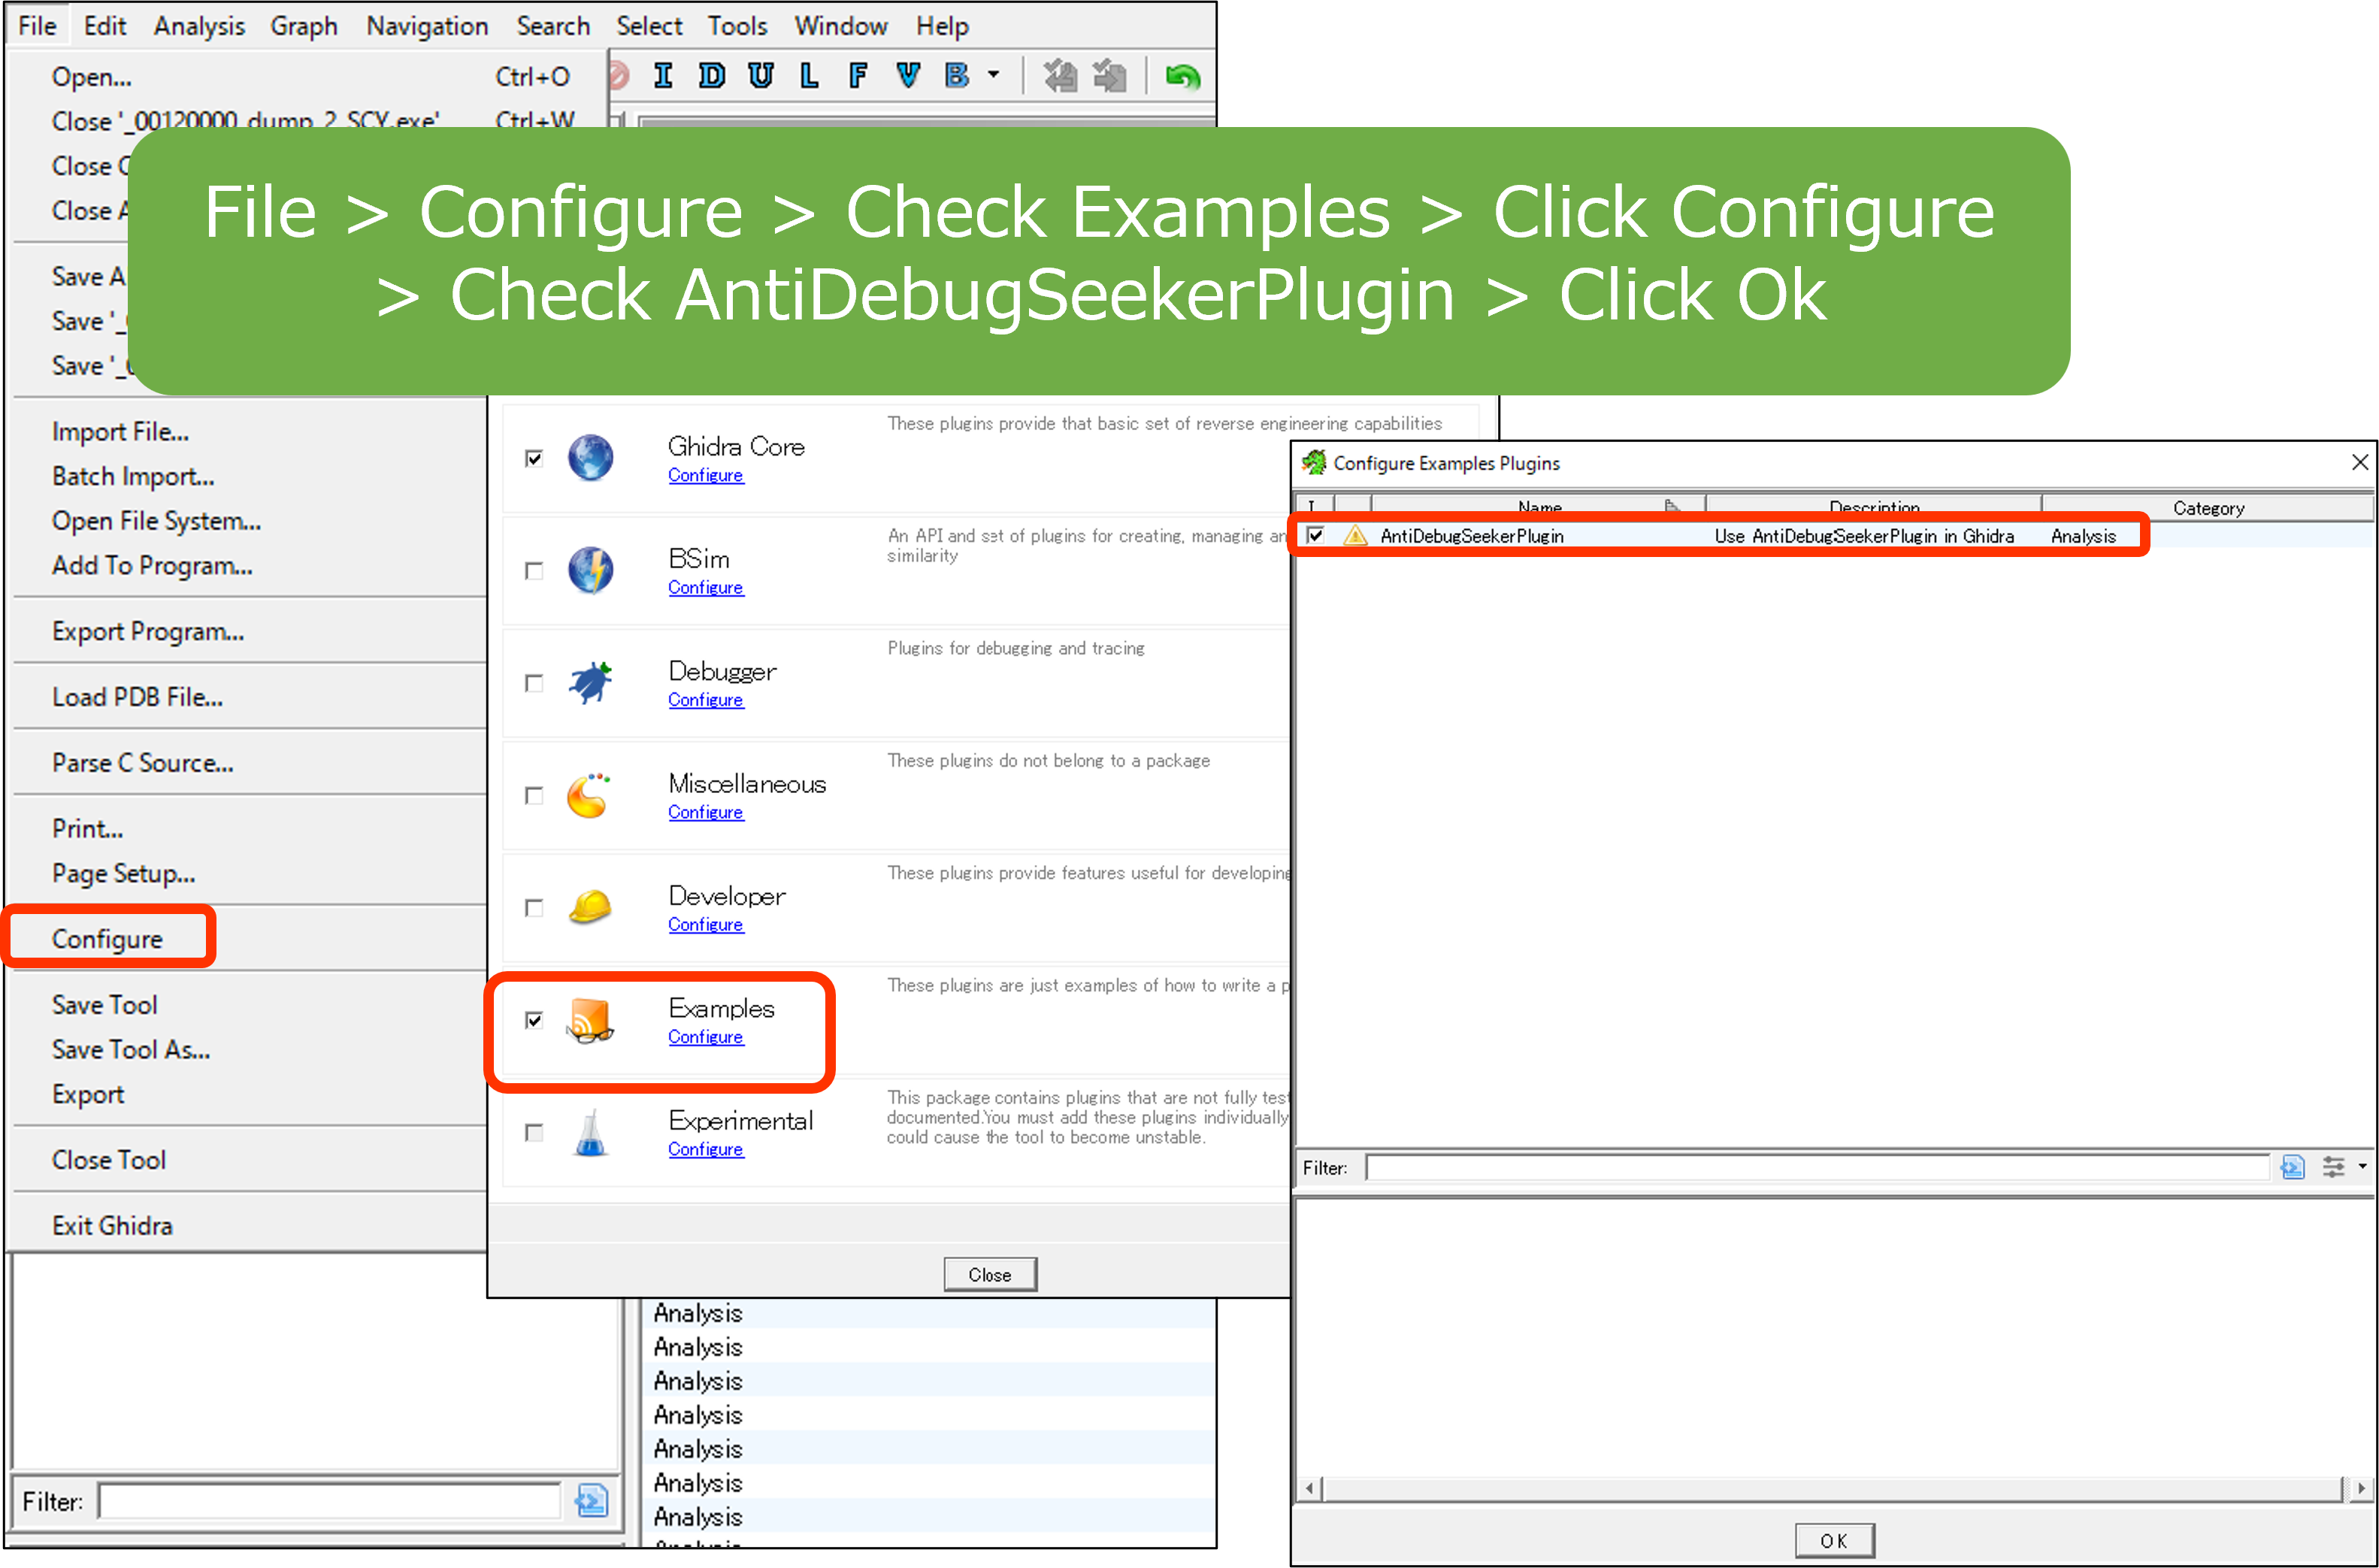
File > Configure > Check Examples > Click Configure > Check AntiDebugSeekerPlugin > Click Ok
How to Execute
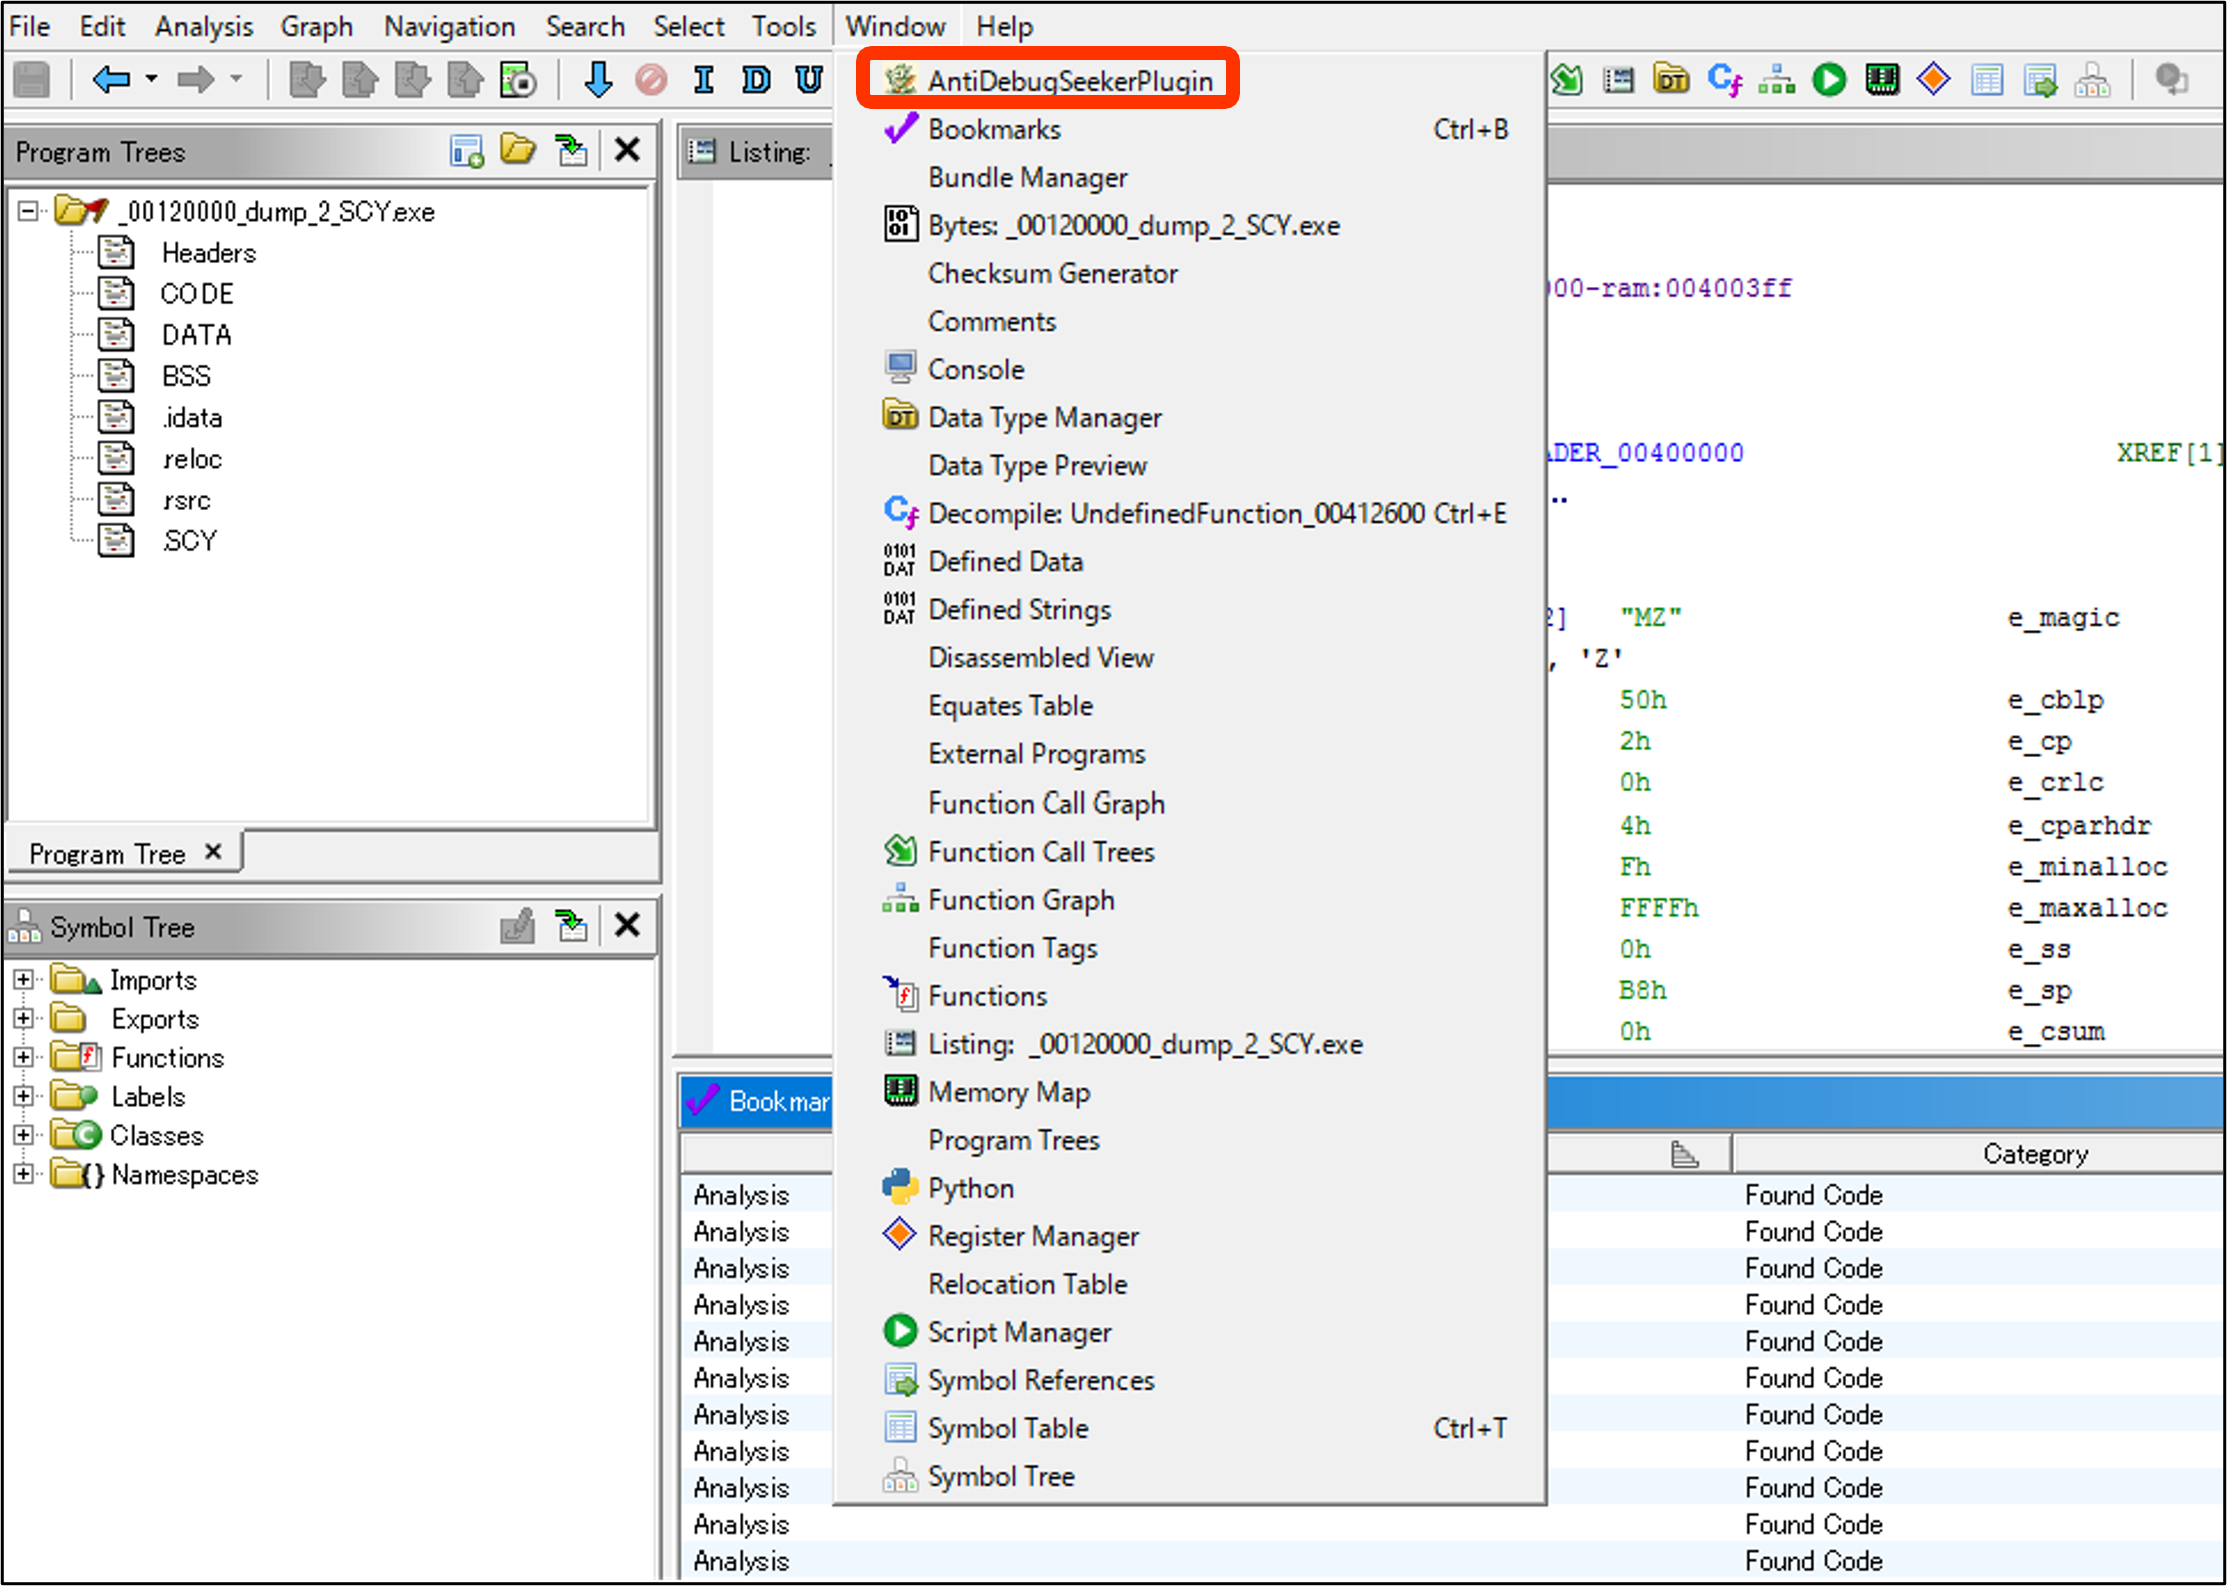
Window > AntiDebugSeekerPlugin
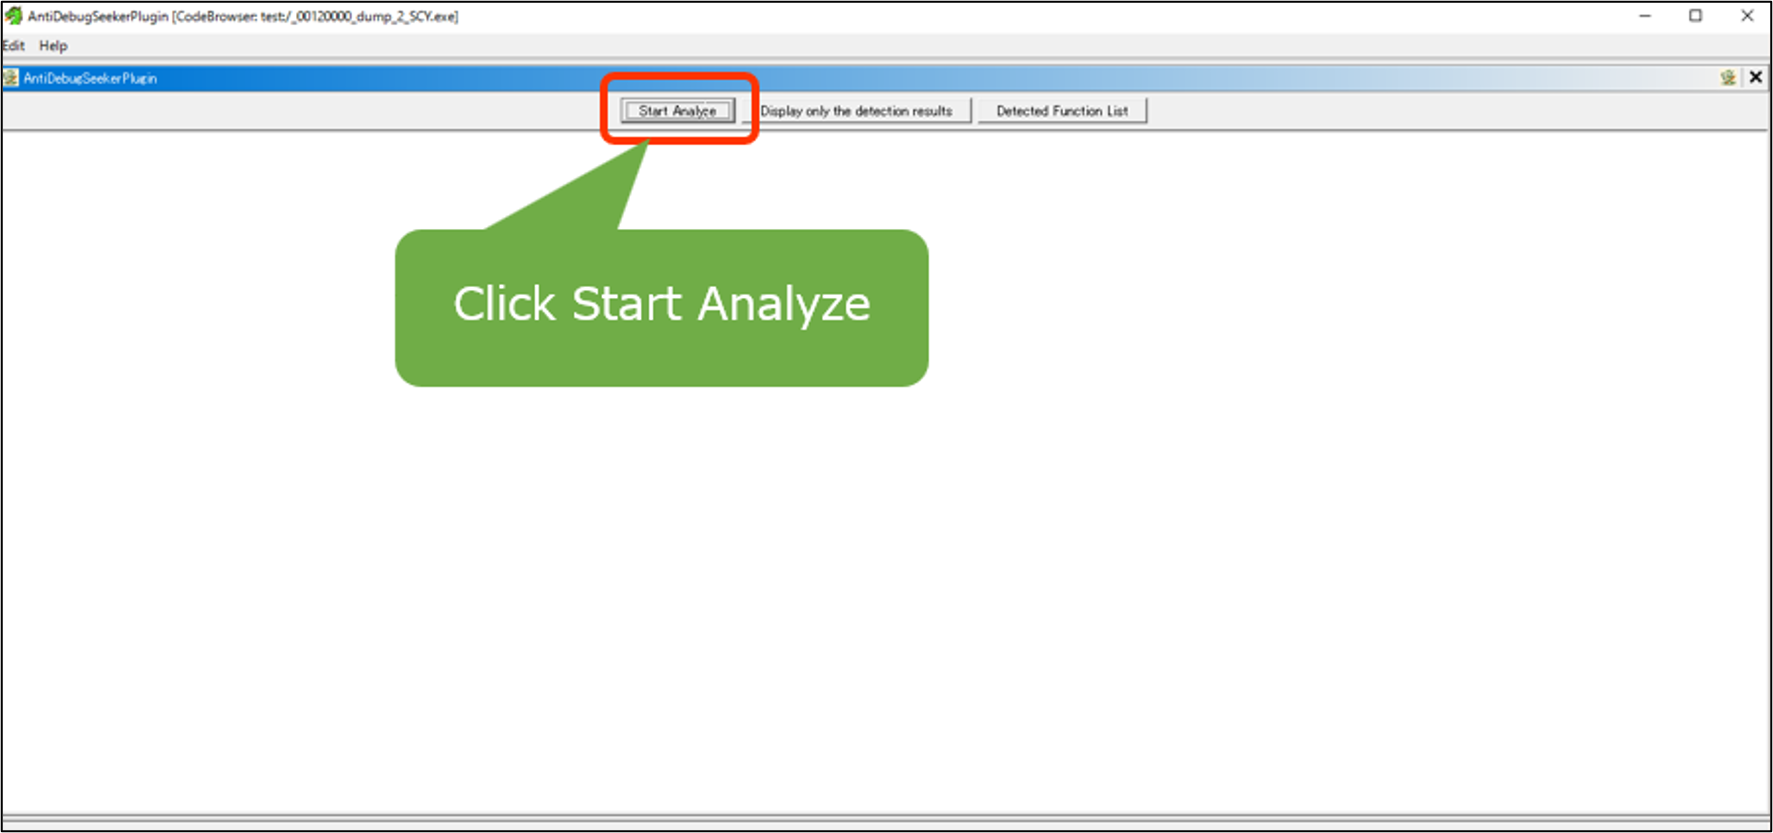
Click Start Analyze Button
The GUI interface launches.
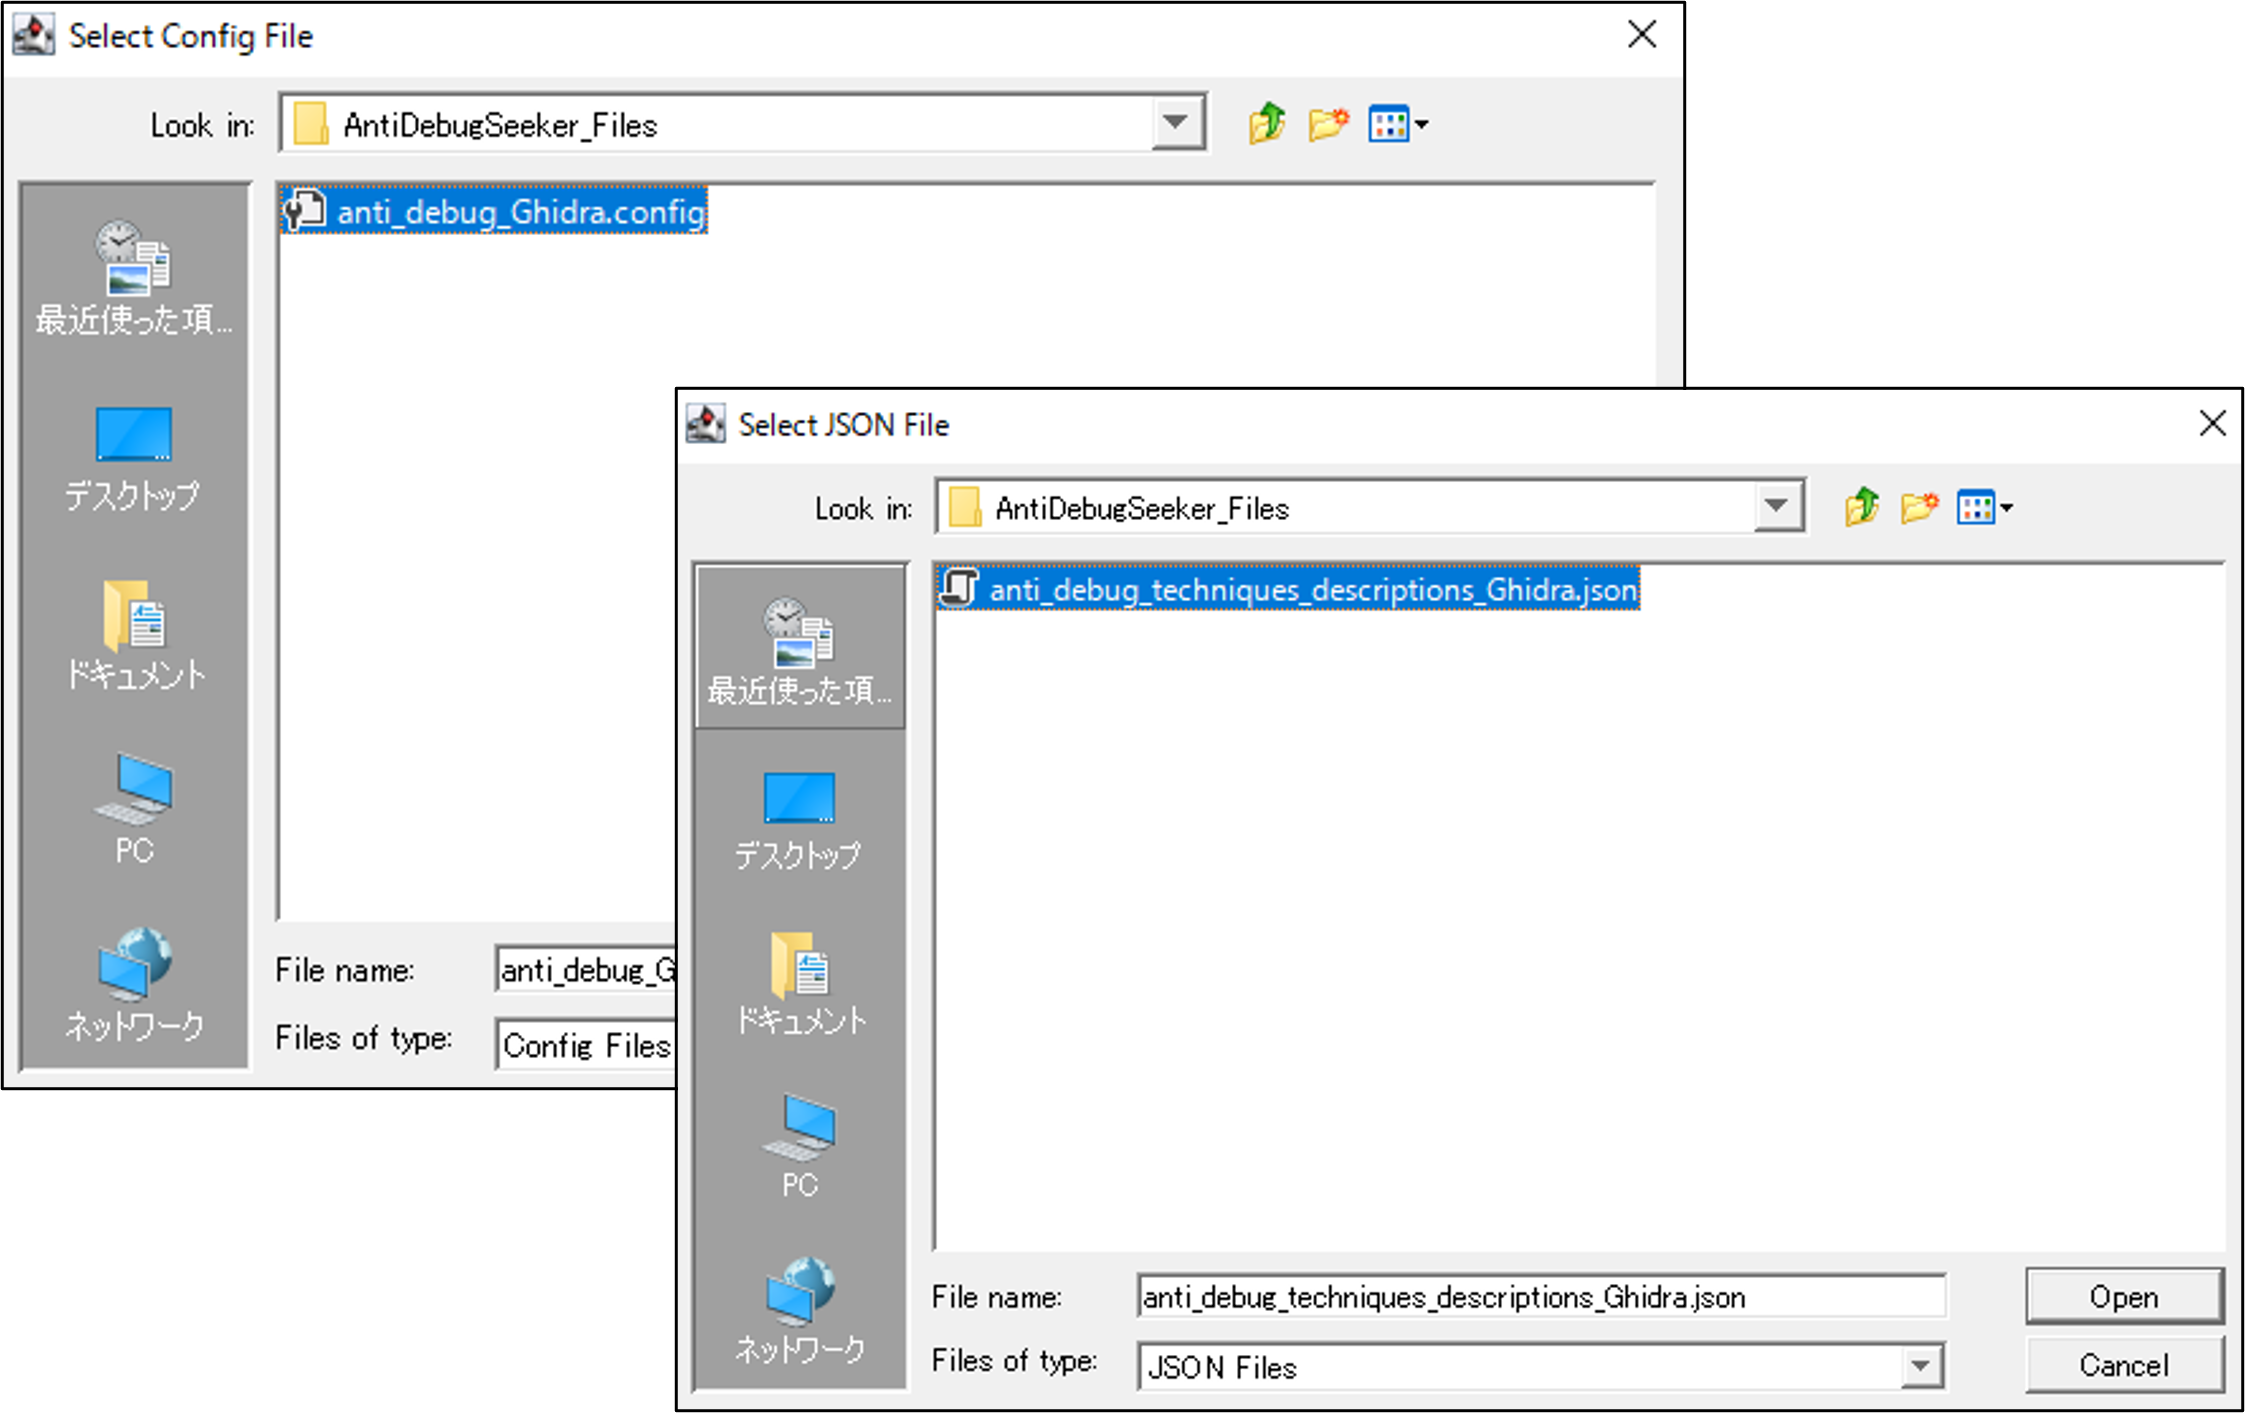
"Select the Config File" is displayed, so specify the anti_debug_Ghidra.config that defines the detection rules, then click Open.
"Select the JSON Description File" is displayed, so specify the anti_debug_technique_descriptions_Ghidra.json,
which contains the descriptions of the detection rules, and click Open.
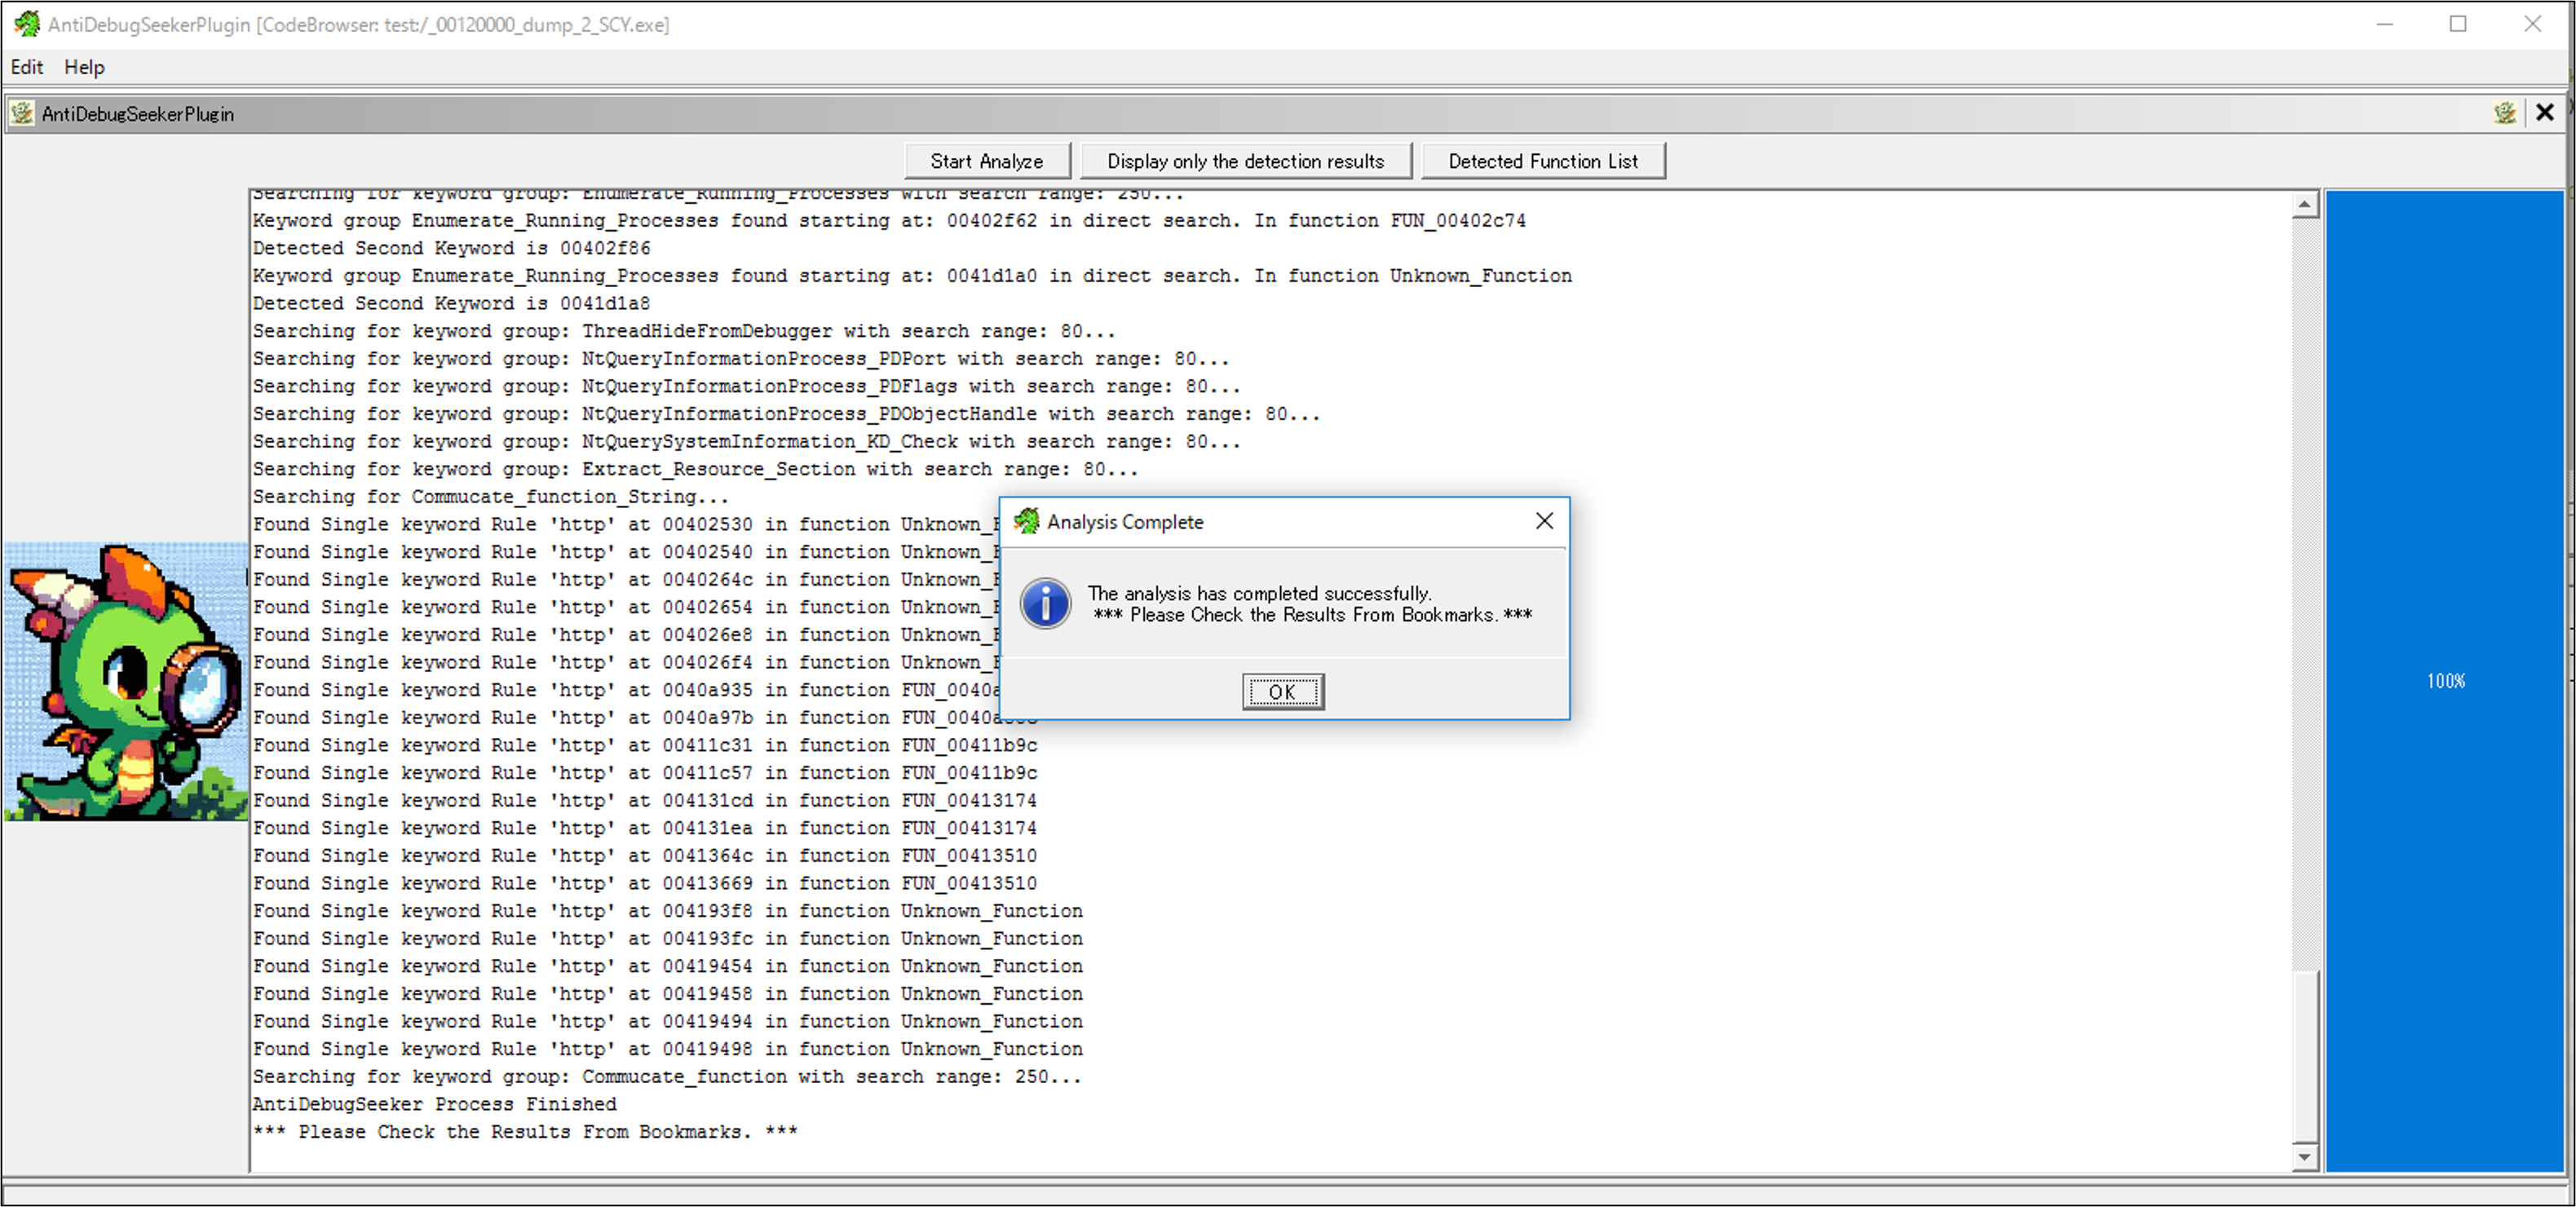
A progress bar is displayed alongside a moving dragon.
When the analysis is complete, "Analysis Complete" will be displayed.
The detection results can be checked from the GUI interface TextArea or Bookmarks.
Ghidra Script: Check Console-Scripting
The results of the detection can be checked from the Console - Scripting screen.
When AntiDebugSeeker Process Finished is displayed, it signals that the process has completed.
Ghidra Module Extension : Check Text Area
The results of the detection can be checked from Text Area.
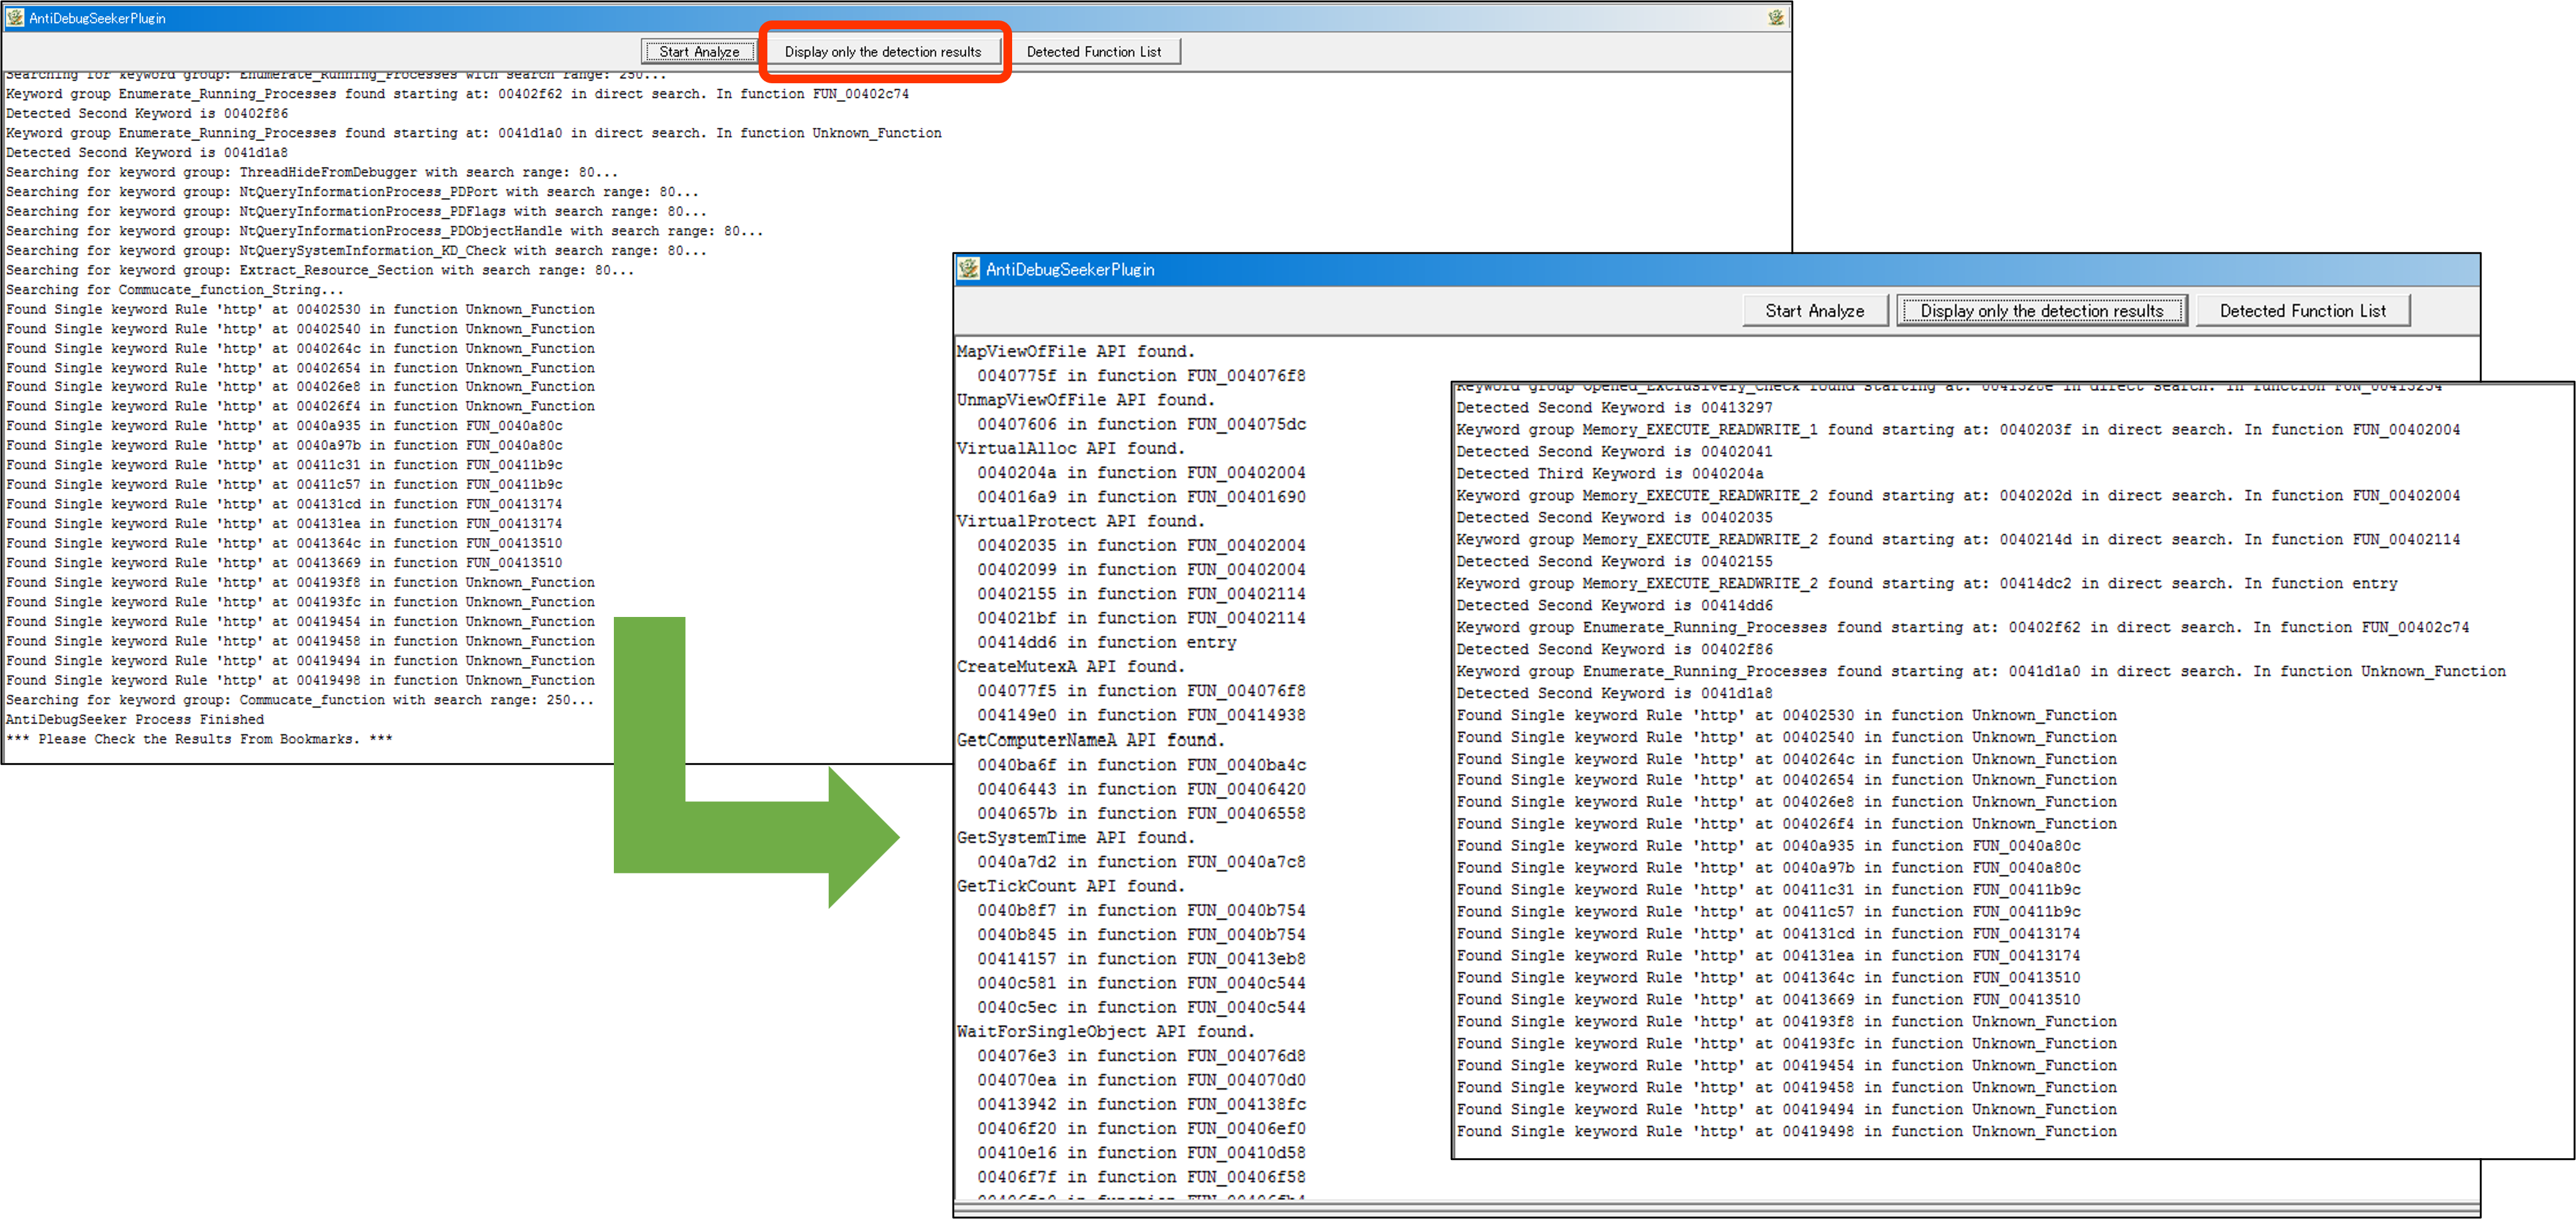
- Display only the detection results Button
You can display only the detected results from the outcomes shown by pressing the Start Analyze button.
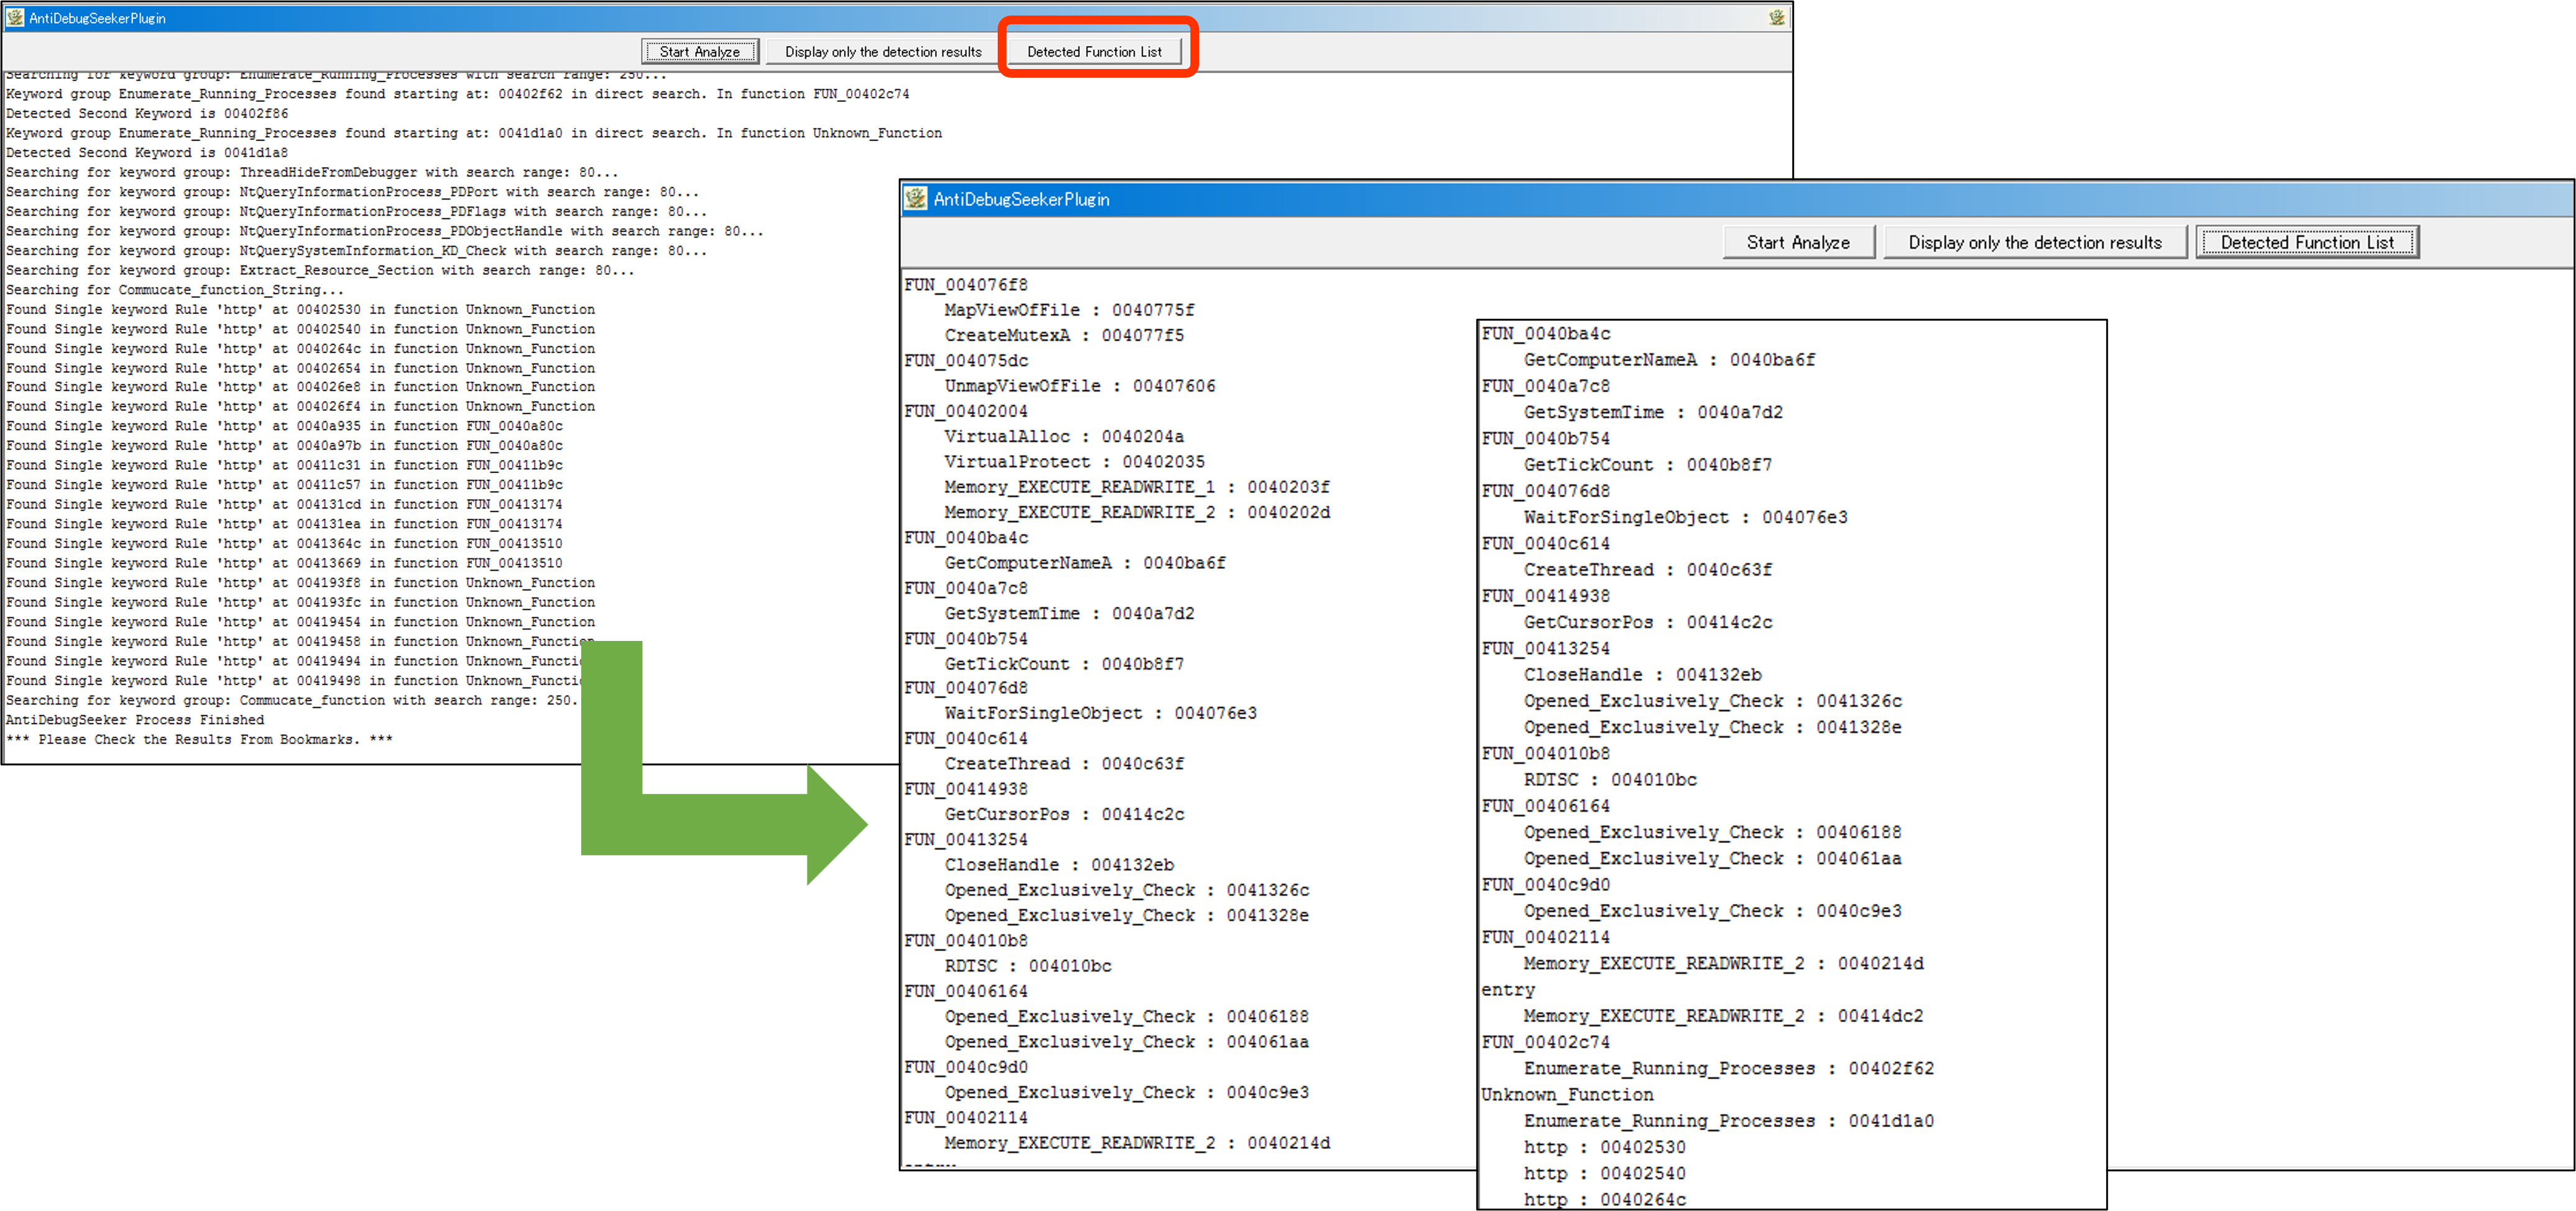
- Detected Function List Button
From the results of either the Start Analyze button or the Display only the detection results button,
the outcomes are displayed grouped by function.
It becomes easier for the user to understand from which function to start checking.
Ghidra Script / Module Extension : Check Bookmarks
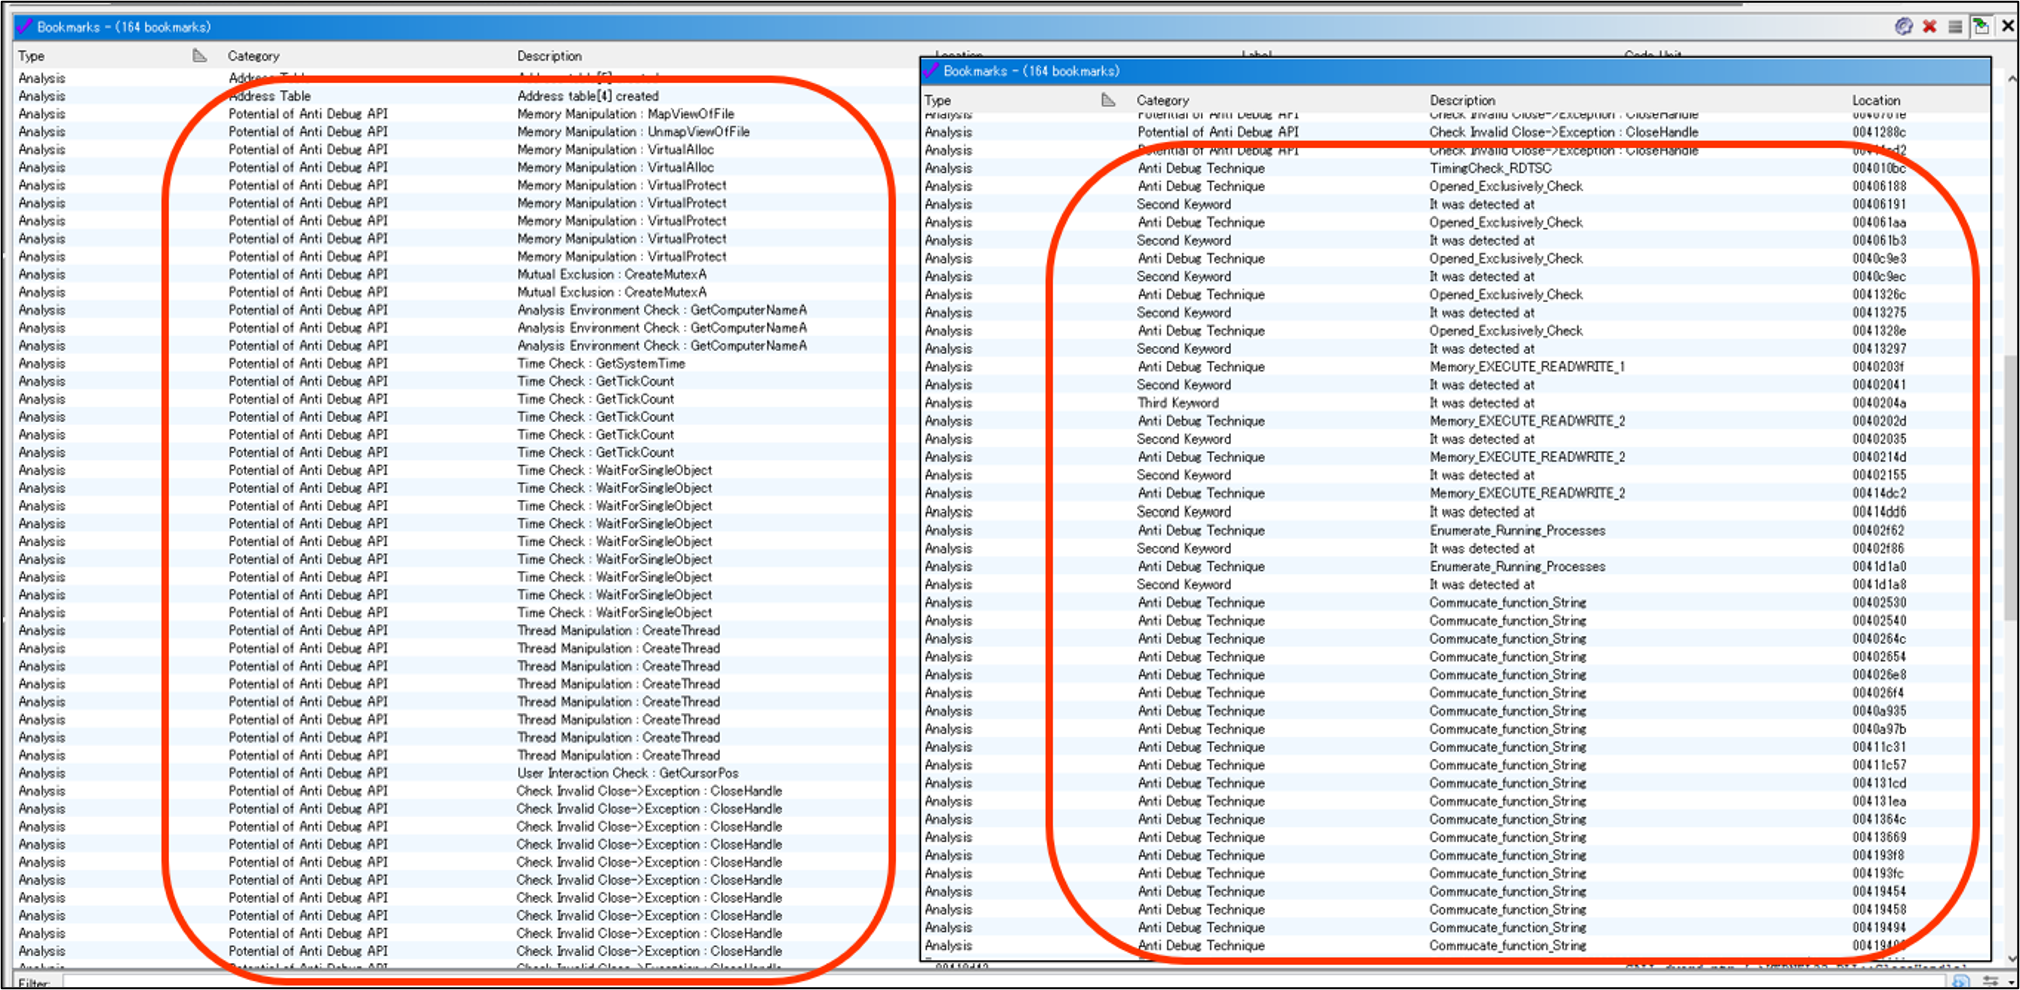
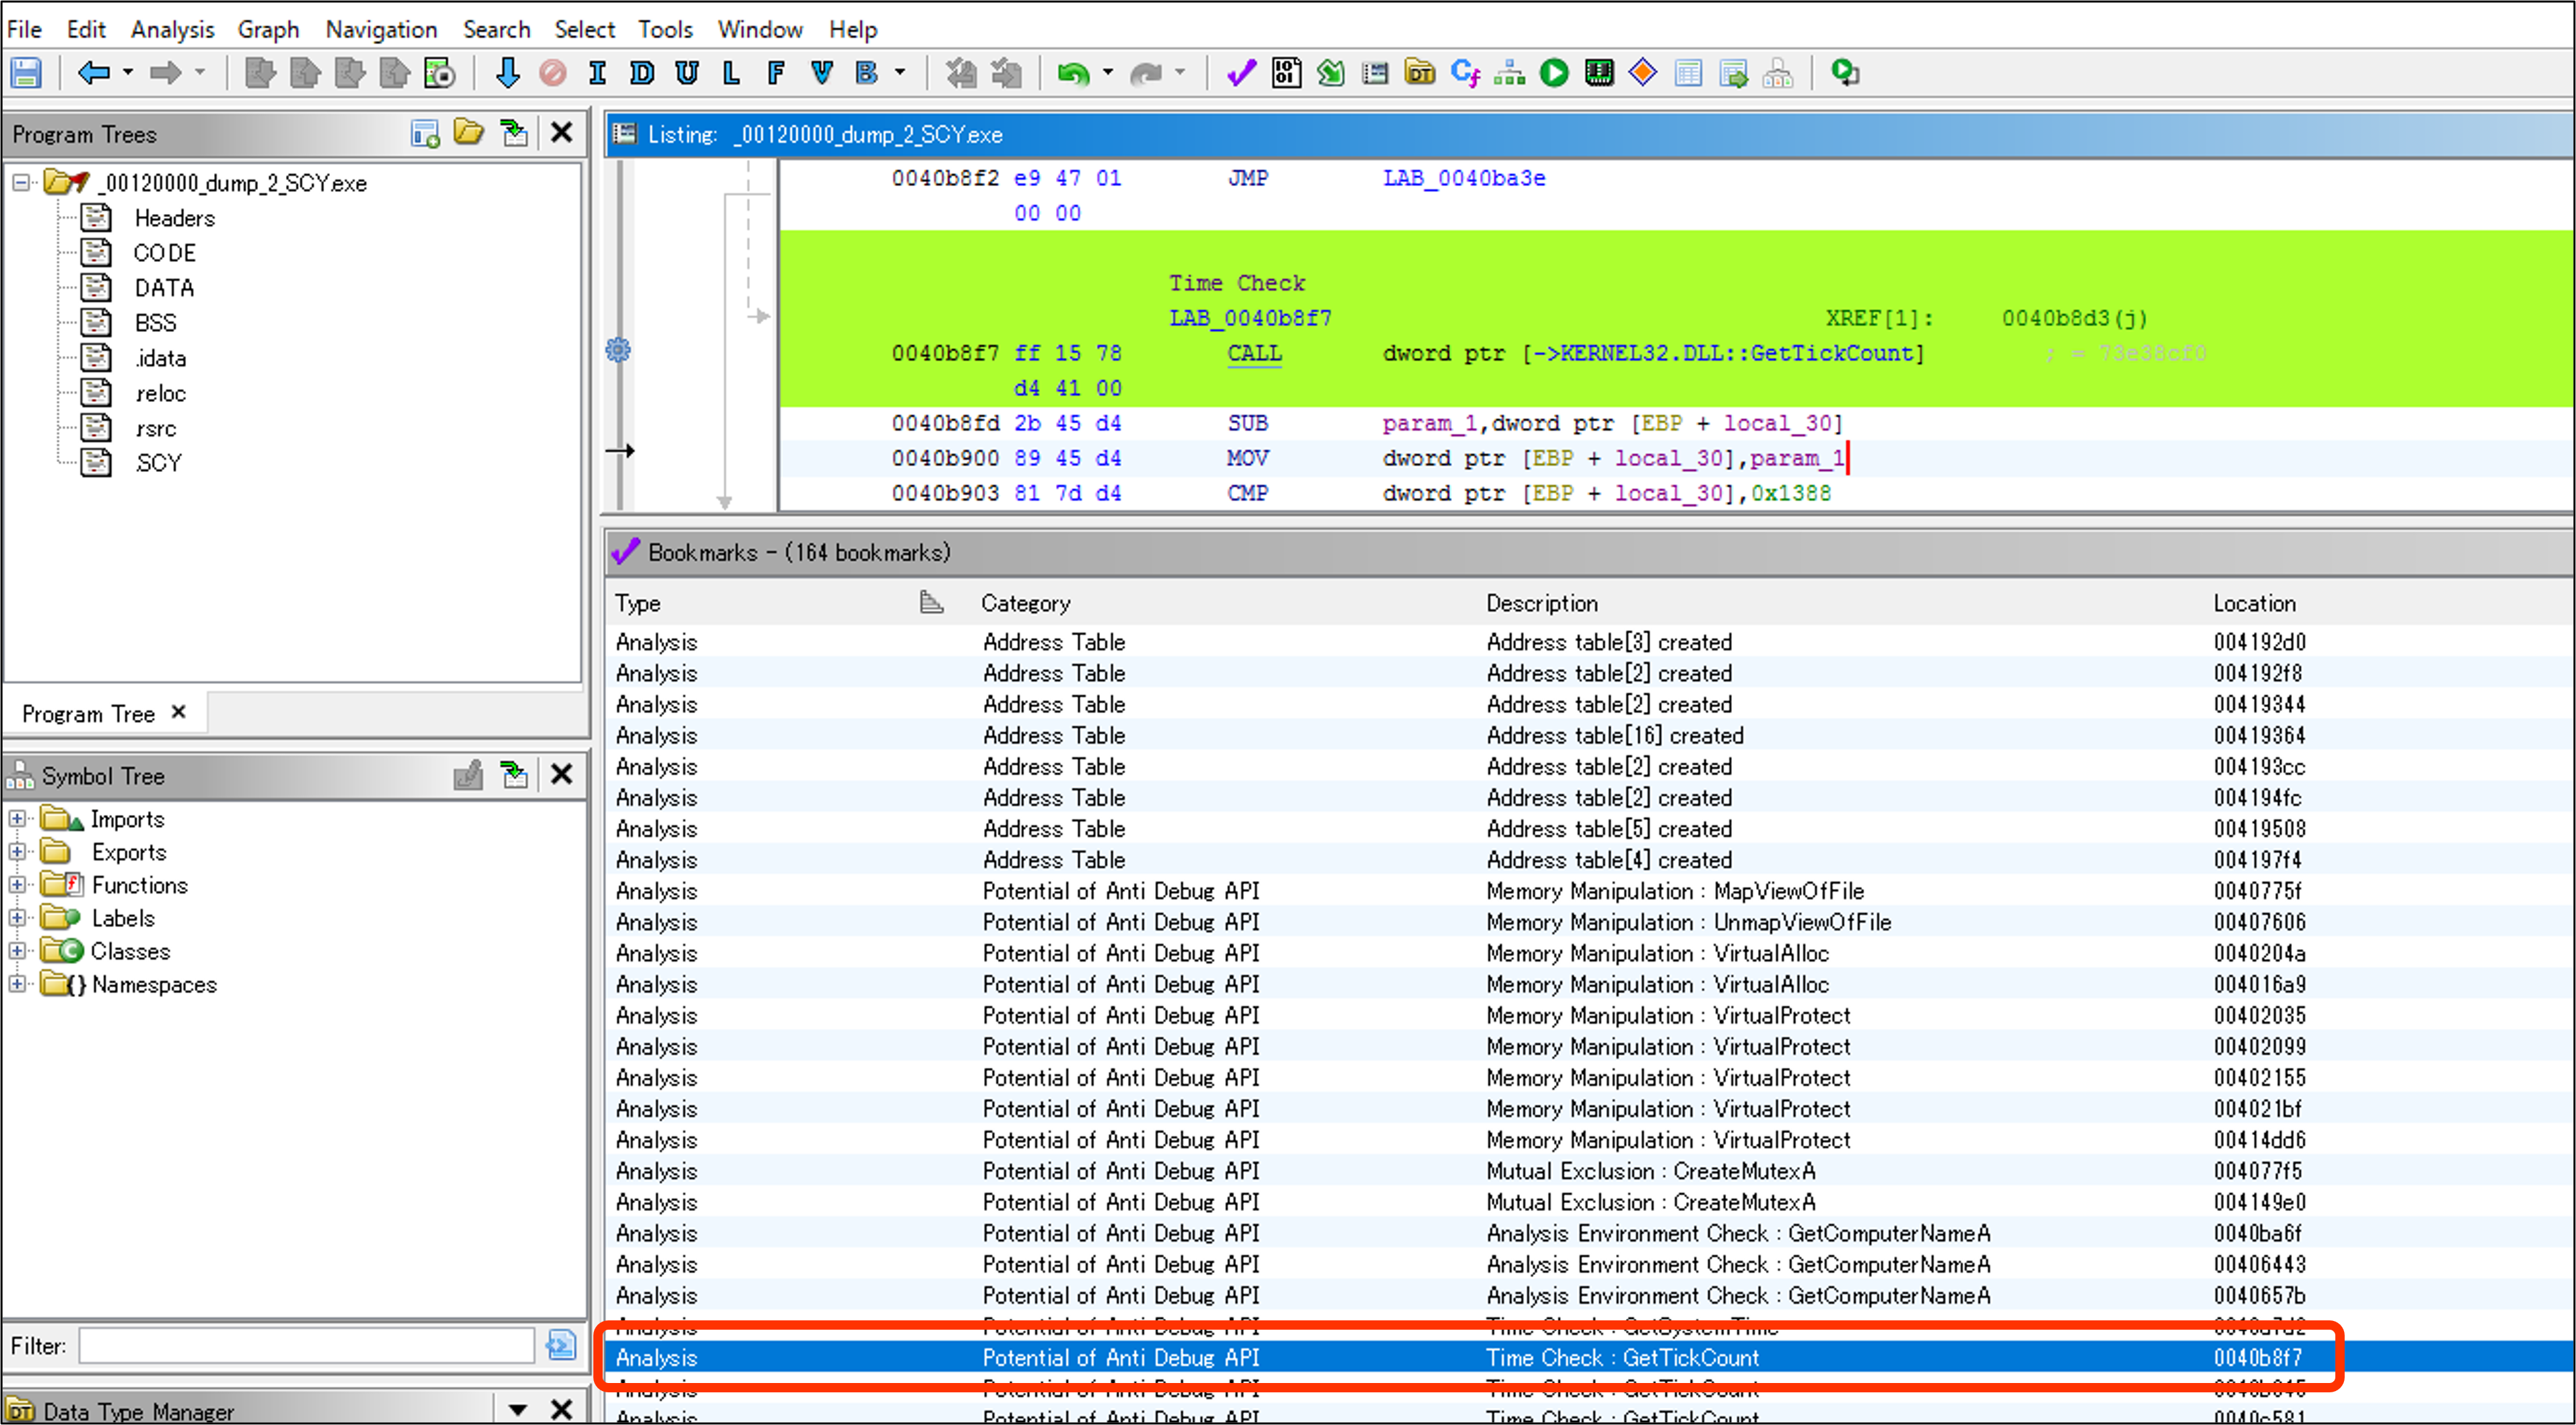
You can check where all the keywords are being detected and view the detection results
from the "Potential of Anti Debug API" category and the "Anti Debug Technique" section.
Items detected by the Anti Debug API will have a green background color, and the rule name will be set as a PRE comment.
Items detected by the Anti Debug Technique will have an orange background color, and the rule name will be set as a PRE comment.
The details of the rule will be displayed as a POST comment from the data of the loaded JSON file.
The following is a list of rule names defined in the Anti_Debug_Technique section of the anti_debug_Ghidra.config.
VMware_I/O_port
VMware_magic_value
HeapTailMarker
KernelDebuggerMarker
DbgBreakPoint_RET
DbgUiRemoteBreakin_Debugger_Terminate
PMCCheck_RDPMC
TimingCheck_RDTSC
SkipPrefixes_INT1
INT2D_interrupt_check
INT3_interrupt_check
EXCEPTION_BREAKPOINT
ICE_interrupt_check
DBG_PRINTEXCEPTION_C
TrapFlag_SingleStepException
BeingDebugged_check
NtGlobalFlag_check
NtGlobalFlag_check_2
HeapFlags
HeapForceFlags
Combination_of_HEAP_Flags
Combination_of_HEAP_Flags_2
ReadHeapFlags
ReadHeapFlags_2
DebugPrivileges_Check
CreateMutex_AlreadyExist
CreateEvent_AlreadyExist
Opened_Exclusively_Check
EXCEPTION_INVALID_HANDLE_1
EXCEPTION_INVALID_HANDLE_2
Memory_EXECUTE_READWRITE_1
Memory_EXECUTE_READWRITE_2
Memory_Region_Tracking
Check_BreakPoint_Memory_1
Check_BreakPoint_Memory_2
Software_Breakpoints_Check
Hardware_Breakpoints_Check
ChildProcess_Check
Enumerate_Running_Processes
ThreadHideFromDebugger
NtQueryInformationProcess_PDPort
NtQueryInformationProcess_PDFlags
NtQueryInformationProcess_PDObjectHandle
NtQuerySystemInformation_KD_Check
Extract_Resource_Section
Commucate_function_String
Commucate_function
