MemAxes is a tool for visualizing memory access samples acquired by load/store sampling mechanisms like Intel PEBS or AMD IBS. It allows a user to view the data projected into various domains; specifically, the layout of the hardware resources, the code/variables, the dataset domain, and parallel coordinates.
MemAxes requires Qt5 and VTK. It also requires CMake version 2.8.9 or higher, in order to build Qt5.
-
Make sure that Qt5 and VTK are installed, and add their install locations to the
CMAKE_PREFIX_PATHenvironment variable. -
Run the following commands from the root of the MemAxes source:
mkdir build && cd build
cmake -DCMAKE_INSTALL_PREFIX=/path/to/install/location ..
make
make install
- Select File → Load Data from the menu.
- Select the lulesh directory from the
example_datadirectory. In an installed version of MemAxes, this is in$prefix/share/example_data.
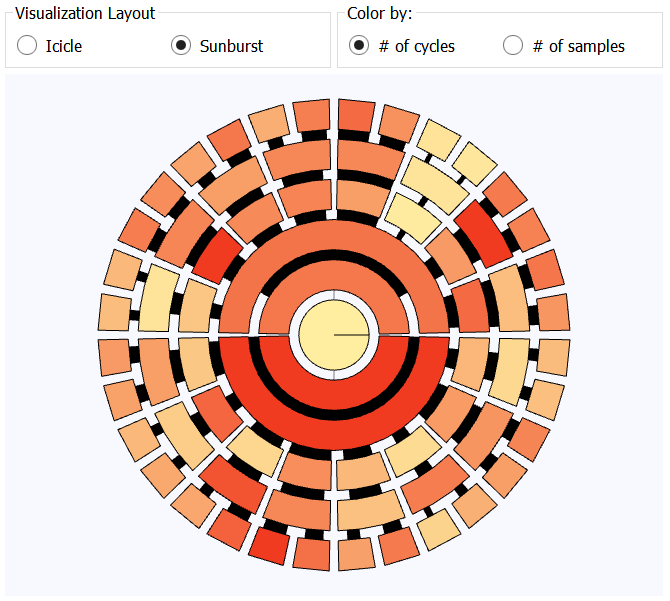
The hardware resources of a node are displayed as a hierarchy. Internal nodes in the hierarchy represent memory resources, i.e. NUMA nodes and caches, and leaves represent logical processors. MemAxes can show this hierarchy either radially (as shown) or vertically, by choosing either Sunburst or Icicle, respectively.
The colors of the segments within the hierarchy represent either total memory access cycles associated with the resource or total memory access samples associated with it (you can select an option in the top pane).
The thick black lines between segments represent the total number of transactions between pairs of resources, assuming the hardware copies memory between caches from largest to smallest after the memory is found.
Nodes may be selected by clicking, upon which all samples associated with the clicked resource will be selected. On mouse hover, a tooltip shows metadata associated with the resource.
The code view shows lines of code and variables associated with the most total memory access cycles, deemed "top offenders", in order from highest to lowest. Underneath, a text browser shows the source for the top offending line of code (not shown).
Either lines or variables may be selected by clicking, upon which all samples associated with that line or variable will be selected.
If samples are mapped to x, y, and z locations, the application context view shows a direct volume rendering of the number of samples associated with each location on a uniform grid. The transfer function automatically configures based on the selection, such that the average values are shown in green with half opacity, the maximum values are shown in red with full opacity, and the lowest values are shown in blue with nearly zero opacity. The user may manually configure the transfer function as well (though primitively, for now).
There is no selection capability in this view, but the rendering will represent the current selection only (or the entire dataset, if nothing is selected).
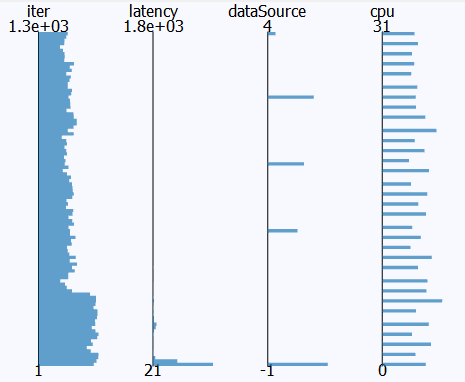
This view shows a histogram of each axis for the current selection (or for all the data, if nothing is selected).
The user may select ranges on any axis by clicking and dragging vertically on an axis, as well as rearrange axes by dragging the name of the axis left or right.
MemAxes includes a console to show and execute data operations. These include loading data, selecting samples in different ways, and changing the visibility of samples. This is currently a WIP, you may try some of the example commands but keep in mind many of them won't work just yet ;)
MemAxes was written by Alfredo Gimenez.
MemAxes is distributed under the Apache-2.0 license with the LLVM exception. All new contributions must be made under this license. Copyrights and patents in the Mitos project are retained by contributors. No copyright assignment is required to contribute to MemAxes.
See LICENSE and NOTICE for details.
SPDX-License-Identifier: (Apache-2.0 WITH LLVM-exception)
LLNL-CODE-838739


