Monitor your server with the TICK Stack from InfluxData. The TICK Stack results in a platform composed of open source components which makes collection, storage, graphing and alerting on-time series data such as metrics and events easy.
Collectively, Telegraf, InfluxDB, Chronograf and Kapacitor are known as the TICK Stack.
The TICK Stack is a loosely coupled yet tightly integrated set of open source projects designed to handle massive amounts of time-stamped information to support your metrics analysis needs.
Telegraf is a plugin-driven server agent for collecting and reporting metrics.
InfluxDB is a time series database built from the ground up to handle high write and query loads. Is a custom high-performance datastore written specifically for time-stamped data, and especially helpful for use cases such as DevOps monitoring, IoT monitoring, and real-time analytics.
Chronograf is the administrative user interface and visualization engine of the stack. Setup and maintain the monitoring and alerting for your infrastructure.
Kapacitor is a native data processing engine. It can process both stream and batch data from InfluxDB. Kapacitor lets you plug in your own custom logic or user-defined functions to process alerts with dynamic thresholds, match metrics for patterns, compute statistical anomalies, and perform specific actions based on these alerts, like dynamic load rebalancing.
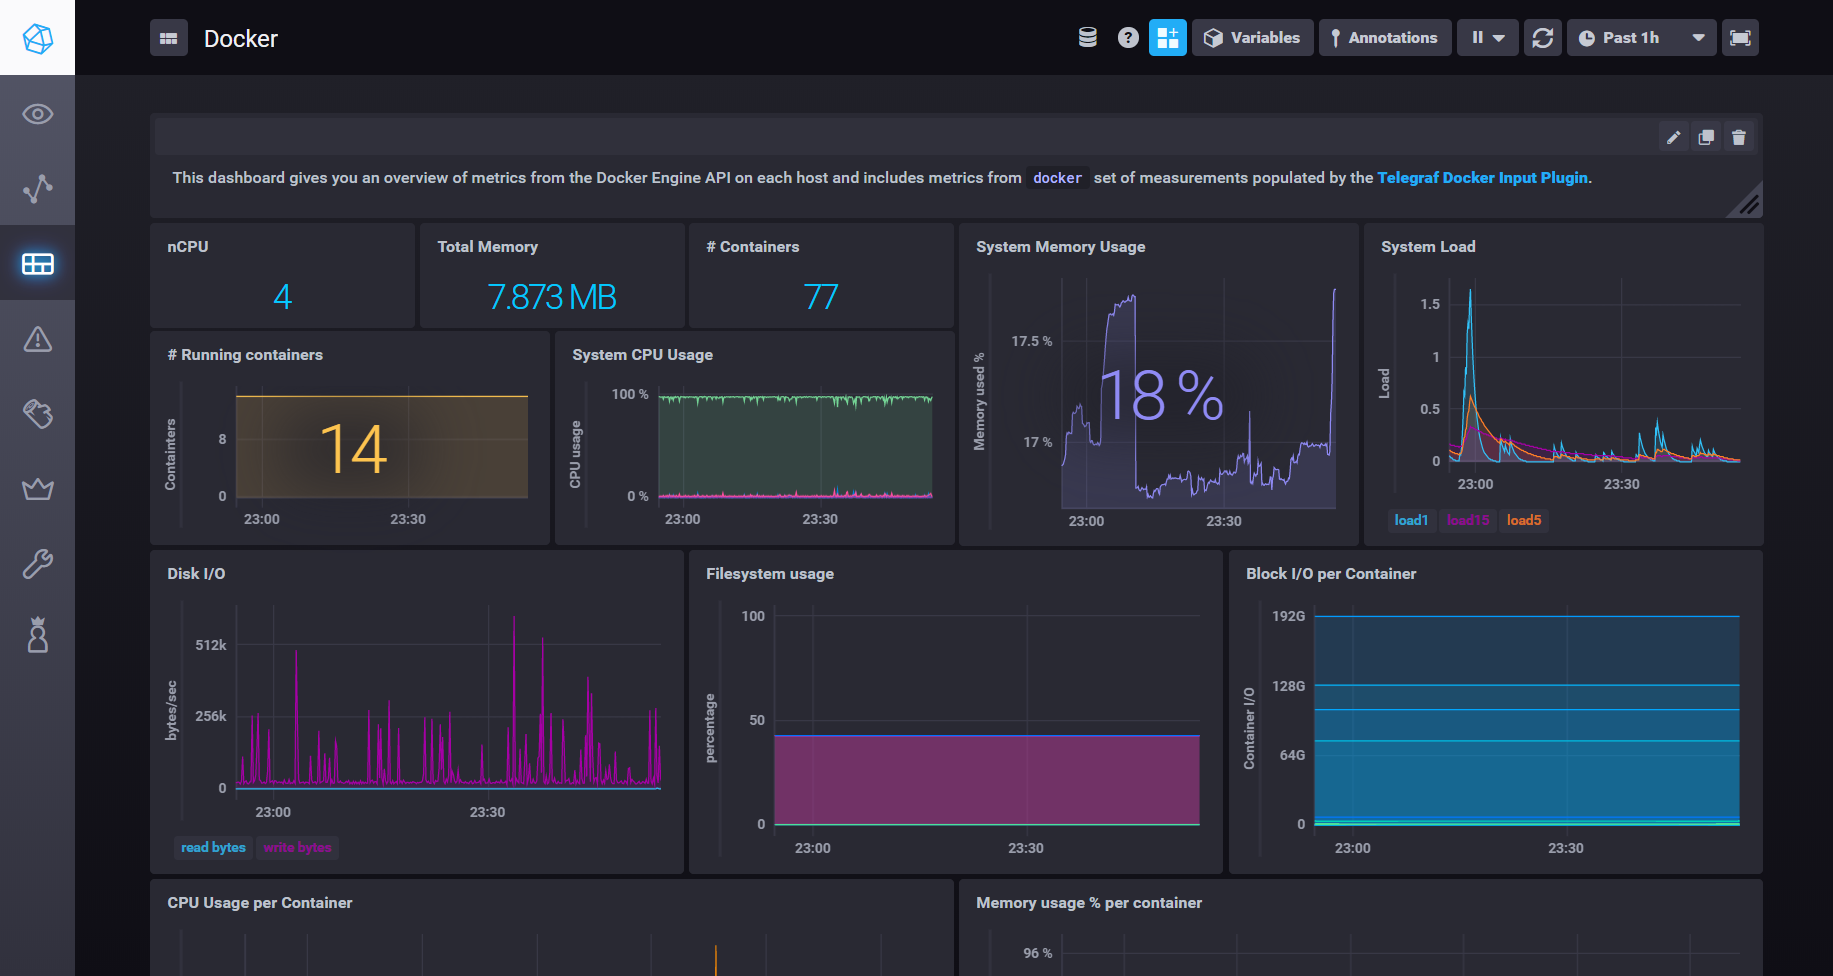
- Configure Docker Monitoring
- Check Telegraf, in
docker-compose.yml, has shared the docker daemon, L.9 - Input should be set in
telegraf.conf, L.126-L.174 - More info
- Check Telegraf, in
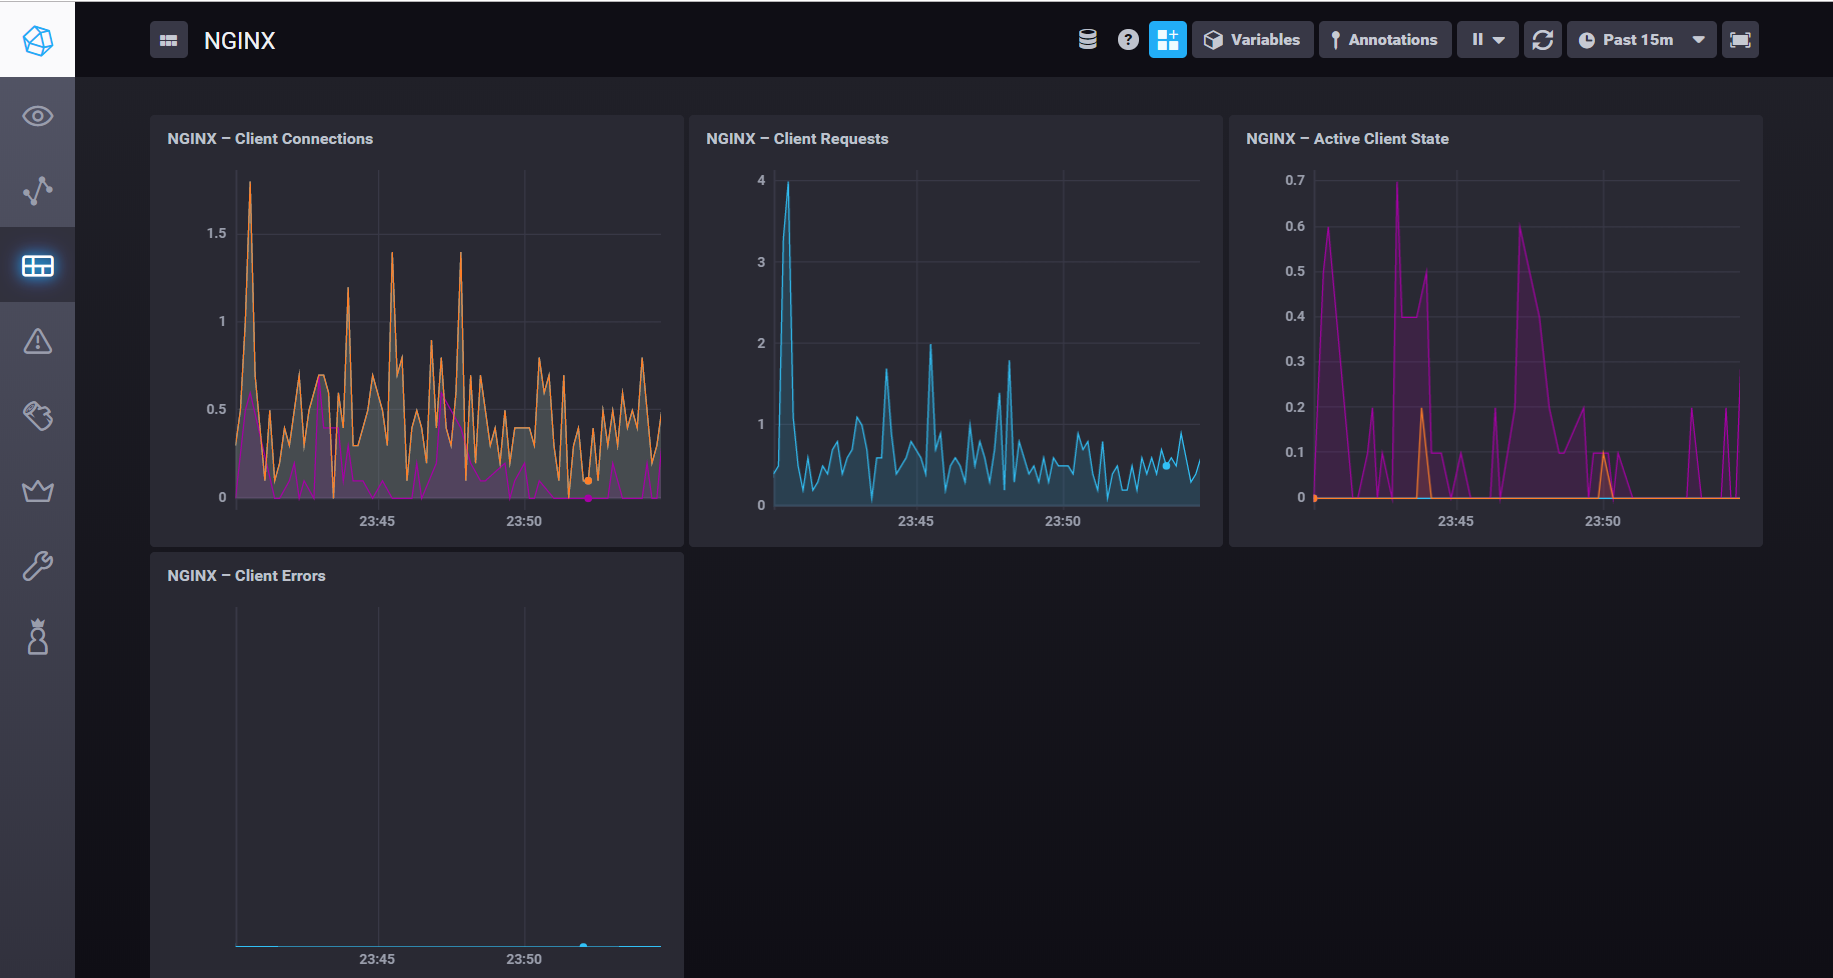
- Configure NGINX Monitoring
- Input should be set in
telegraf.conf, L.176-L.178 - Add your URL with the
/metricsendpoint. - More info
- Input should be set in
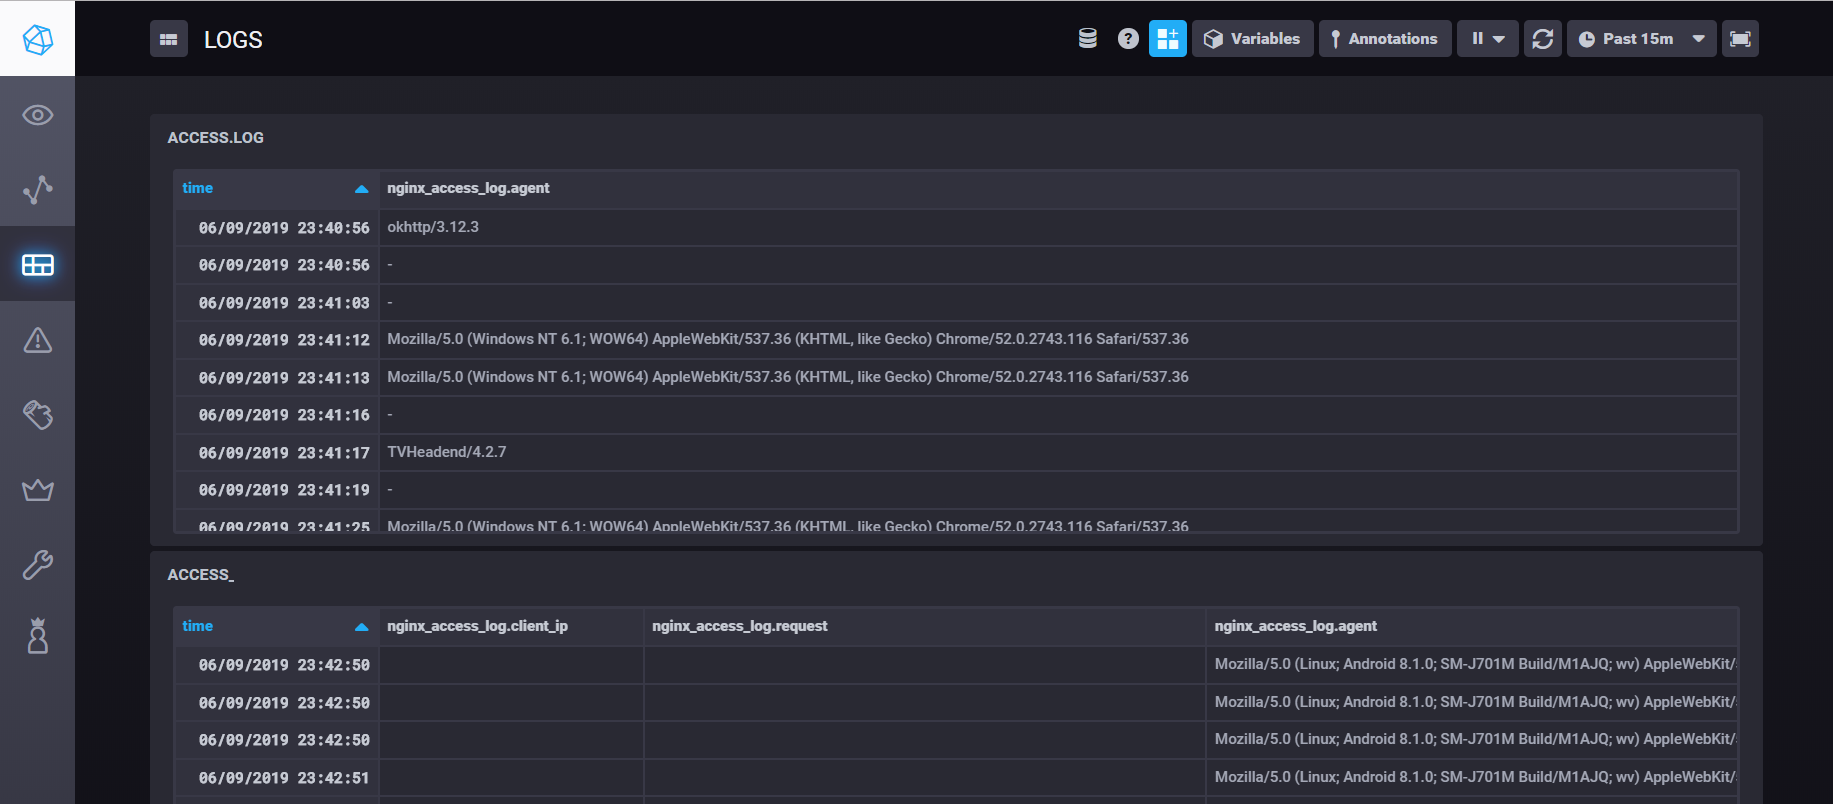
- Configure Log parser Monitoring
- Input should be set in
telegraf.conf, L.180-L.187
- Input should be set in
- Configure Google OAuth Login
After the setup, run docker-compose up -d and the full stack will be running in YOUR_IP:8888.


