Labelbox is the world’s leading training data platform for machine learning applications.
Starter code for monitoring production models with Labelbox & Grafana
- This project demonstrates how to do the following:
- Train a neural network using data from Labelbox
- Deploy the trained model with instrumentation to push data to Labelbox
- Monitor the model performance over time using Labelbox
- inference-svc
- Service for hosting the instrumented model client
- Routes data to labelbox
- tensorflow-svc
- Hosts the tfhub model
- monitor-svc
- Sends model inferences to Labelbox for Model Assisted Labeling
- Once an inference is labeled a webhook sends data to this service to computes metrics
- Metrics are then pushed to Influxdb for viewing on Grafana
- Predictions are pushed to Model Diagnostics for viewing
- grafana
- Metric dashboarding tool
- Login: admin, pass
- influxdb
- Timeseries metrics database used for storing data for grafana
- storage
- Local deployment of s3 emulator to simplify deployment
Run the following code commands once
make download-model- Downloads a tfhub model
make configure-labelbox- Create a config file used to parameterize the deployment (see services/monitor-svc/labelbox_conf.json)
make configure-storage- Creates the local storage directory structure under
./storage
- Creates the local storage directory structure under
We use docker compose to deploy the various components. We use Ngrok to make the deployment available
on your local machine to Labelbox webhooks.
Must have the following env vars set:
LABELBOX_API_KEY: Labelbox API KeyNGROK_TOKEN: Enables labelbox webhooks to make requests to deployments without public ip addresses
Run make deploy
Now we can send predictions to the model. See scripts/sample_inference.py for an example of sending predictions.
The first request might fail due to a timeout since we did not add warm up to the tf-server.
Predictions are sampled and uploaded to the Labelbox project created for the model. Go to that project and begin labeling.
Once an image has been labeled, giving the label a thumbs up in review mode publish data to monitor-svc.
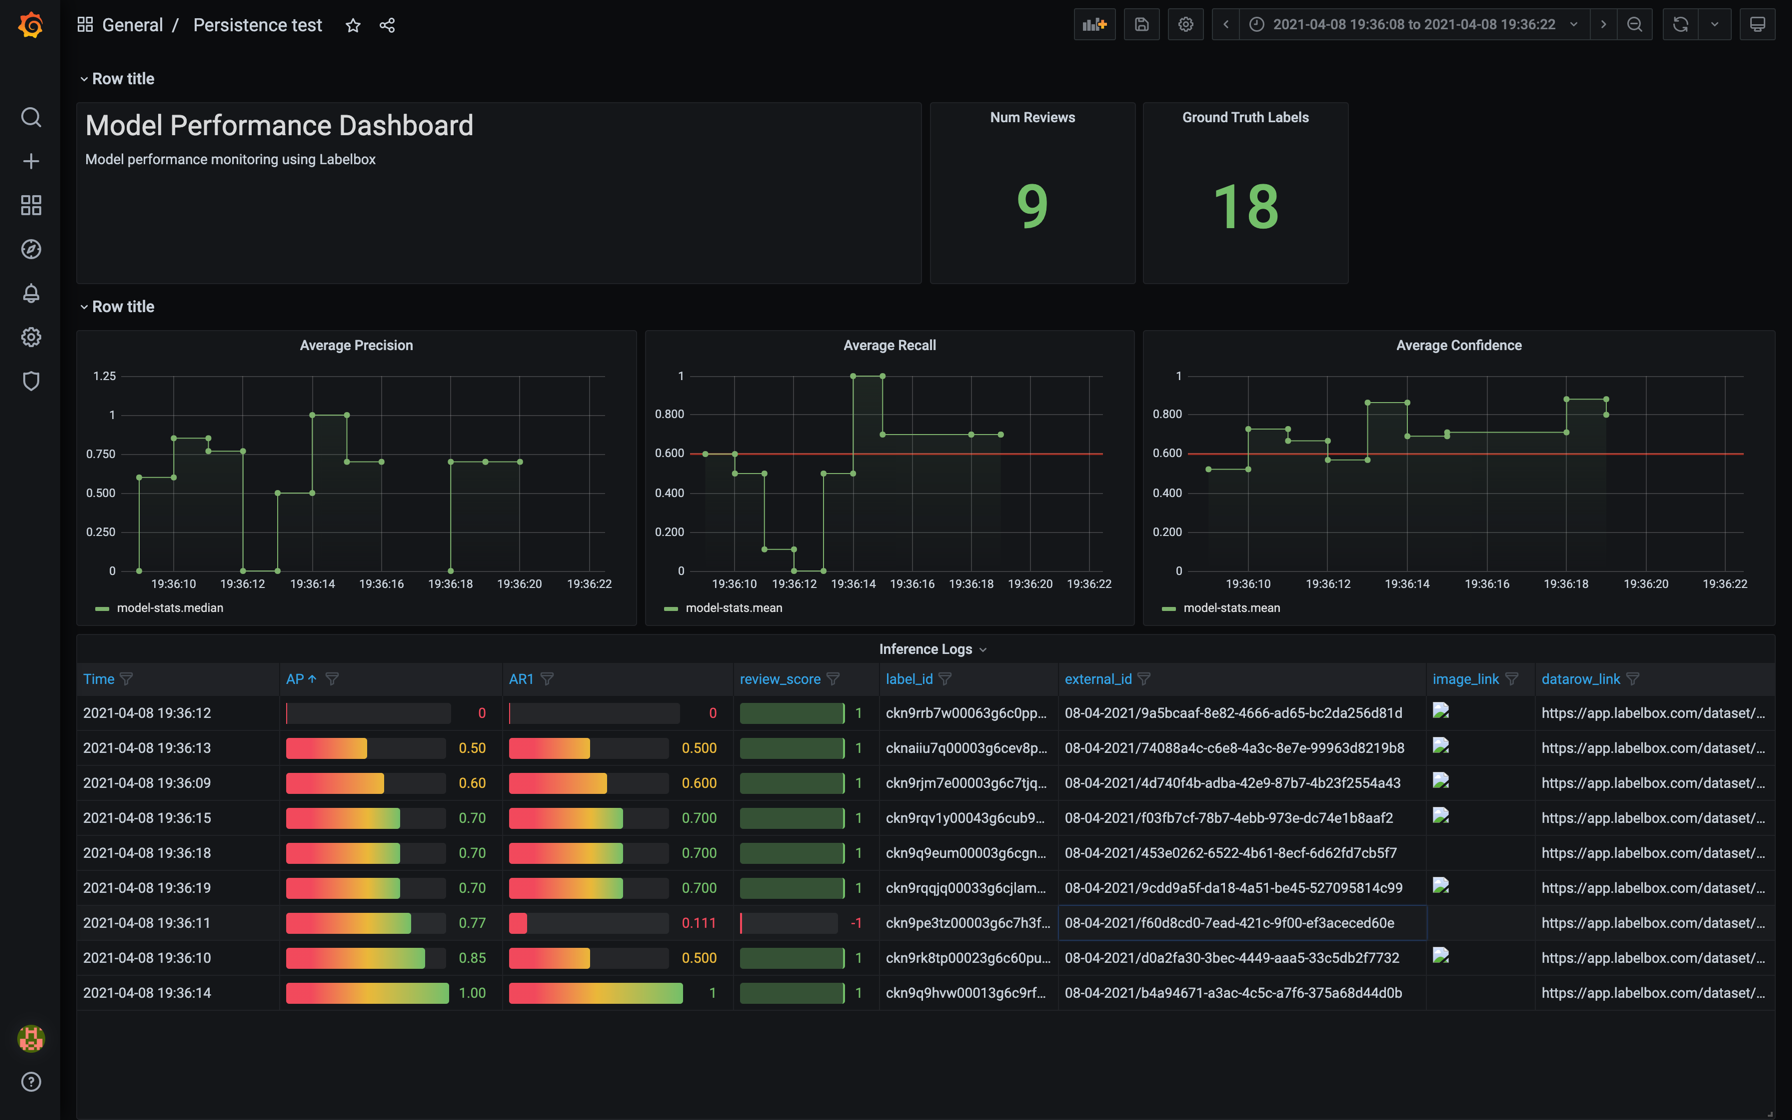
We use Grafana and InfluxDB for tracking and viewing metrics. If you ran this on your local machine, navigate to http://localhost:3005.
To login use the username and password configured in the docker-compose file. By default the username is admin and the password is pass.
Navigate to http://localhost:3005/dashboard/import to import our pre-built dashboard. The pre-built dashboard can be
found under services/grafana/dashboards/model-monitoring.json.


