This is the first project of Udacity's Data Scientist Nanodegree. The objective is two-fold:
- provide an insightful technical analysis of Airbnb offering in Boston, USA. Data from September 2022 has been used for this analysis which can be found in this readme file and associated jupyter notebook included in this repository.
- write a blogpost explaining the findings in non-technical terms to address the largest, non-technical, audience. The associated blogpost can be found here.
This analysis combines various techniques as our dataset requires numerical, statistical, NLP type of analysis. The project will be conducted following this framework:
- Framing key relevant business questions worth analyzing
- Data understanding
- Data preparation for the analysis and modeling steps
- Data analysis and modeling (including regression model for price prediction)
- Result evaluation The deployment is not covered here. The trained model artifact could nevertheless be used for inference using an API.
The Boston datasets I used were up-to-date at the time of my analysis. These were extracted in September 2022 by Airbnb Inside and the originals can be found here. Airbnb Inside regularly provides up-to-date datasets for most major cities around the world.
The datasets are composed of 3 files which can be found in the Datasets folder of this repository. Those 3 files cover:
- Listings.csv which includes the full description of each properties, owner datails and several review kpis and scores
- Reviews.csv which includes unique id for each reviewer and detailed comments
- Calendar.csv which includes property id, the daily rental price and availability by day from September 15, 2022 onwards. This file provides a snapshot of the reservations as of september and looking forward into the year 2023.
The analysis answers 6 business questions as follows:
- Price seasonality during the year - By how much do prices spike?
- What are the busiest times of the year to visit Boston?
- Is there a general upward trend of both new Airbnb listings and total Airbnb visitors to Boston?
- Can you describe the vibe of each Boston neighborhood using listing descriptions?
- Can you predict the rental price of a new property based on available features ?
- Can the property text description from the host improve the prediction ?
Key challenge comes from the following real-life constraint: We want to provide the best possible prediction model for an new Airbnb property assuming we will not have part of the datailed KPis regarding reviews and host. Indeed, this being a new property added to Airbnb, we assume we can only rely on the property detailed description, localization and service offering prepared by the future new host.
The detailed, step-by-step, analysis is performed in the jupyter notebook Boston_Airbnb_analysis.ipynb provided in the project repository.
The notebook was executed under windows python v3.8 in a virtual environment. It will require a set of standard packages reflected by the list of imports found in the notebook.
The datasets are provided in the datasets folder.
For additional model experiments during preliminary exploratory work please check out the other notebook additional_modeling_experiments.ipynb.
These can be found in the notebook with detailed working steps and conclusions.
We will summarize here the results for Question 6. Detailed steps can be found in the notebook. Because we want to propose a price-point for a new property, I chose to rely on features available in such situation. These cover:
- property localization
- property capacity
- property service offering referred as
amenities - property description by the host to be posted onto Airbnb platform
Under this constraint, I used a total of 5,841 features corresponding to:
- 5 continuous variables: 'accommodates','bedrooms','beds','latitude','longitude'
- 4 categorical variables encoded using one-hot vectors: 'property_type','room_type','bathrooms_text','neighbourhood_cleansed' These features capture the gist of the property localization, property type and capacity. These variables were complemented by
- 1,125 feature vectors corresponding to the items composing
amenitieslist at each property (1 item = 1 binary column vector encoding the item presence or not at each property) - Another sparse matrix corresponding to the top words occurence extracted from the property
descriptionfield with 4,619 columns (or words). The sparse matrix corresponds to the word-occurence matrix from corpus of descriptions vectorized using nltk.
Analysis was performed on a dataset of size 4,921 rental properties (after elimination of price outliers using 1.5 x IQR). 20% were reserved for model performance evaluation and 80% used for training.
Baseline performance measures without description-based features and using a ridge linear model:
- RMSE: 60.3 USD
- R² coefficient: 0.65
Best performance measured on the test set is achieved with XGBoostRegressor model using cross-validation:
| Metric | Baseline model | excl. description features | incl. description features |
|---|---|---|---|
| RMSE | 69.3 | 61.9 | 58.6 |
| R² | 0.65 | 0.72 | 0.75 |
Both RMSE and R² coefficient further improve using text-based description features.
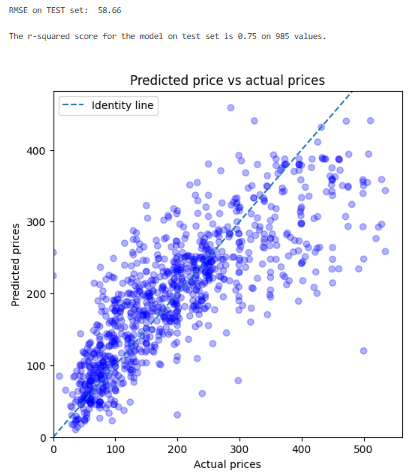
Prediction performance using our best model following hyper-parameter tuning:
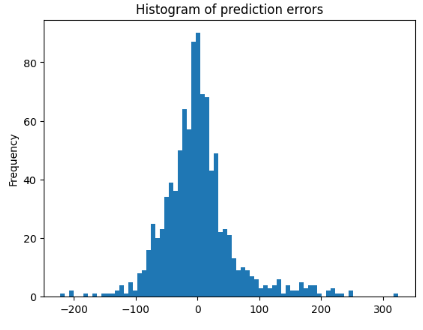
Our prediction error has a nice gaussian distribution shape. This means the error is equally over or below the ground thruth.
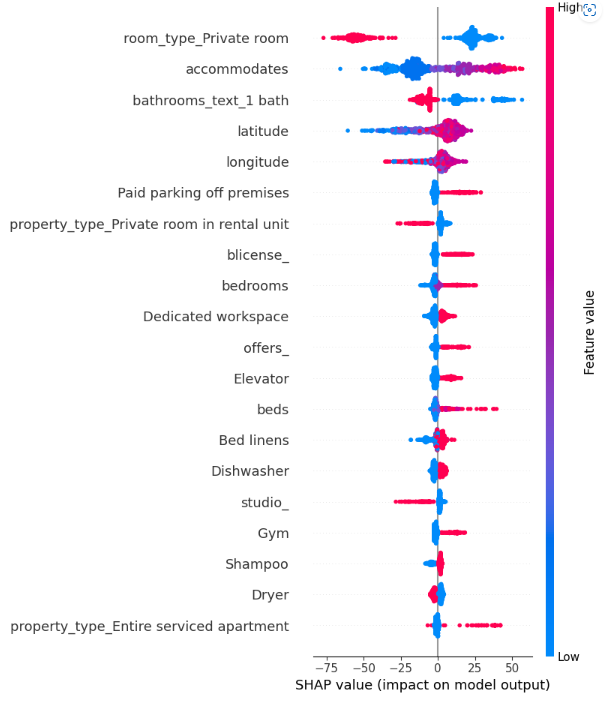
Using Shap library, we finally explore the influence of most influential features on price. These appear to be the room type, the capacity and various facility/service offering (paid-parking, fully-serviced, gym, elevator...). Such amenities justify pushing prices up. On the contrary, no private room implies a substantial discount. Finally, the property localization through latitude and longitude also has an influence, diminishing prices as we move away from the center.
The regression model achieves a RMSE of 58 and explains over 75% of the price variance. We have identified most influential features and those having less impact. Based on these results, a new host, missing price-point references, could use our model and findings to better assess a realistic price and leverage specific amenities particularly valued by guests.
As next steps, it could be interesting to train-test a fully-connected neural network or to extend our approach to forecasting "daily" prices using the calendar dataset in order to apprehend price seasonality.


