Welcome! GraphWorld (arxiv) is a method and toolbox for graph learning researchers to systematically test new models on synthetic graph datasets.
Why synthetic? Graph learning experimentation over time has depended largely on the same collection of citation network, social network, and molecular datasets (such as Cora, CiteSeer, etc.). For a particular task such as node classification, the datasets have similar statistical properties, e.g. homophily. Therefore it is usually impossible to know how GNN experimental results generalize beyond the standard citation network benchmarks. Furthermore, GNN researchers are incentivized to optimize their innovations toward these datasets.
GraphWorld uses scalable synthetic graph generation to address these issues. A user can specify a generative model for a task, and any number of parameters that control the statistical properties of the generator. GraphWorld then samples from the generator to produce a diverse "world" of graph datasets, on which standard benchmark datasets are just individual points. GraphWorld also trains and tests any number of (user-)specified GNN models on each synthetic dataset, and outputs easily-consumable tabular data for analyzing the results. This allows researchers to test GNNs far outside the statistical realm of the usual datasets! Check out our official Google AI blog post for more detail!
The animation below was constructed from a GraphWorld node classification pipeline. It shows that GNN model rankings actually change when they are tested on GraphWorld datasets with different statistical properties than the classic benchmarks.
GraphWorld can be run on the cloud or on your personal computer. Here is a working example that can be run on a PC. In this small GraphWorld experiment, we will see how variance in the label homophily of graph datasets affect GNN node classification performance.
A user of GraphWorld decides on a generative model for
the task (in this case, node classification). GraphWorld comes with default
generative models for node classification, link prediction, and graph property
prediction. In this codebase (and in our
paper), we use the Stochastic Block Model
(SBM) as the default generative model for node classification datasets. In our
implementation of the SBM, the parameter p_to_q_ratio controls the ratio of
the probability that two nodes in the same class connect, relative to the
probability that two nodes in different classes connect. GraphWorld will
generate many synthetic graphs with uniformly-sampled values of p_to_q_ratio,
allowing for the analysis of GNN models on graphs with many different homophily
levels.
Here are the steps to run the pipeline:
-
Install Docker.
-
Build the local version of the GraphWorld docker image:
./build_local.sh. This should take about 5 minutes. -
Run the GraphWorld pipeline with
./main_local_mwe.sh! This should also take about 5 minutes.
What happened? GraphWorld generated 500 instances of the SBM, each with a
different sampled value of p_to_q_ratio from the range specified in
configs/sbm_generator_config_mwe.gin. It then trained and tested the four
GNN models specified in sbm_config_mwe.gin (GCN and GAT), and saved the test
metrics to the local folder /tmp/mwe, specified in ./main_local_mwe.sh.
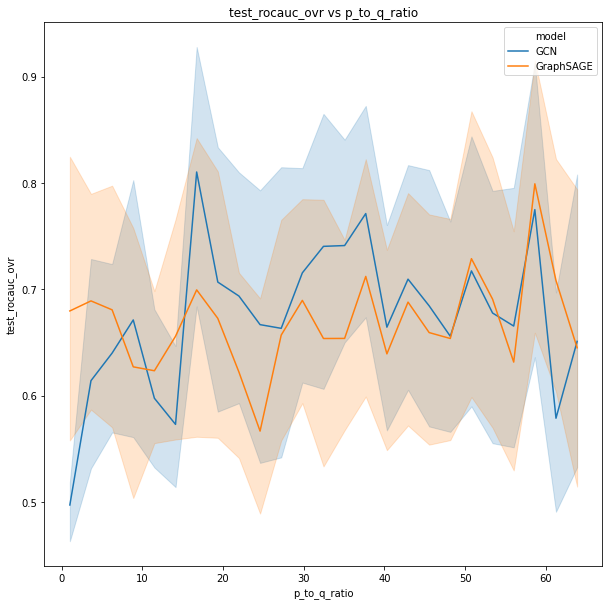
Let's analyze the test metrics to see how well the four models did. You can run
the GraphWorld_README_Example notebook to compare GCN and GAT over the space
of graphs generated by GraphWorld:
We see that both models slightly increase their
average performance as p_to_q_ratio goes up -- this makes sense,
as more-homophilous classes are easier to classify! However, the observed
increase is very slight, since these averages are computed over SBM graphs
with very different properties, which could interfere with the homophily
effect. In our paper, we describe ways to use GraphWorld to tease out
marginal effects of various generator parameters and graph statistics,
resulting in higher-res analyses.
The analysis functions in the notebook can also be used to explore the relationship between GNN models and other parameters of the SBM, and even graph statistics computed after-the-fact (non-parameters). Additionally, GraphWorld supports:
- Large-scale experiments using Google Cloud Platform
- Custom graph generators and brand-new tasks
- Any GNN model you can implement in Python
In the coming months, we will release instructions for these extensions to enable our future power-users!
See CONTRIBUTING.md for details.
Apache 2.0; see LICENSE for details.
This project is not an official Google project. It is not supported by Google and Google specifically disclaims all warranties as to its quality, merchantability, or fitness for a particular purpose.

