3 components in one-stop, and very useful for local monitoring development:
- Grafana
- Prometheus
- Prometheus-pushgateway
- Prometheus-alertmanager
- make sure you have docker-compose installed
- execute commands next:
git clone https://github.com/morganwu277/docker-app-grafana-prometheus
# create and start container
docker-compose up -d
# stop containers
docker-compose stop
# start the created containers again
docker-compose start
- open
http://127.0.0.1:3000/for local grafana, it's up and a defaultprometheus-2-0-overviewdashboard is installed there.
-
Send metrics using pushgateway
After
docker-compose up -d, you should be able to see andocker-app-grafana-prometheus_prometheus-client-example_1container running there doing next tasks:Here is the script we can use to send metrics:
# prometheus gateway server info
HOST="127.0.0.1"
PORT="9091"
PROTOCOL="http"

function push_prometheus {
  metric_name="$1"
  value="$2"
  instance="$3"
  cat <<EOF | curl --data-binary @- ${PROTOCOL}://${HOST}:${PORT}/metrics/job/my_exporter/instance/$instance
  # HELP $metric_name Metric autogenerated by my customized application
  # TYPE $metric_name gauge
  $metric_name{provider="app1"} $value
EOF
}
# how to use it?
#push_prometheus "$prometheus_metric_name" "$value" "$instance"
Here I send the random values every 5 seconds
while true; do
  push_prometheus "web_active_users" "$(($RANDOM%10))" "web_frontend_server1"
  push_prometheus "web_active_users" "$(($RANDOM%10))" "web_frontend_server2"
  push_prometheus "web_active_users" "$(($RANDOM%10))" "web_frontend_server3"
  sleep 15
done
-
Review the metric, you have 2 options:
Prometheus Web UI: open http://127.0.0.1:9090/graph and typeweb_active_usersGrafana: open http://127.0.0.1:3000/explore and typeweb_active_users
For PromQL, please check out https://prometheus.io/docs/prometheus/latest/querying/basics/
-
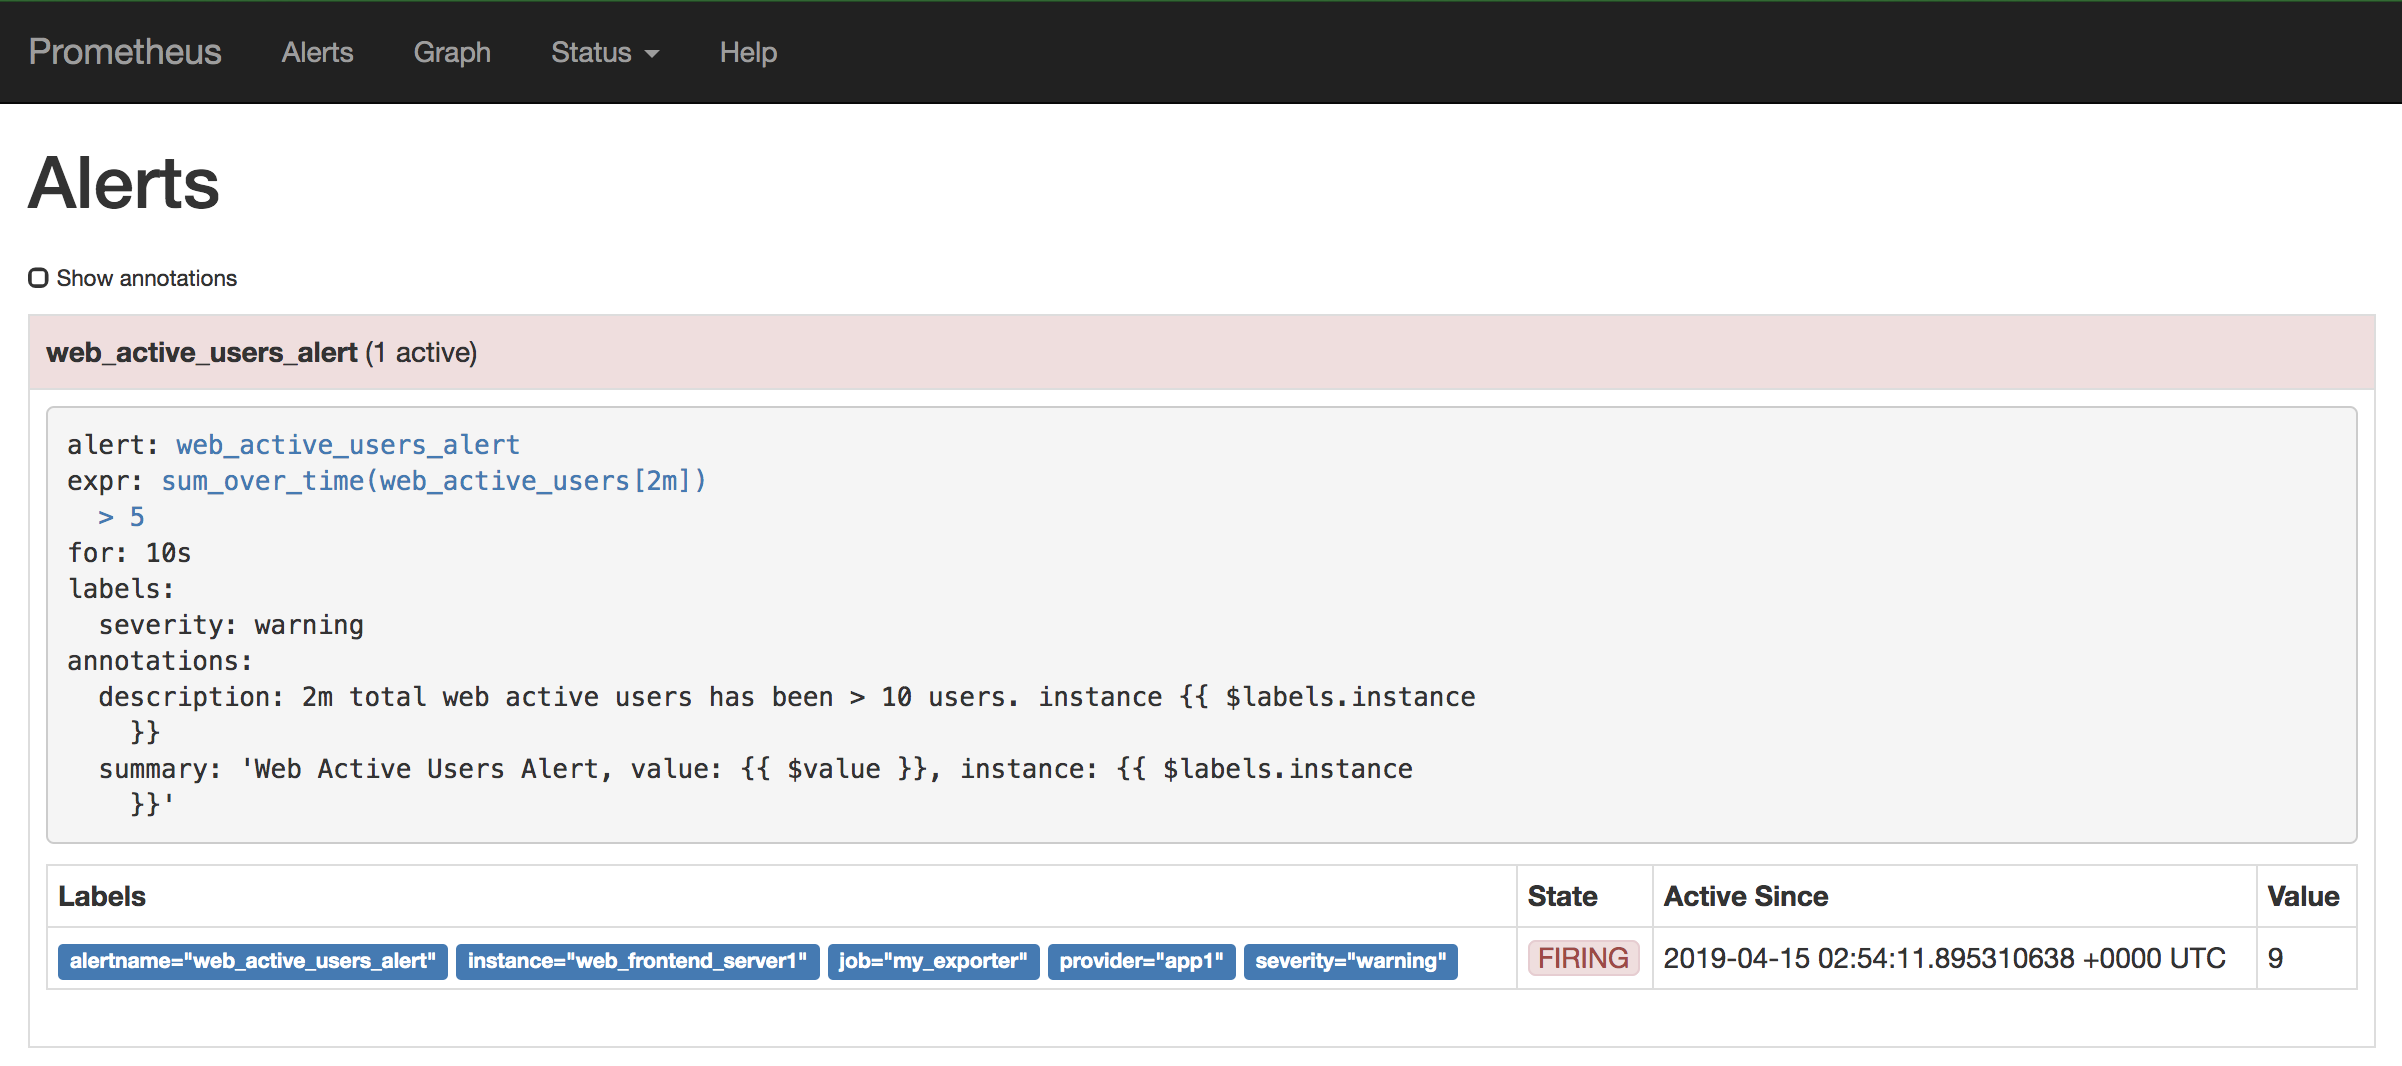
Creating alert alert rules in
./conf/prometheus/alerts,For alerting rules, please checkout https://prometheus.io/docs/prometheus/latest/configuration/alerting_rules/
You can checkout alerts firing using this link: http://127.0.0.1:9090/alerts , here is an example
-
Reload Prometheus config after creating alert rules:

docker exec docker-app-grafana-prometheus_prometheus-server_1 kill -HUP 1