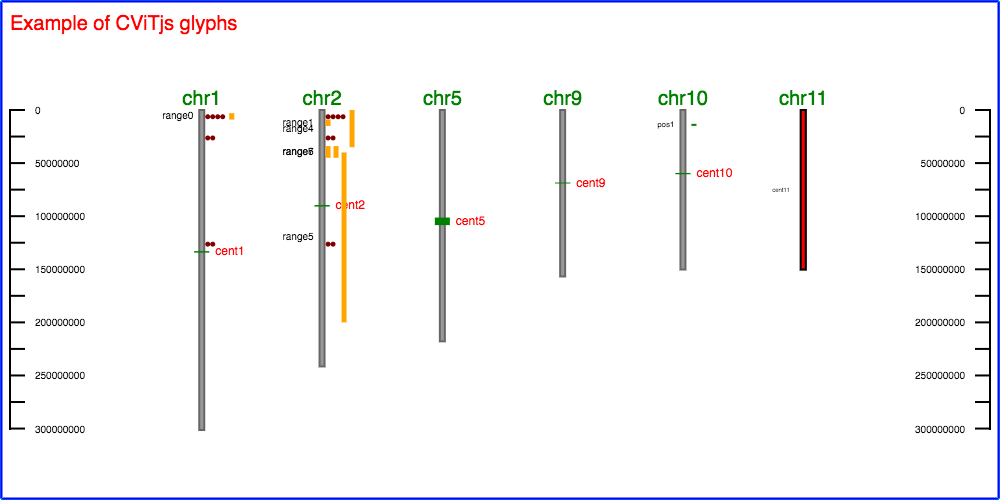
CViTjs is an interactive JavaScript implementation of the original Chromosome Visualization Tool (CViT), which was written in Perl. CViTjs displays features on chromosomes, linkage groups, or just about any sort of backbone that has length and a two-dimensional, linear coordinate system.
The tool is currently in beta. Feedback is gratefully accepted.
Functionality:
- Data is formatted in GFF3
- Place various types of features on "backbones" (e.g., centromeres, markers, gene models, regions)
- Similar to genome browsers, CViTjs has a concept of tracks, sets of features organized in a group.
- A track can be interactively turned on and off
- Zooming and panning
- Annotate an image with the drawing tool
- Export image to a png or svg.
Features:
- AMD style modules using RequireJS. Makes it easier to manage libraries, avoids polluting the global object, and allows for nicer later expansion.
- Software stack: Paper.js, RequireJS and jQuery.
CViTjs should work right out of the box. One or more data views are defined in cvit.conf, which is located in the root folder. Sample views are included in the starting cvit.conf.
[general]
data_default = test1

[data.test1]
conf = data/test1/cvit.conf
defaultData = data/test1/data.gff
The [general] section and at least one dataset definition is required in cvit.conf.
In this example, to display the test1 dataset the URL would be: your-CViTjs-URL/cvitjs/?data=test1
For each dataset you will need a GFF3 file defining the backbones and an image configuration file, typically named cvit.ini. Almost every aspect of the presentation of the image can be controlled in the configuration file. See the sample file in data/test1/ for more information.
Instead of keeping CViTjs in its own special page, it may be embedded to show related data. In the page's head include:
<link rel="stylesheet" href="[pathToCViTjs]/js/lib/bootstrap_embed/css/bootstrap.min.css" />
<link rel="stylesheet" href="[pathToCViTjs]/js/lib/hopscotch/css/hopscotch.min.css" />
<link rel="stylesheet" href="[pathToCViTjs]/css/cvit.css" />

<script data-main="[pathToCViTjs]/js/lib/require/require-embed-config" src="[pathToCViTjs]/js/lib/require/require.js"></script>
If you wish to use an alternative main.js entry point, you will have to edit require-config.
Replace the value in: deps: ["../main"] with the path to your custom main.js entry point, relative to the libs directory.
In the body of the page, all that is required is to place a <div id="cvit-div"> at the location you want to add CViTjs. By default this will display the default view set in the [general] section of the cvit.conf. If you wish to override this display, CViTjs recognises two data- attributes by default:
<div id="cvit-div" data-backbone="backbone" /div>
<div id="cvit-div" data-gff = "pathToGff" /div>
The backbone tag overrides the default dataset and uses the cvit.conf data settings for the provided backbone. The gff tag adds the provided gff to CViTjs to be drawn. These tags may be used seperately or combined to control an embedded instance of CViTjs. See examples/cvittest.html for an example of how this control works in practice.
<div id="title-div" /div> is entierly optional, and may be omitted.
You may wish to also set #viewButton and #title-div to display:none in the CSS (css/cvit.css)as well to ensure that the components don't render in the embedded context.
PHP can launch CViTjs with a calculated set of inputs. To control CViTjs, you may either pass in the desired view and gff using the data- tags, or you can export the desired information as a globaly accessible variable and access it directly from main.js. See examples/main.blast_ui.js for an example of this based on drupal exports.
Though not required for CViTjs to work, there is a gulpfile available for those that care. Right now it is just setup to do basic linting and beautification of the generated source. the default behavior also includes watching, so if you decided to edit any files, it will lint and beautify them for you.
If you have never used gulp before, it is a build system for JavaScript that requires NodeJS
Get Node here (or from your package manager): Get Node
- Navigate your terminal to the root of your copy of CViTjs.
- type:
npm install - This will use the node package manager (npm) to download local copies of the required gulp and node packages as listed in required.json
- type:
gulp - This will run all the tasks in the gulpfile. The current tasks are:
- lint: Runs a linter against the javascript in js/cvit. Will report out any problems it finds in the terminal.
- beautify: Makes the javascript pretty. In this case will go through and remove excess whitespace, and replace tabs with two spaces, as well as starndardize indent levels.
- watch: Watches for files in js/cvit to change.
- default: Runs all of the above tasks. With watch, this means that it will stay active in that terminal window until stopped (^C or equivalent) and run the lint and beautify tasks whenever it detects a change.
- Note you can run any task seperately by using
gulp <task>
Things to do on the way to the 1.0 release:
- Upload file manager
- Basic data validation
- Customized glyphs
- Advanced URI control
- Missing Glyphs:
- Measure
- Heat
- Histogram
- Distance
- Measure
- Release unit tests
chromosome: a "backbone". Could be a psuedomolecule, linkage group, contig,
et cetera.
centromere: a glyph type that is drawn on the chromosome, with optional overhang on
either side of the chromosome bar.
position: a glyph representing a point without size which is typically used for
features that are too small to display at scaled size, for example, a
gene.
marker: a particular type of position depicted with a horizontal line.
range a glyph representing a feature with sufficient length to display at scale,
for example, centromeres or pericentromeric regions.
measure [Not Yet Implemented] a glyph representing a feature with some value, for
example, an e-value or expression value. The actual glyph can be a
position or range.
Input data to CViT is in GFF3 (http://www.sequenceontology.org/gff3.shtml). CViT interpretes files as follows:
column 1 (seqid)      chromosome name. If column 3 is 'chromosome' the
                      record describes the chromosome (name, length, et
                      cetera), otherwise the record describes a feature on
                      the named chromosome.
column 2 (source)     user defined. Can be used in conjunction with column 3
                      by the options (.ini) file to indicate a special
                      glyph.
column 3 (type)       one of: 'chromosome', 'position', 'range', 'border',
                      'measure', 'centromere', 'marker' or user defined.
                      Can be used in conjunction with column 3.
                      by the options (.ini) file to indicate a special
                      glyph.
column 4 (start)      start coordinate of chromosome if column 3 =
                      'chromosome', start coordinate of feature otherwise.
column 5 (end)        end coordinate of chromosome if column 3 =
                     'chromosome', end coordinate of featuer otherwise.
column 6 (score)      if record is of type 'measure' and 'value_type'
                      parameter in options (.ini) file is set to
                      'score_col', then this value will be used to generate
                      a heatmap color or histogram.
column 8 (strand)     Unused unless 'show_strands' parameter in options
                      (.ini) file is set to 1.
column 8 (phase)      UNUSED
column 9 (attributes) User-defined attributes allowed and ignored by CViT.
These attributes are defined:
ID/Name = name of chromosome or feature
color = color for feature; overrides all other color
settings in options (.ini) file
value = used for type=measure glyphs if 'value_type'
parameter in options is set to 'value_attr'
Important: The GFF data must contain at least one chromosome. Features must contain the name of the chromosome it belongs to in the seqid (1) column of the GFF file and that name must match the name in the seqid column for the chromosome. Also, its coordinates must lie within the start and end coordinates of the chromosome.
Almost all aspects of the output images can be controlled via the .conf file. An example can be found inside data/test1. Note that the drawing configuration file is different from the main configuration file, cvit.conf. Important note: as CViTjs is still in beta, some of these options may not yet be implemented. If an option you need appears to have not been implemented, let us know and we will make it a priority to implement it.
General or overall options
title Label for image.
title_height Space allowance for title in pixels, ignored if font face
and size are set.
title_font Use a built-in GD font (0=gdLargeFont, 1=gdMediumBoldFont,
2=gdSmallFont, 3=gdTinyFont). If title_font_face is set,
this setting is overridden.
title_font_face Font face to use for title.
title_font_size Title font size in points.
title_color Title font color.
title_location Title location as x,y coords, ignored if missing.
image_padding Space around chromosome set, in pixels.
scale_factor How much to scale units (pixels per unit); used to size
image.
border_color Color of the border around the image.
tiny_font_face The prefered tiny font when small labels are needed.
chrom_width How wide in pixels to draw a chromosome
fixed_chrom_spacing Whether or not to draw chromosomes in fixed locations, or
spaced to accomodate features and labels.
chrom_spacing How far apart to space the chromosomes.
chrom_padding_left Extra chromosome padding on the left.
hrom_padding_right Extra chromosome padding on the right.
chrom_color Fill color for the chromosome bar.
chrom_border Whether or not to draw a border for the chromosome bar.
chrom_border_color Border color for the chromosome bar.
chrom_font Use a built-in GD font (0=gdLargeFont, 1=gdMediumBoldFont,
2=gdSmallFont, 3=gdTinyFont). If chrom_font_face is set,
this setting is overridden.
chrom_font_face Font face to use to label chromosomes, ignored if empty.
chrom_font_size Font size for chromosome labels in points, used only in
conjuction with font_face.
chrom_label_color Color for chromosome label.
show_strands 1=show both chromosome strands, 0=don't; both strands
will fit inside chrom_width
display_ruler 0=none, 1=both, L=left side only, R=right side only.
reverse_ruler 1=ruler units run greatest to smallest, 0=normal order.
ruler_units Ruler units (e.g. "cM, "kb"), used to label the ruler.
ruler_min Minimum value on ruler, if > actual minimum value in the
data this will be adjusted accordingly in the code.
ruler_max Maximum value on ruler, if < actual maximum value in the
data, this will be adjusted accordingly in the code.
ruler_font Which built-in font to use (ruler_font_face overrides this
setting).
ruler_font_face Font face to use for ruler, ignored if empty.
ruler_font_size Ruler font size in points, used only in conjuction with
font_face.
tick_line_width Width of ruler tick marks in pixels.
tick_interval Ruler tick mark units in original chromosome units.
minor_tick_divisions Number of minor divisions per major tick (1 for none).
Glyph options (not all apply to all glyphs)
centromere_overhang How much centromere bar should extend beyond chromosome bar;
only applies to centromere glyphs.
color Glyph color. Can be overridend by class= attribute or
color= attribute.
border_color Color for drawing borders; only applies to borders.
transparent Whether or not to draw glyph transparently.
shape Glyph shape (circle, rect, or doublecircle).
width Width of the shape.
offset Offset glyph this many pixels from chromosome bar (negative
value moves label to the left).
enable_pileup If set to 1, CViT will offset features that overlap a
previously-drawn feature by shifting them right (or
left if on the left side of the chromosome).
pileup_gap The space between adjacent, piled-up positions.
fill 1=fill in area between borders, 0=don't; only applies to
borders and measures.
value_type If set to 'score_col', the measure value is taken from the
score column (6) in the GFF file AND IS ASSUMED TO BE AN
E-VALUE. If the value in the score column is not an
e-value, it will be displayed incorrectly. If set to
'value_attr', the measure value is in the value=
attribute in the attribute (9) column. Only applies to
measures.
display If 'heat' display measure as a heat color. If 'histogram'
display measure as a histogram. If 'distance', the
distance the glyph is draw from the chromosome (right
or left side as indicated by offset) is determined by
the feature's value. Only applies to measures.
draw_as Whether to interpret a heat map or distance measure as a
range, position, border, or marker.
heat_colors Colors to use for scale (heat map only): redgreen or
grayscale.
min Minimum value for a set of measure glyphs. If > actual
minimum value in the data this will be adjusted
accordingly in the code. Only applies to measures.
max Maximum value for a set of measure glyphs. If < actual
maximum value in the data this will be adjusted
accordingly in the code. Only applies to measures.
max_distance Maximim distance to draw a distance measure.
hist_perc Percentage of distance between chromosomes to fill with
maximum value for a set of histogram measure glyphs.
draw_label Whether or not to draw label (ID= or Name= attribute)
font Use a built-in GD font (0=gdLargeFont, 1=gdMediumBoldFont,
2=gdSmallFont, 3=gdTinyFont). If font_face is set,
this setting is overridden.
font_face Font face to use for label.
font_size Font size in points, used only in conjuction with font_face.
label_offset Start labels this many pixels right of region bar (negative
value moves label to the left).
label_color Color to use for label.
Characteristics for a custom sequence type can be defined by naming a section by the source and type columns of the GFF. For example, the GFF record
ZmChr1 IBM2_2008_Neighbors locus 882.70 882.70 . . . Name=tb1
would be identified by IBM2_2008_Neighbors:locus.
Example:
[genes]
feature = IBM2_2008_Neighbors:locus
glyph = position
color = green
offset = -5
CViTjs exports views as png or svg files.
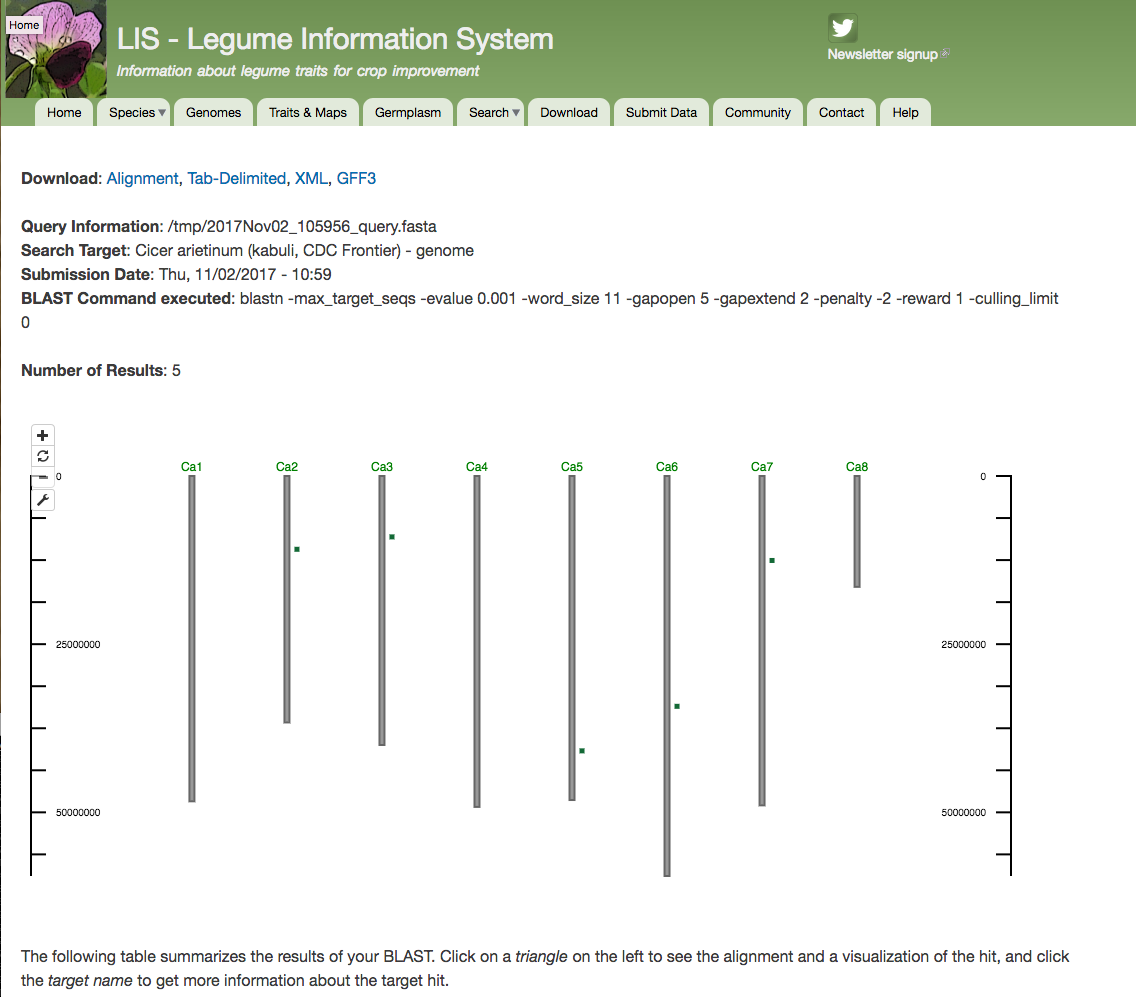
Embedded tool to display BLAST results. Image is a blastn result agains Cicer arietinum (kabuli, CDC Frontier) - genome using the following sequence:
>cicar.Ca_13726

ATGTTTTCTCTCATCATTCTCTCACCAAACTATGCTTCCTCAACTTGGTGTTTGGATGAGCTACAAAAGATTGTTGAGTGTGGAAAGTGTTTTGGTGGTCAAGGTGTTTTTCCAATCTTCTATGGTGTAGATCCTTCTCATGTTAGGCATCAAAGTGGAAGCTTTGCTAAAGCATTTAGAAAACATGAAGAAAACTTTAGAGAAGATAGAGAGAAAGTGCAAAGGTGGAAAGATGCATTAAGAGAAGTTGCTGGTTATTCTGGTTGGGACTCCAAGGATTGGCATGAGGCAAAATTGATAGAAACAATTGTTGAAAACATTCAGAAAAAATTGATTCCTAAATTGAATGTTTGCACAGATAACTTTATTGGAATGGATTCAAAGATAAAAGAAGTAACTTCACTCCTAGGAATGAATTTAAACGATGTTCGCTTCGTAGGCATATGGGGCATGGGTGGAATAGGAAAGACAACTATTGCTCGATTAGTCTACGAAGCGATCAAAGATGAATTCAATATAAGTTGCTTTCTTGCAGACATTAGAGAATCAGTTTCCAAGACAAATGGCTTAGTTAATATCCAAATGGAACTTCTTTCTCATCTTAACATAAGAAGCAATGATTTTTACAATGTTCATGATGGAAAAAAGATATTAGCAAACTCCTTAAGCAACAAAAAGATTCTTCTTGTTCTTGATGATGTGAATGAGTTAAGCCAATTGGAGAGTTTAGCTTGGAAGCAAGAATGGTTTGGTAAAGGAAGTAGAGTTATAATCACAACTAGGGATAAGCACTTATTAATGACACATGGAGTGCATGAAACTTATAAGGCAAAAGGGTTAGTAAAAAATGAAGCACTTAAGCTCTTTTGTTTGAAAGCATTTAAACAAGACCAACCTAAAGAAGAGTATTTGAGTTTGTGTCAAGAAGCGGTTGAATACACAAAAGGACTTCCTTTGGCACTTGAGGTATTAGGTTCACATCTTCATGGAAGAAGTGTTGAGGTTTGGCATAGTGCTTTAGAACAAATAACAAGTGTTCCTCACTCCAAAGTTCAAGATACATTGAAAATAAGCTATGACAGTTTACAATCTATGGAGAAAAATTTGTTTCTAGATATTGCATGTTTCTTCAAAGGAATGGACTTAGATGAAGTAATAGATATGTTAGAAAATTGTGGTGATTATCCTAAAATTGGAATTGACATTTTGGCTGAAAGATCTTTGGTAAGTTTTGATAGGGGAGGAAATAAGTTGTGGATGCATGATTTGCTTCAAGAAATGGGAAGGAATATTGTGTTTCAAGAATATCCAAATGATCCTGGAAAACGCAGTCGATTATGGTCTCAAAAAGACATTGATCAAGTATTGACAAAAAATAAGGGAACTGATAAAATTCAAGGCATAGTTCTGAACTTGGATCAACCGTATGAAGCAAAATGGAACATTGAAGCCTTCTCCAAAATAAGTCACCTAAGGTTACTCAAATTATGTGGCATAAAACTCCCCCTTGGCCTCAACTGCTTCCCTAGTTCACTAAAAGTACTTGACTGGAGAGGATTTCCTTTGAAAACCCTTCCATTCACTAATAATTTGGATGAAATTGTTGACCTCAAATTGCCTCACAGTAAAATAGAACAACTTTGGCATGCAACACAGTTTCTTGAAAATCTGAAATCCATCAACTTGAGCTTTTCCAAGTCTCTAAAGCAATTGCCTGATTTCGTTGGTGTTCCGAATCTTGAATCATTGGTTTTTGAAGGCTGTACAAGCTTAACTGAGATTCATCCCTCCCTTTTAAGCCACAAGAAACTTGTTCAATTGAATTTGAAACACTGCAAAAGGCTCAAAACACTTCCATGCAAAATAGAAACAACTTCATTGAAGAATTTAAGTCTTGCTGGTTGCTCTGAATTCAAACATCTTCCTGAGTTTGATAAAAGCATGAAACATCTATCAAATCTTTCTTTATCAGATACTGCTATAACAAAACTACCATCTTCACTTGGATATCTTGTTTTCCTTAGACTTTTGGATTTAGAAAATTGCAAGAATCTTATTAGTCTTCCAGATACAATAAGTGAATTGAAGTCTCTCATAACTCTGAATGTTTCTGGCTGCTCAAAACTCCATAGCATTCCAGAAGGTTTAAAAGAAATCAACTGTTTGGAGGAACTTCTTGCAAGTGAAACTTCTATTGAAGAACTACCTTCATCTGTTTTTTATCTAGAAAACCTCAAAGTAATATCATTTTCTGGATGCAAAGGACCAGTGACTAAGACAGTGAATTCATTTTTGCTACCATTTACACATTTCTTAAGTAGTCCACAAGATCCTACTAGTTTTAGATTGCCGCATAAATTATCTCTACCTTCTTTGAAGTACTTAAATTTAAGTTACTGCAATCTATCTGAAGAATCAATCCCAAATGATTTTTTCAACTTTTCTTCTTTGATGGTTTTAAATCTCACTGGGAACAATTTTGTTAGTCCACCAAGTAGCATTTCAAAGCTACCAAAACTTGAGTATCTTAGCCTAAACTGGTGTGAAATGCTTCAGAATTTGCCAGAACTTCCCTCAAGTATGAGGACATTGGATGCATGTAATTGTGATTCACTGGAAACTTCTGAATTCAATCTTTCTAGATCATGCAATCTCATTGAATCGCCGATGAGGCAAAGACACTCGCATTTACCTGAAGTTCTGAAGAGCTATTTGGAGGCAGTGCAACTTGGTCTACCTAAAGAAAGATTTGACATGCTTATCACAGGGAGTGAAATTCCATTATGGTTTACACCTTCAAAATATGTTTCAGTTGCAAACATACCAGTCCCTCCTAATTGTCCAAATGATCAATGGGTAGGATTTGCTTTGTGTTTCTTGTTAGTAAGTTTTGCTGATCCACCTGAGTTATGTCATCATGAAGTAAGTTGTTACTTGTTTGGACCTAAGGGTAAGATGTTGATCAGCTCAAGGGATTTACCTCCTTTGGAACCATATTGCCGCCACCTTTATATTCTCTATTTGTCCATTGATGAATGCCGCAAAAGATTCGATAAAGGCGGTGACTGCAGTGAAATTGAGTTTGTCTTGAAAACTTATTGTTGTGATTCATTGAAAGTAGTGAGATGTGGTAGTCGTTTGGTATGTAAACAAGATGTTGAAGATATTTACAGAATTTGTAATTAG


