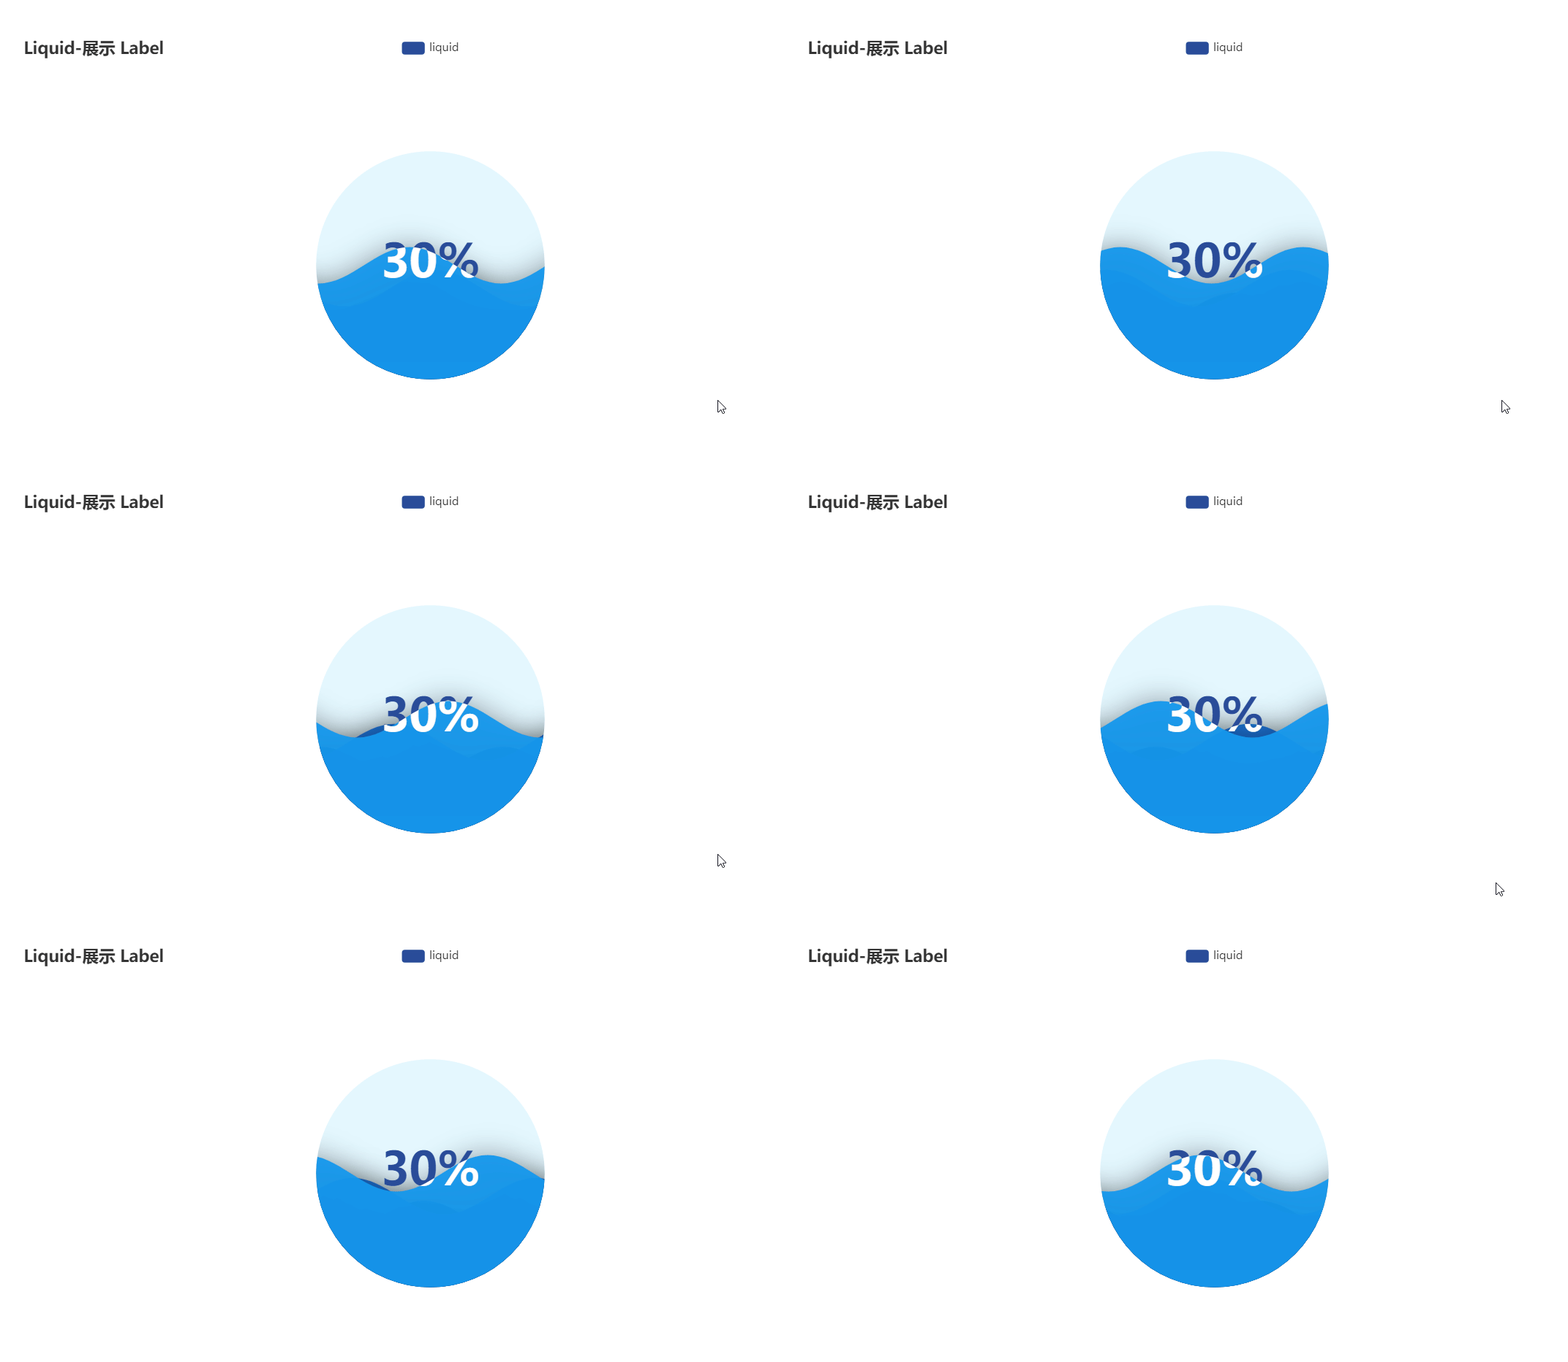
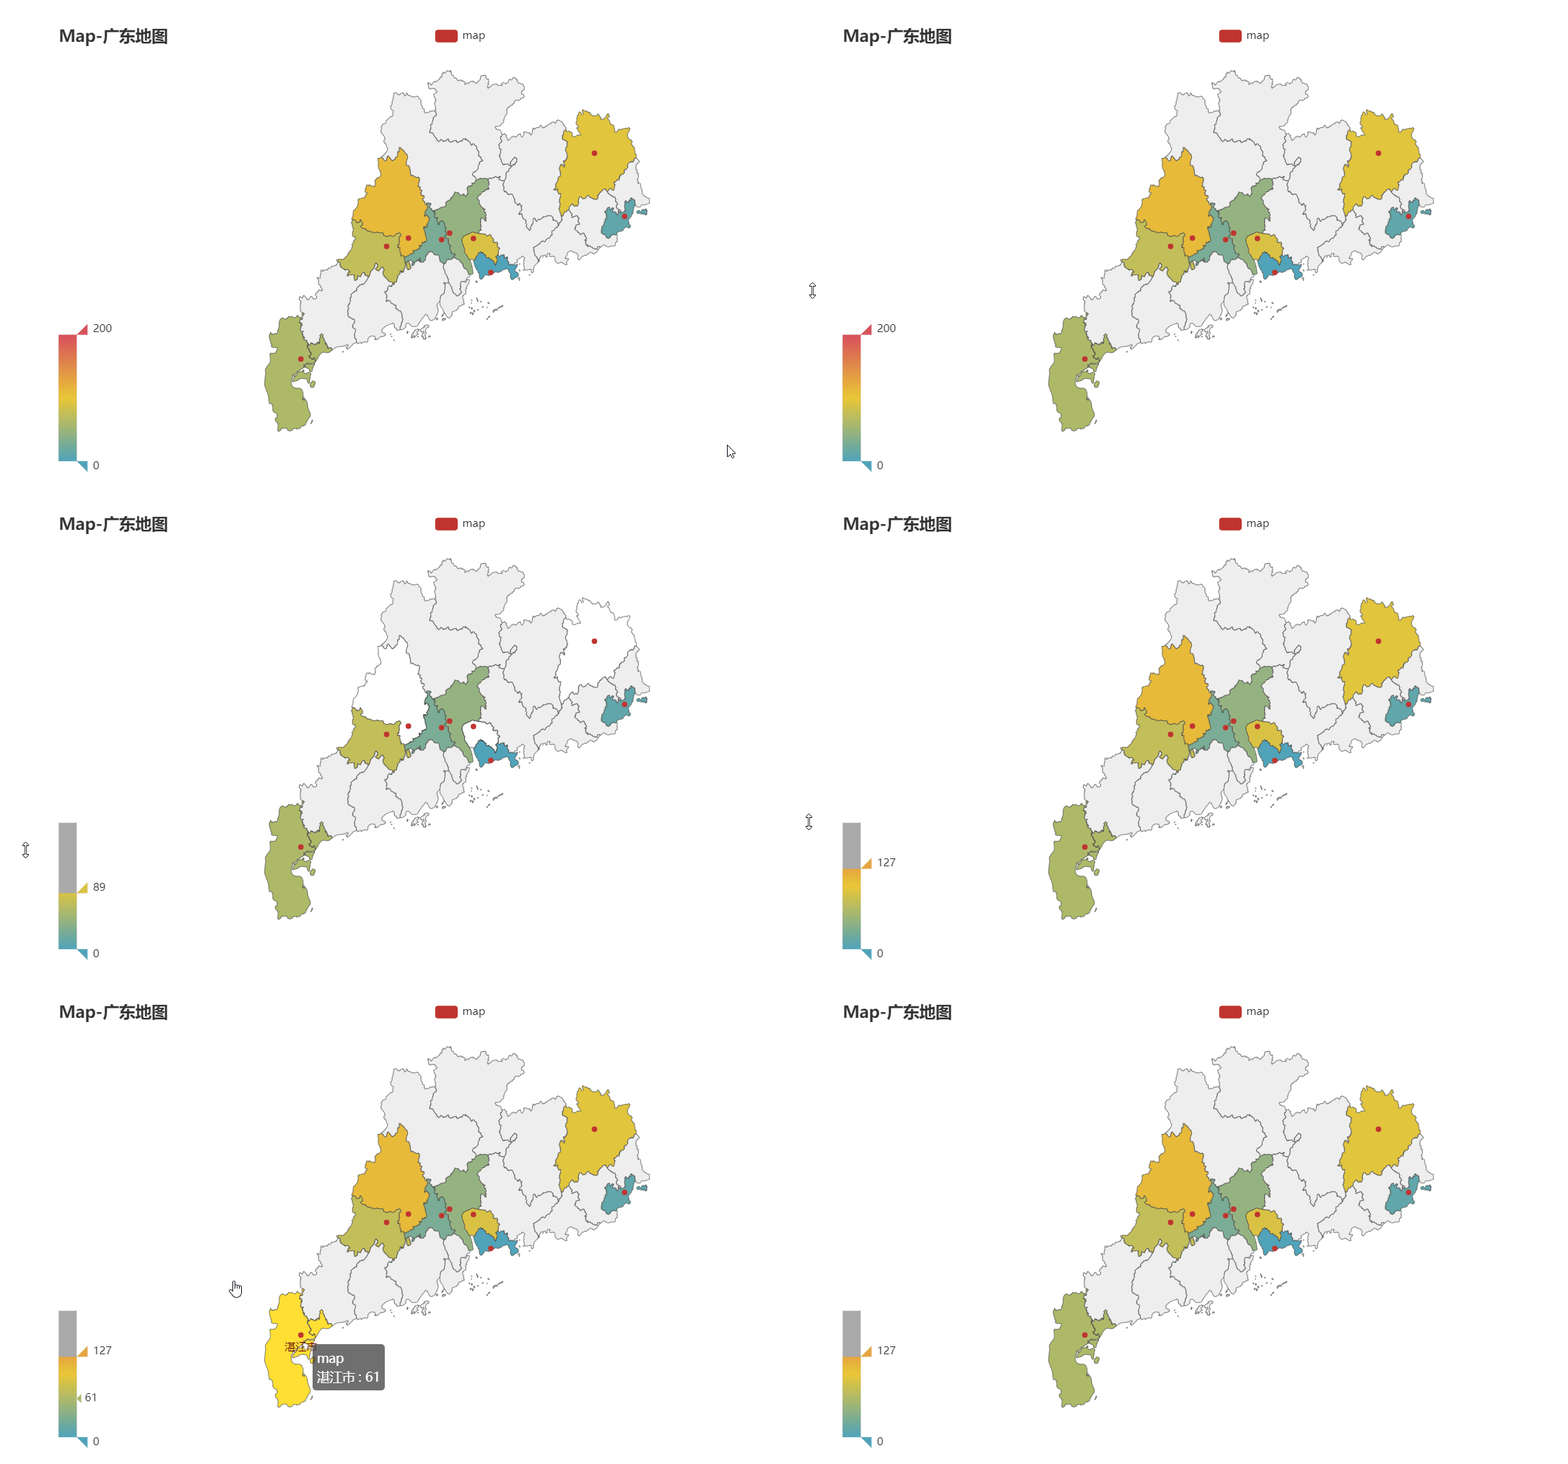
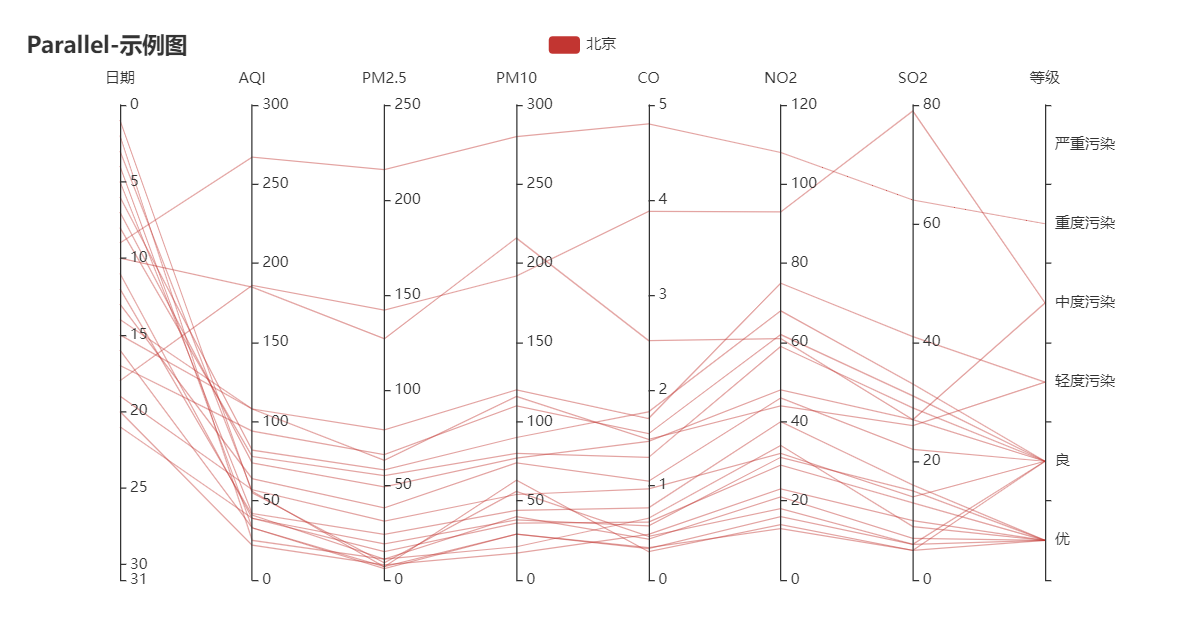
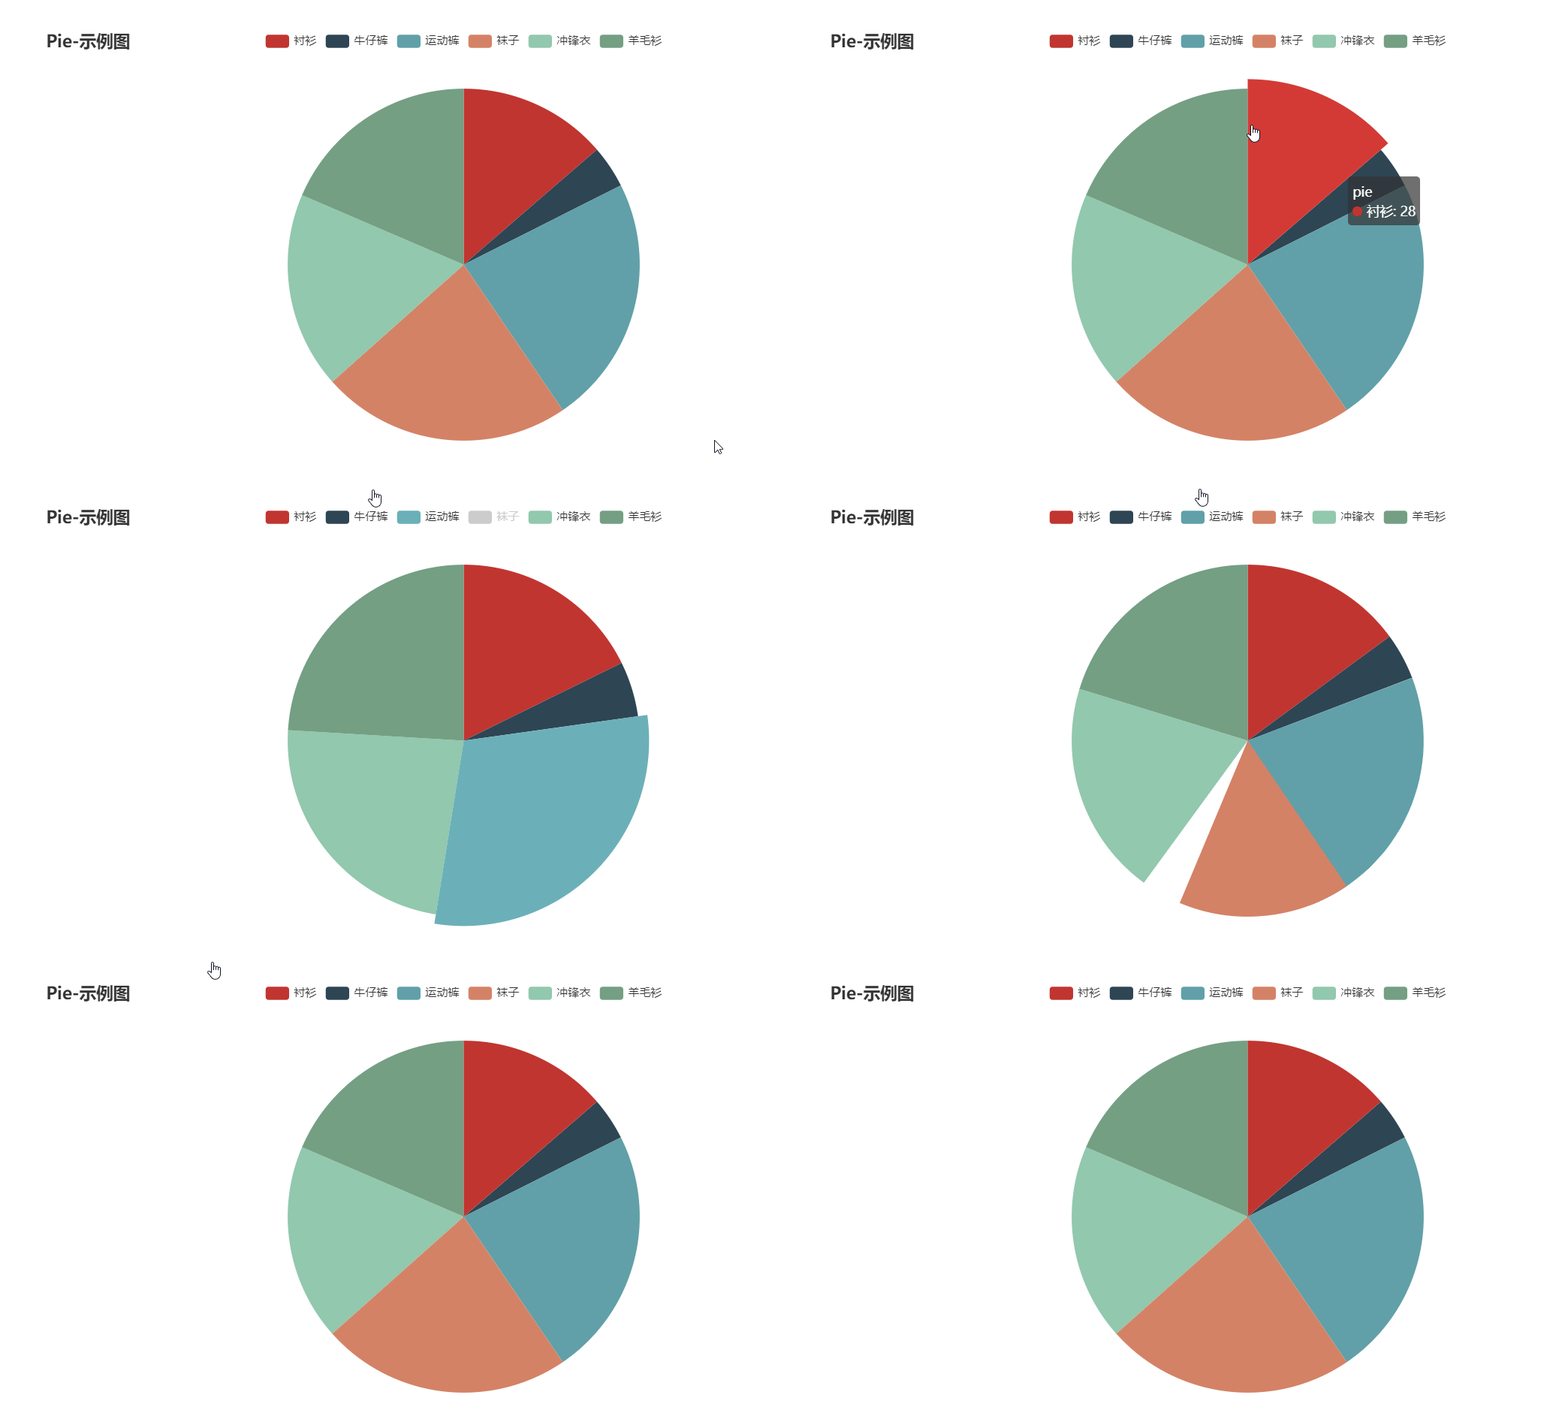
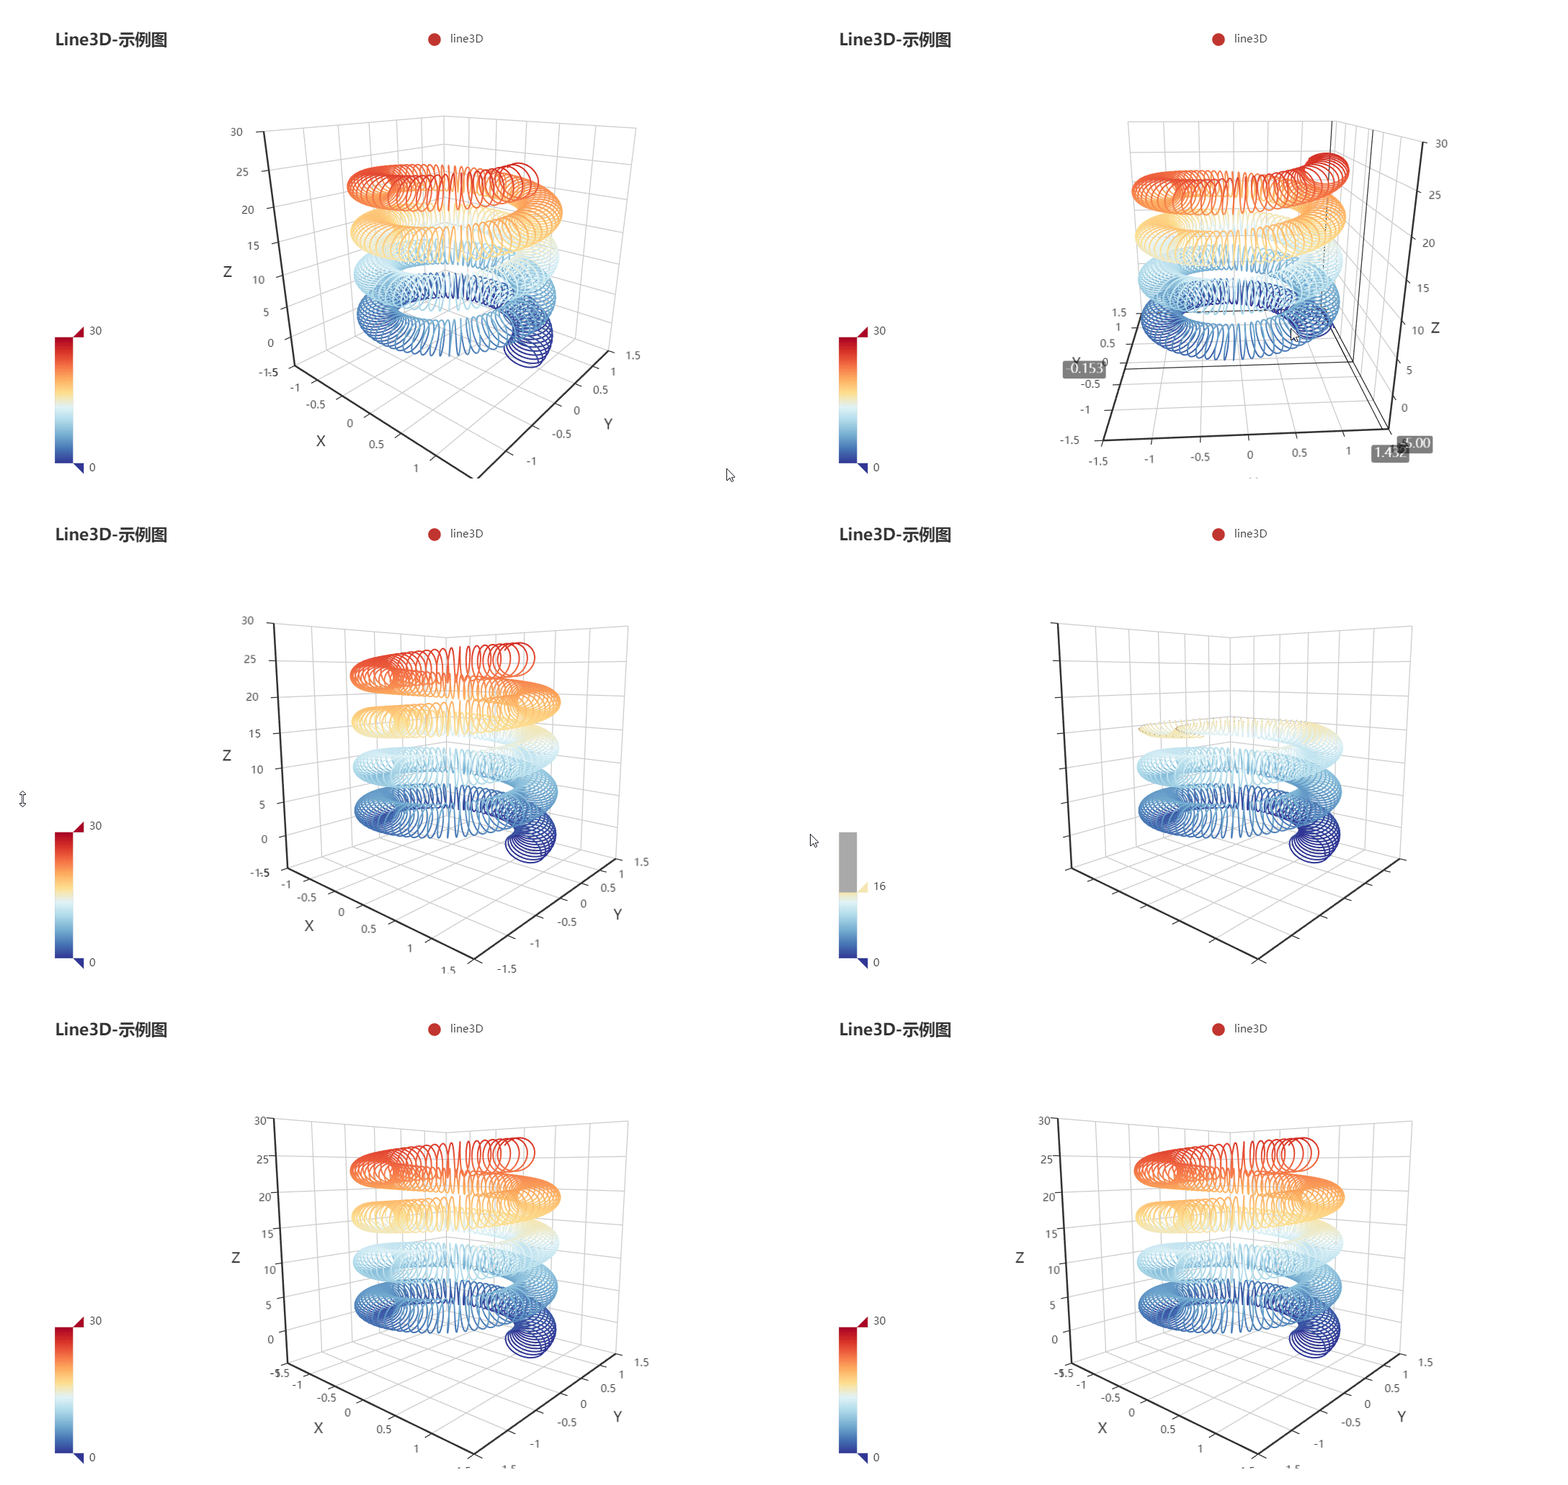
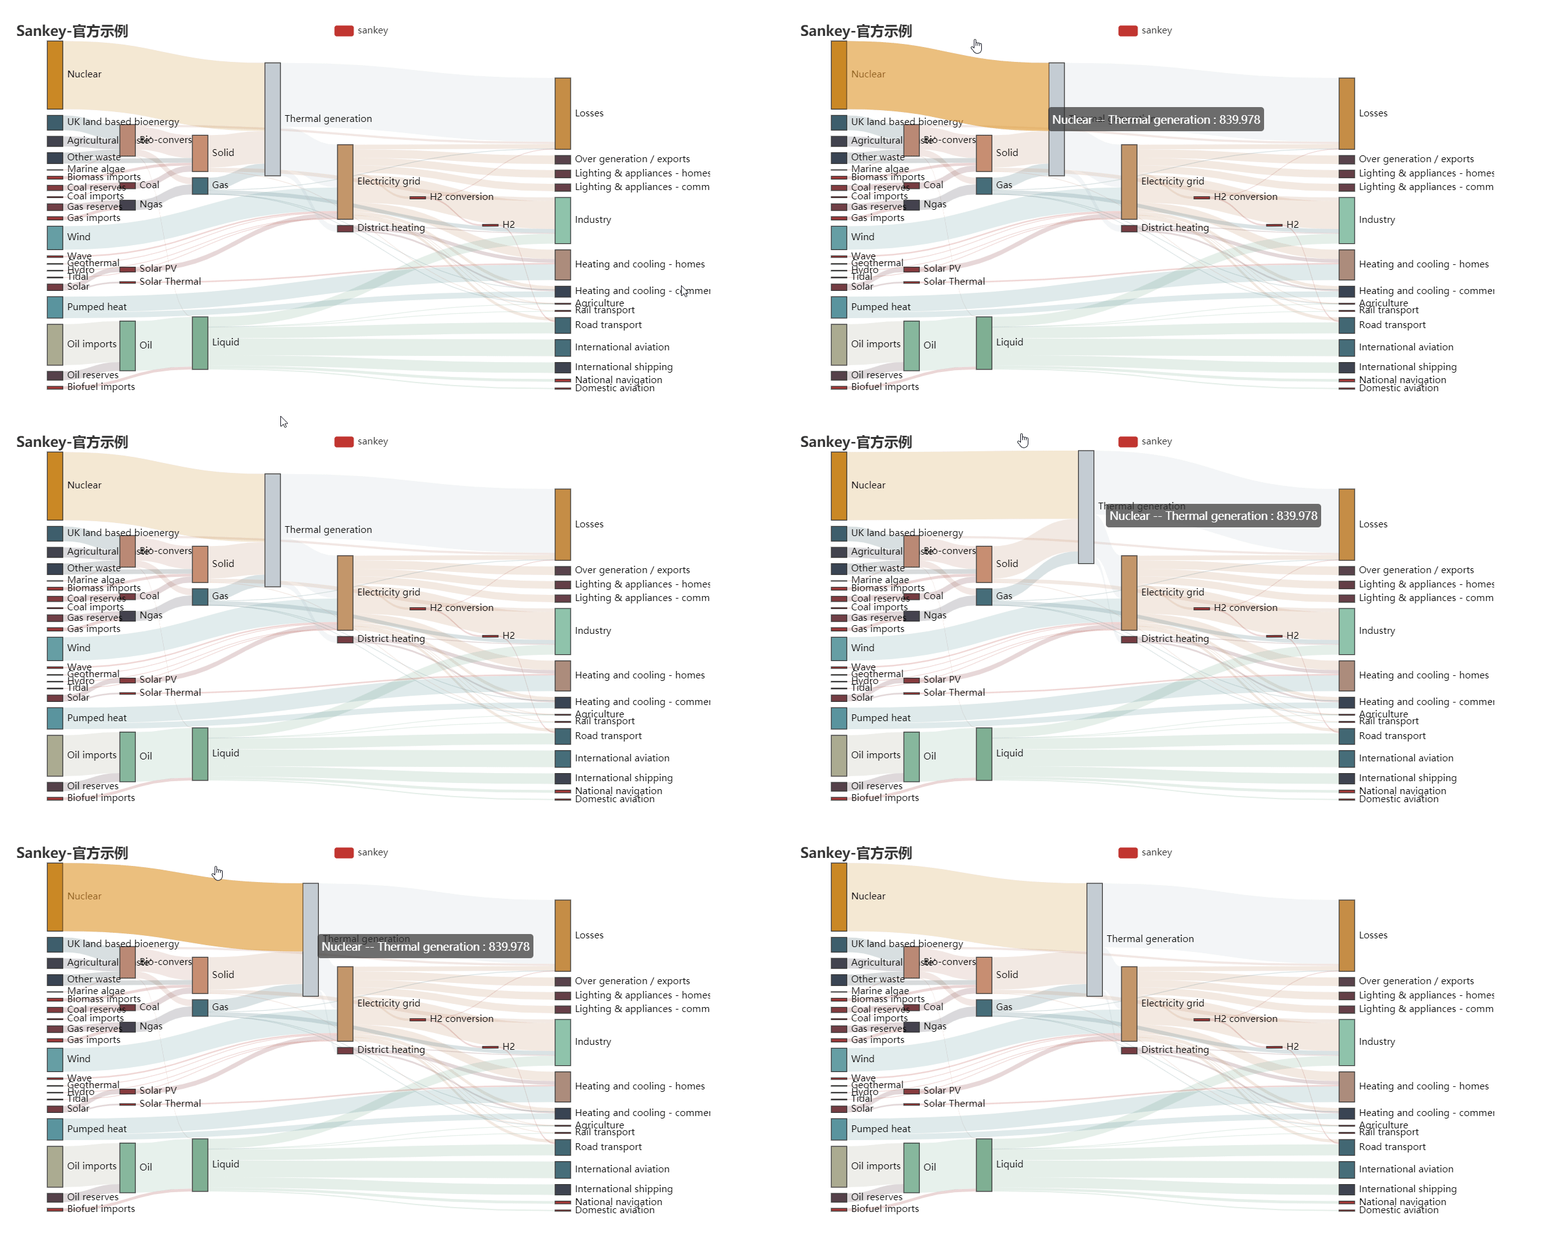
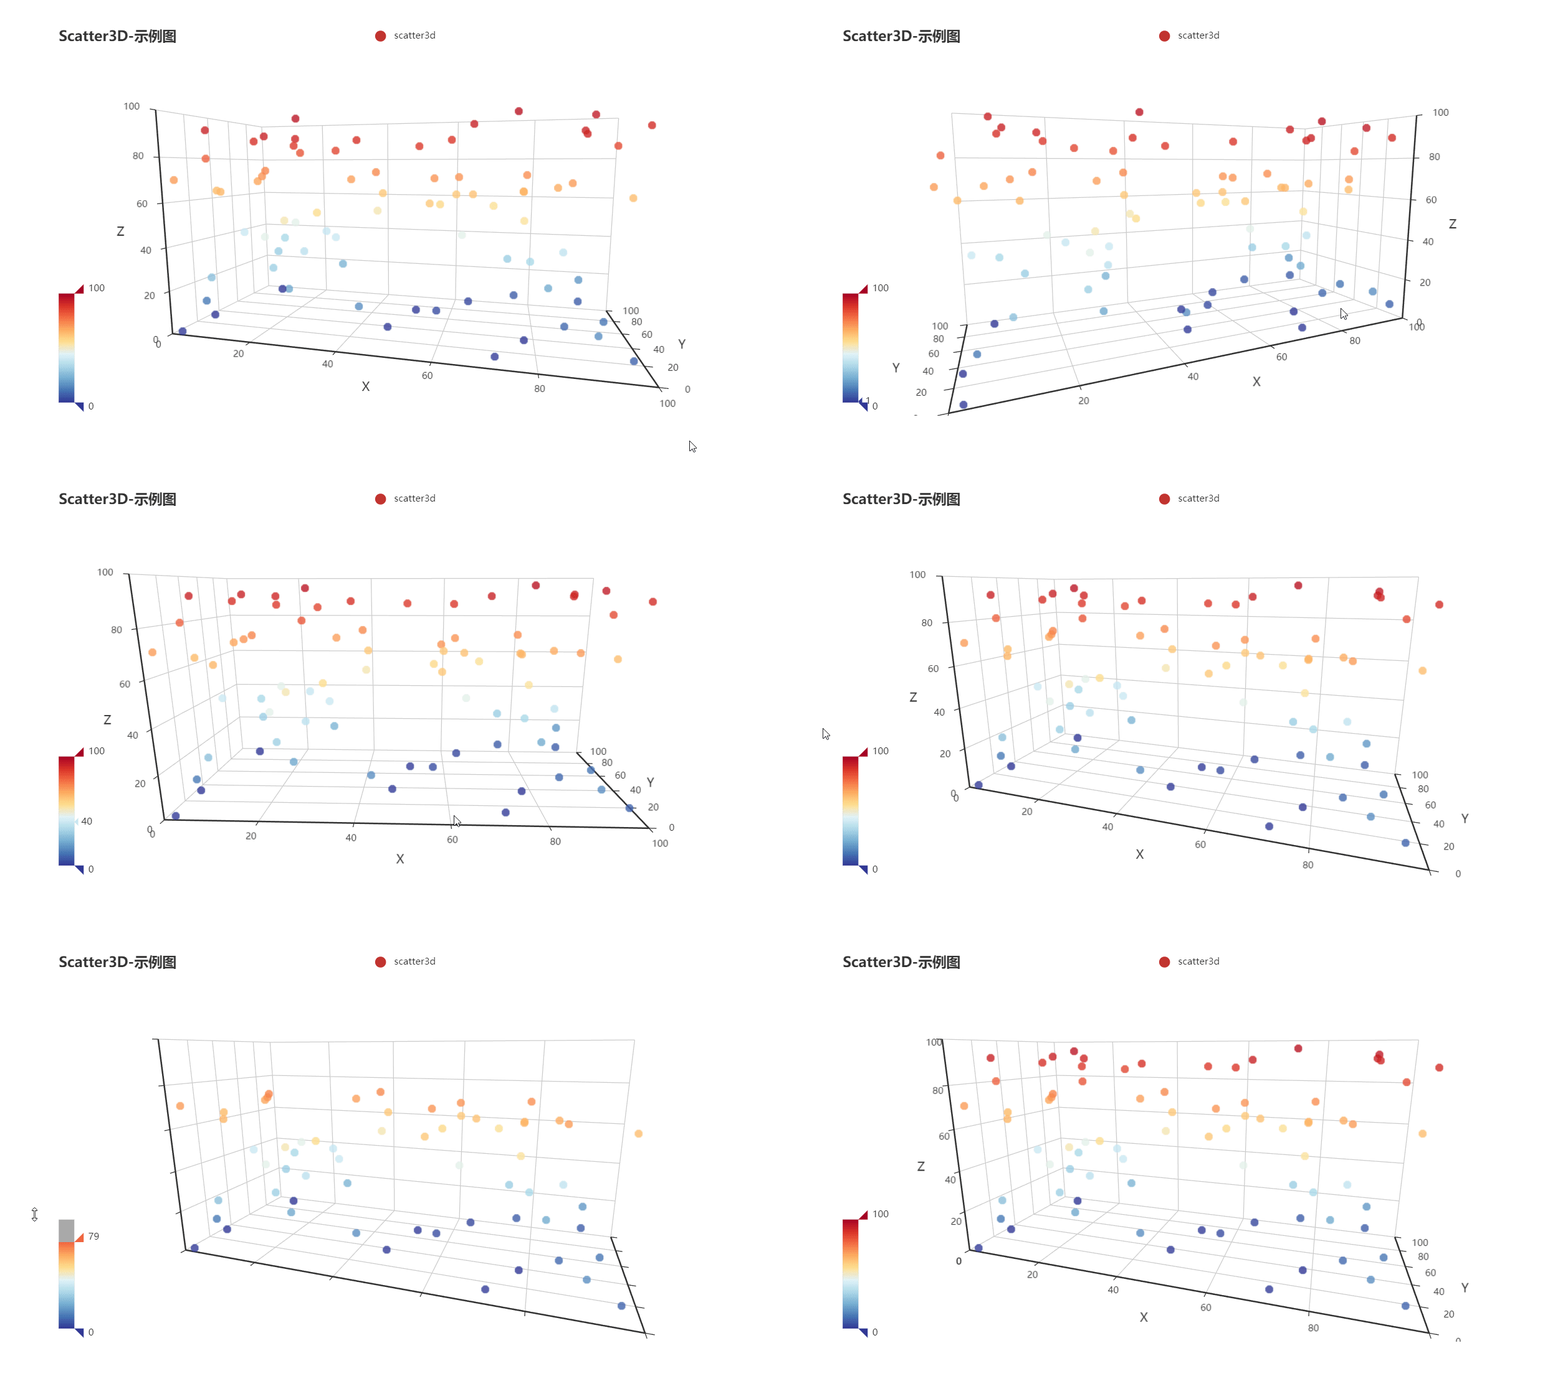
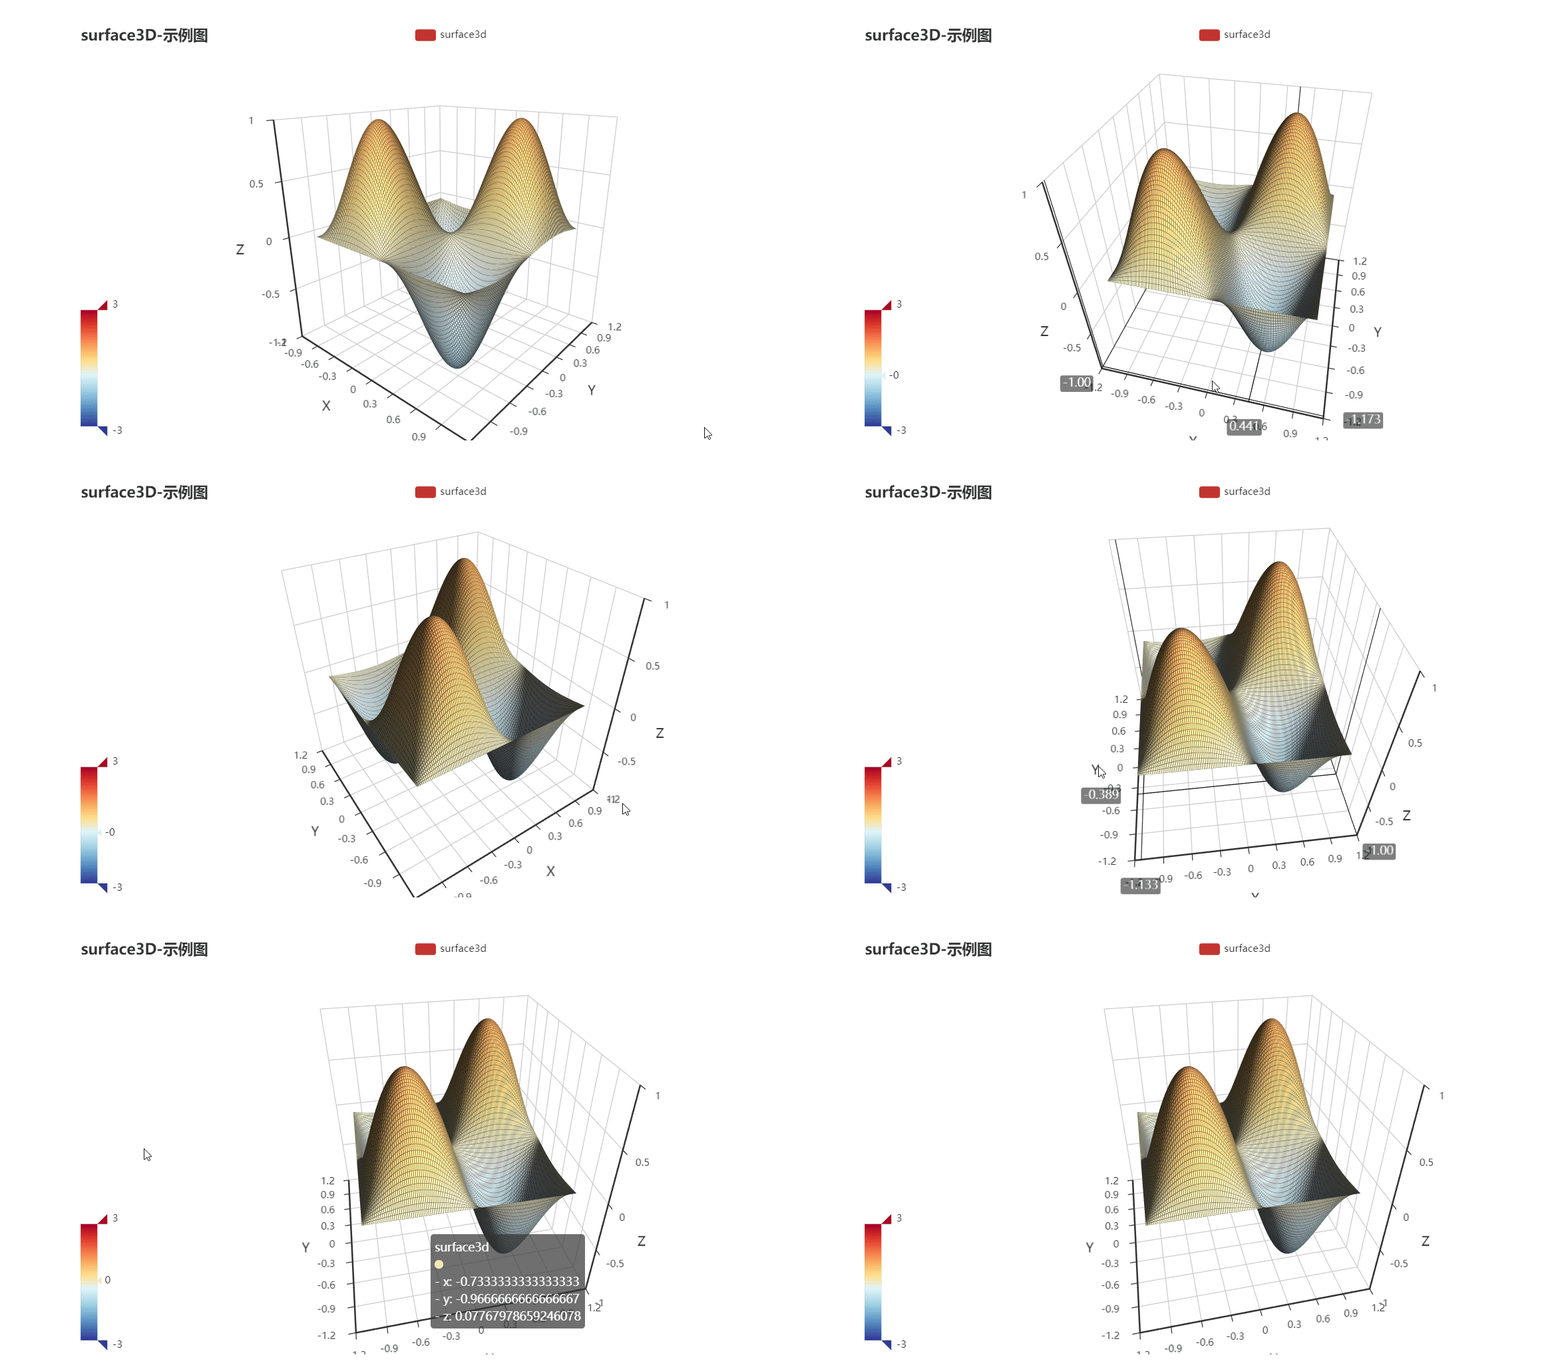
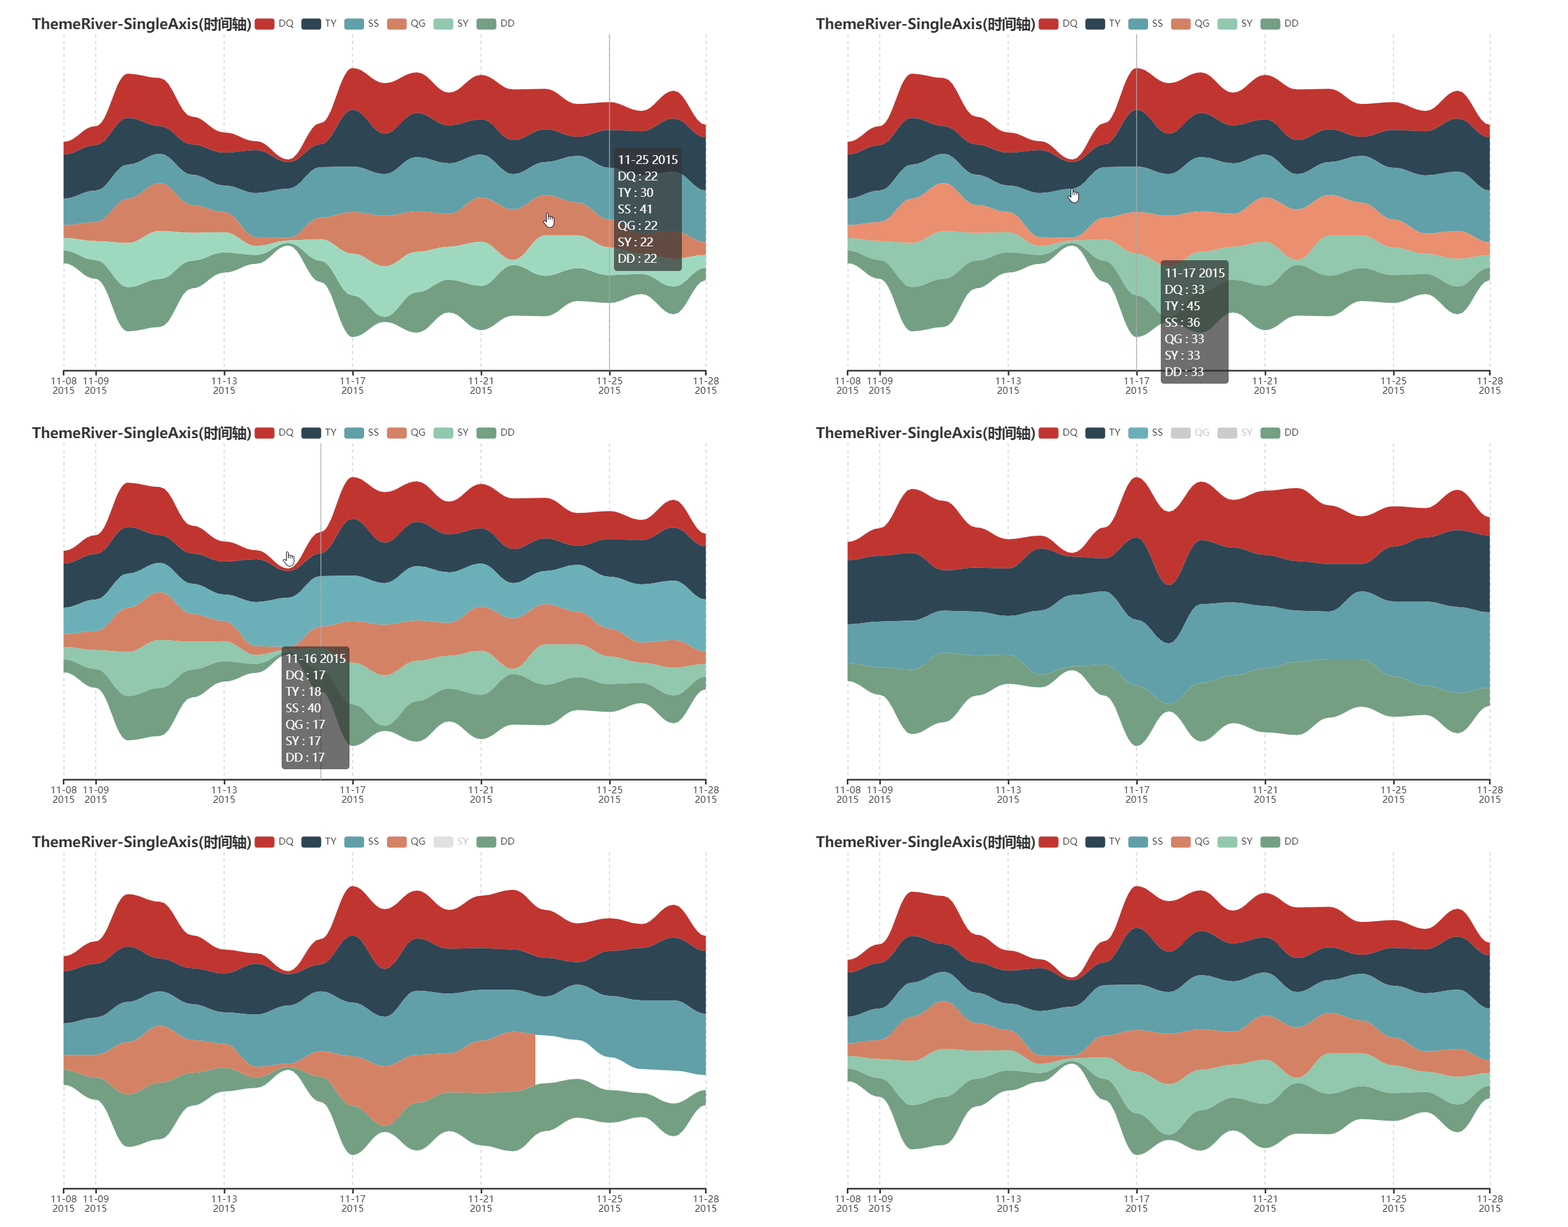
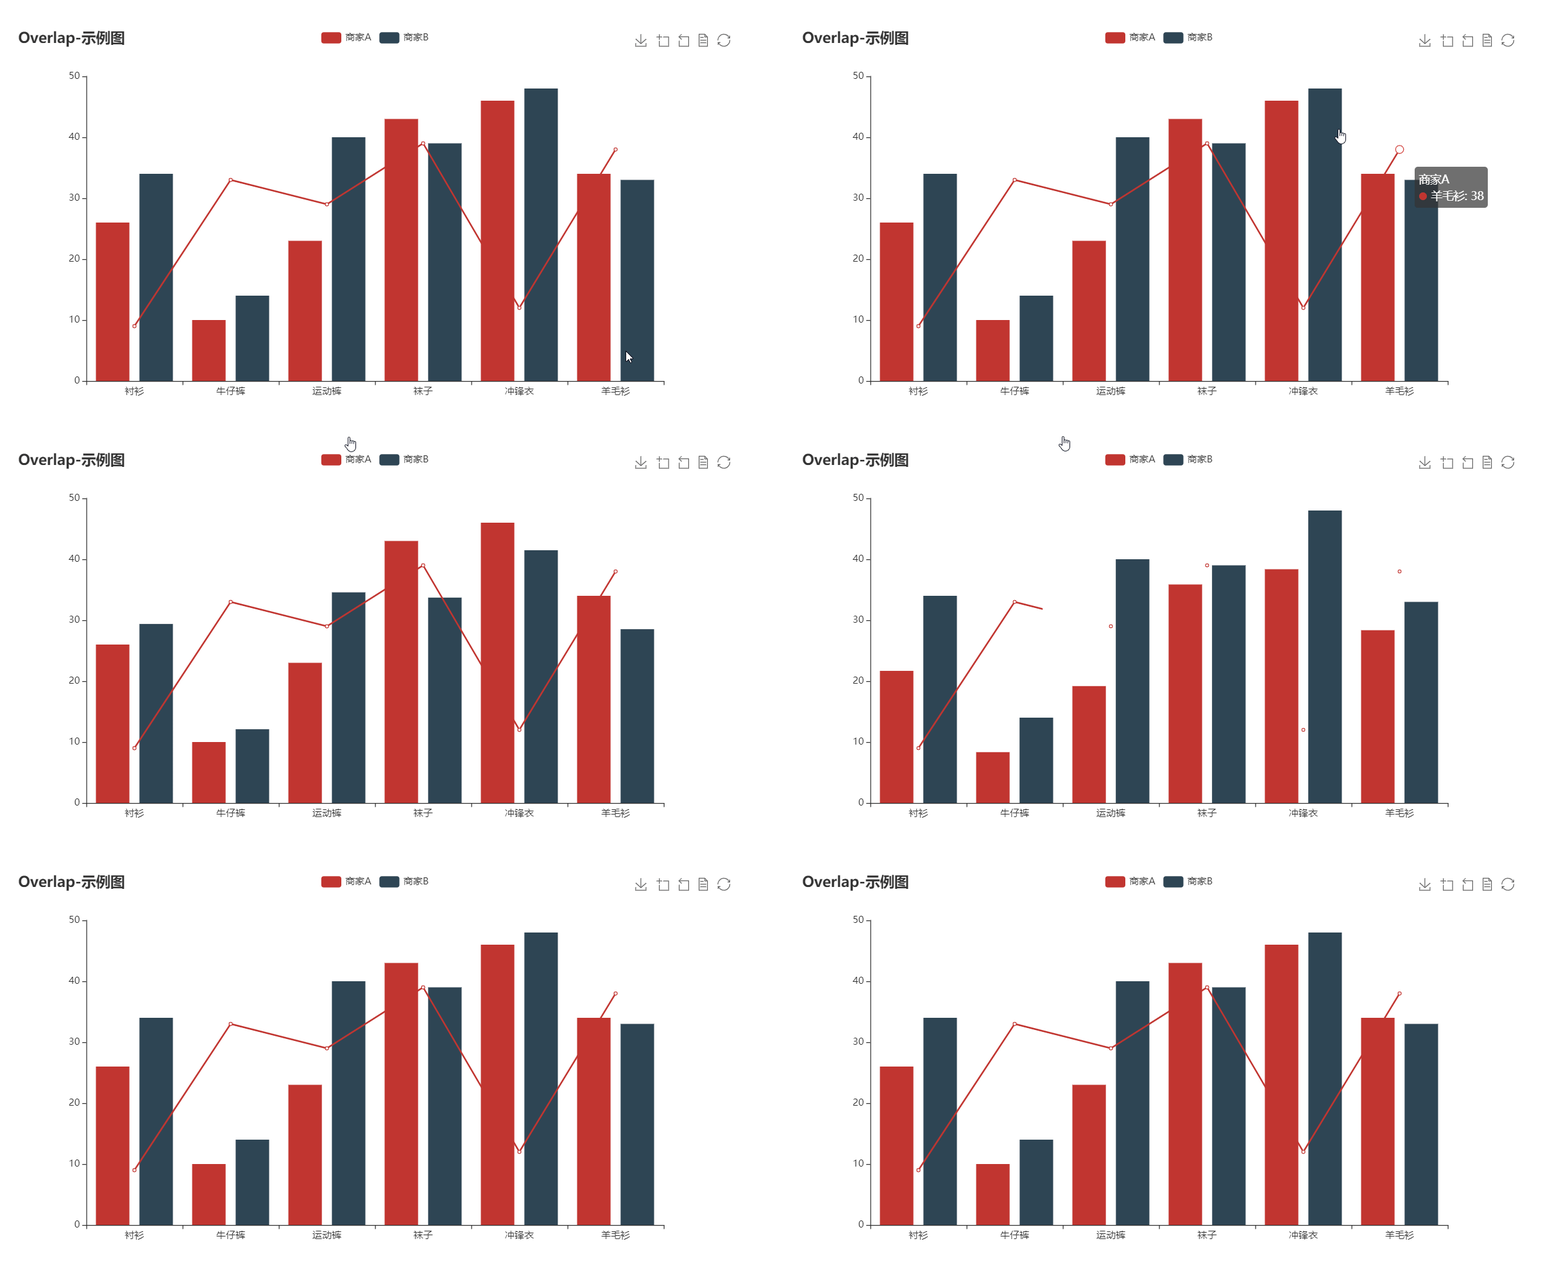
🎨 The adorable charts library for Golang.
If a language can be used to build web scrapers, it definitely needs to provide a graceful data visualizing library. --- by chenjiandongx
In the Golang ecosystem, there are not many choices for data visualizing libraries. The development of go-echarts aims to provide a simple yet powerful data visualizing library for Golang. Echarts is an outstanding charting and visualizing library opensourced by Baidu, it supports adorable chart types and various interactive features. There are many language bindings for Echarts, for example, pyecharts. go-echarts learns from pyecharts and has evolved a lot.
$ go get -u github.com/go-echarts/go-echarts/...- Clean and comprehensive API.
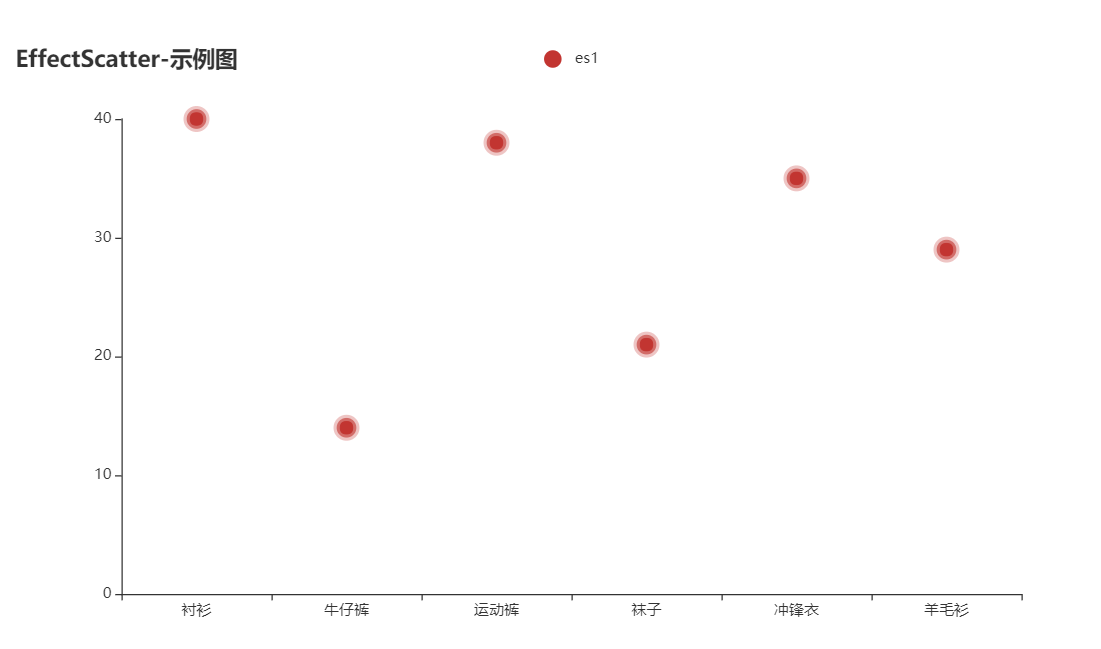
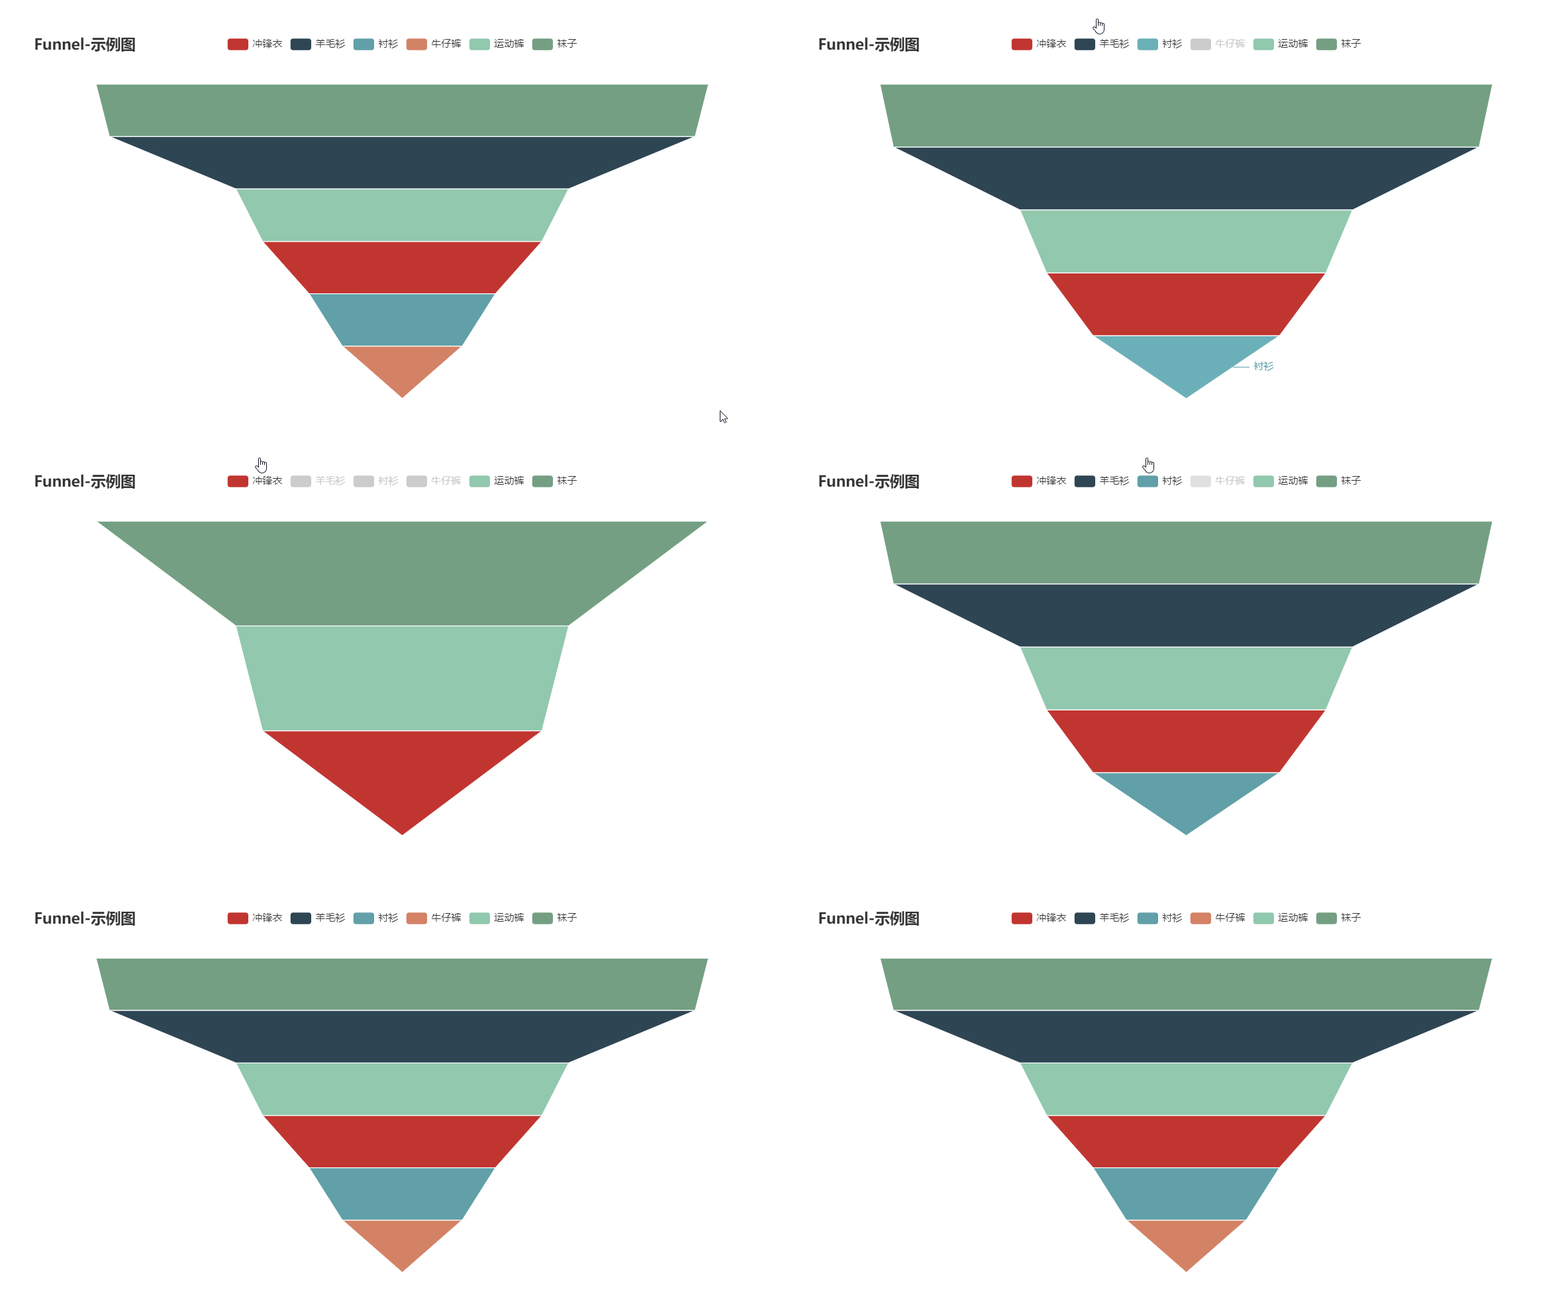
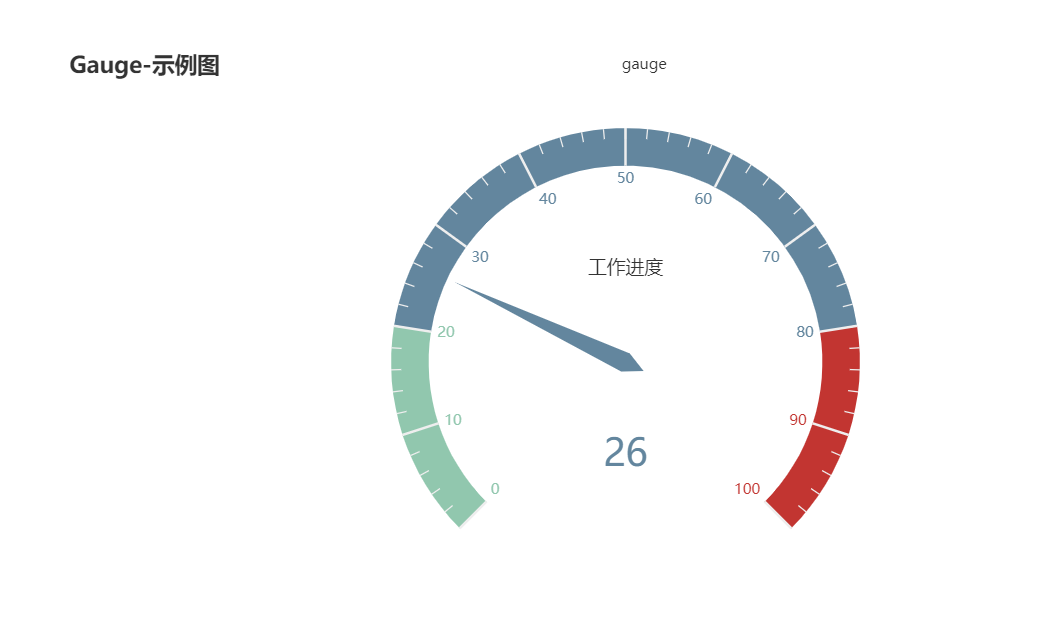
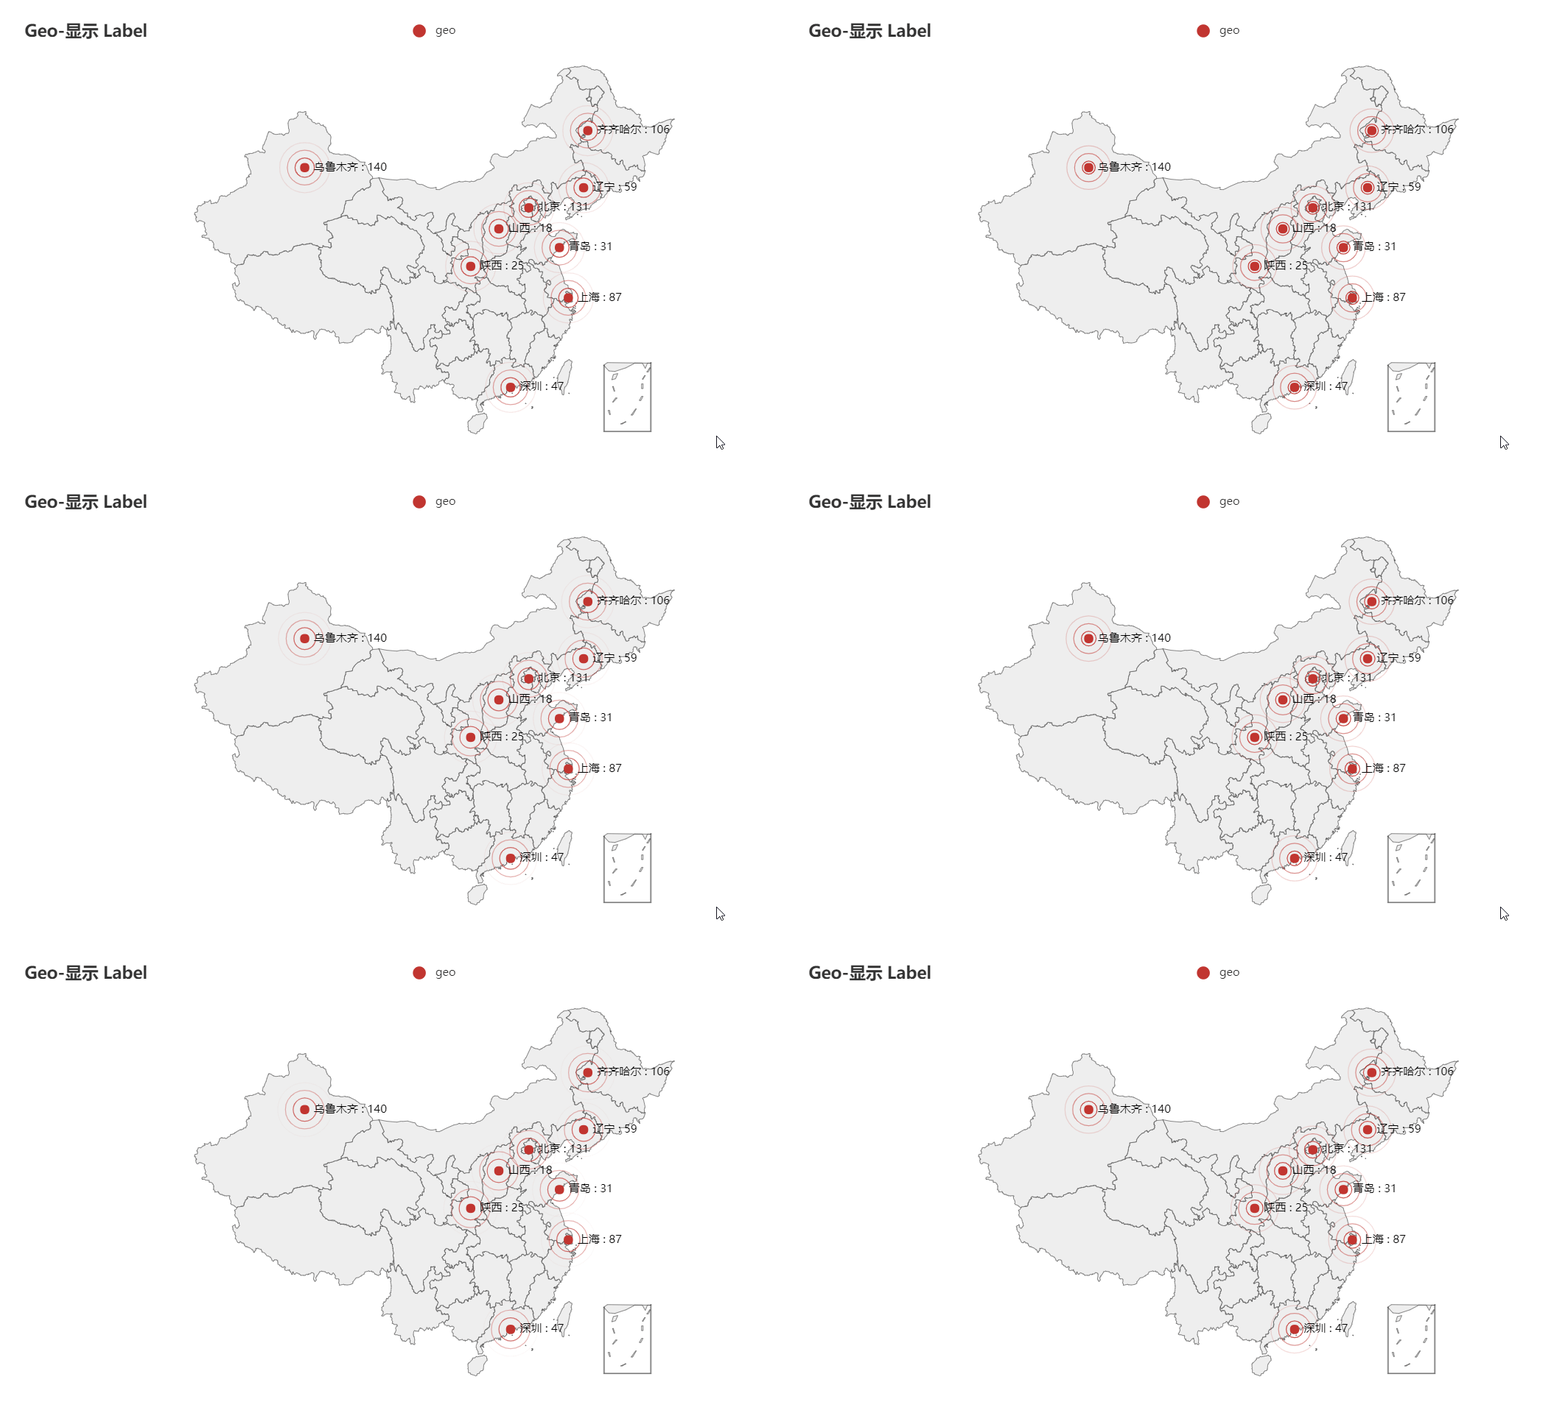
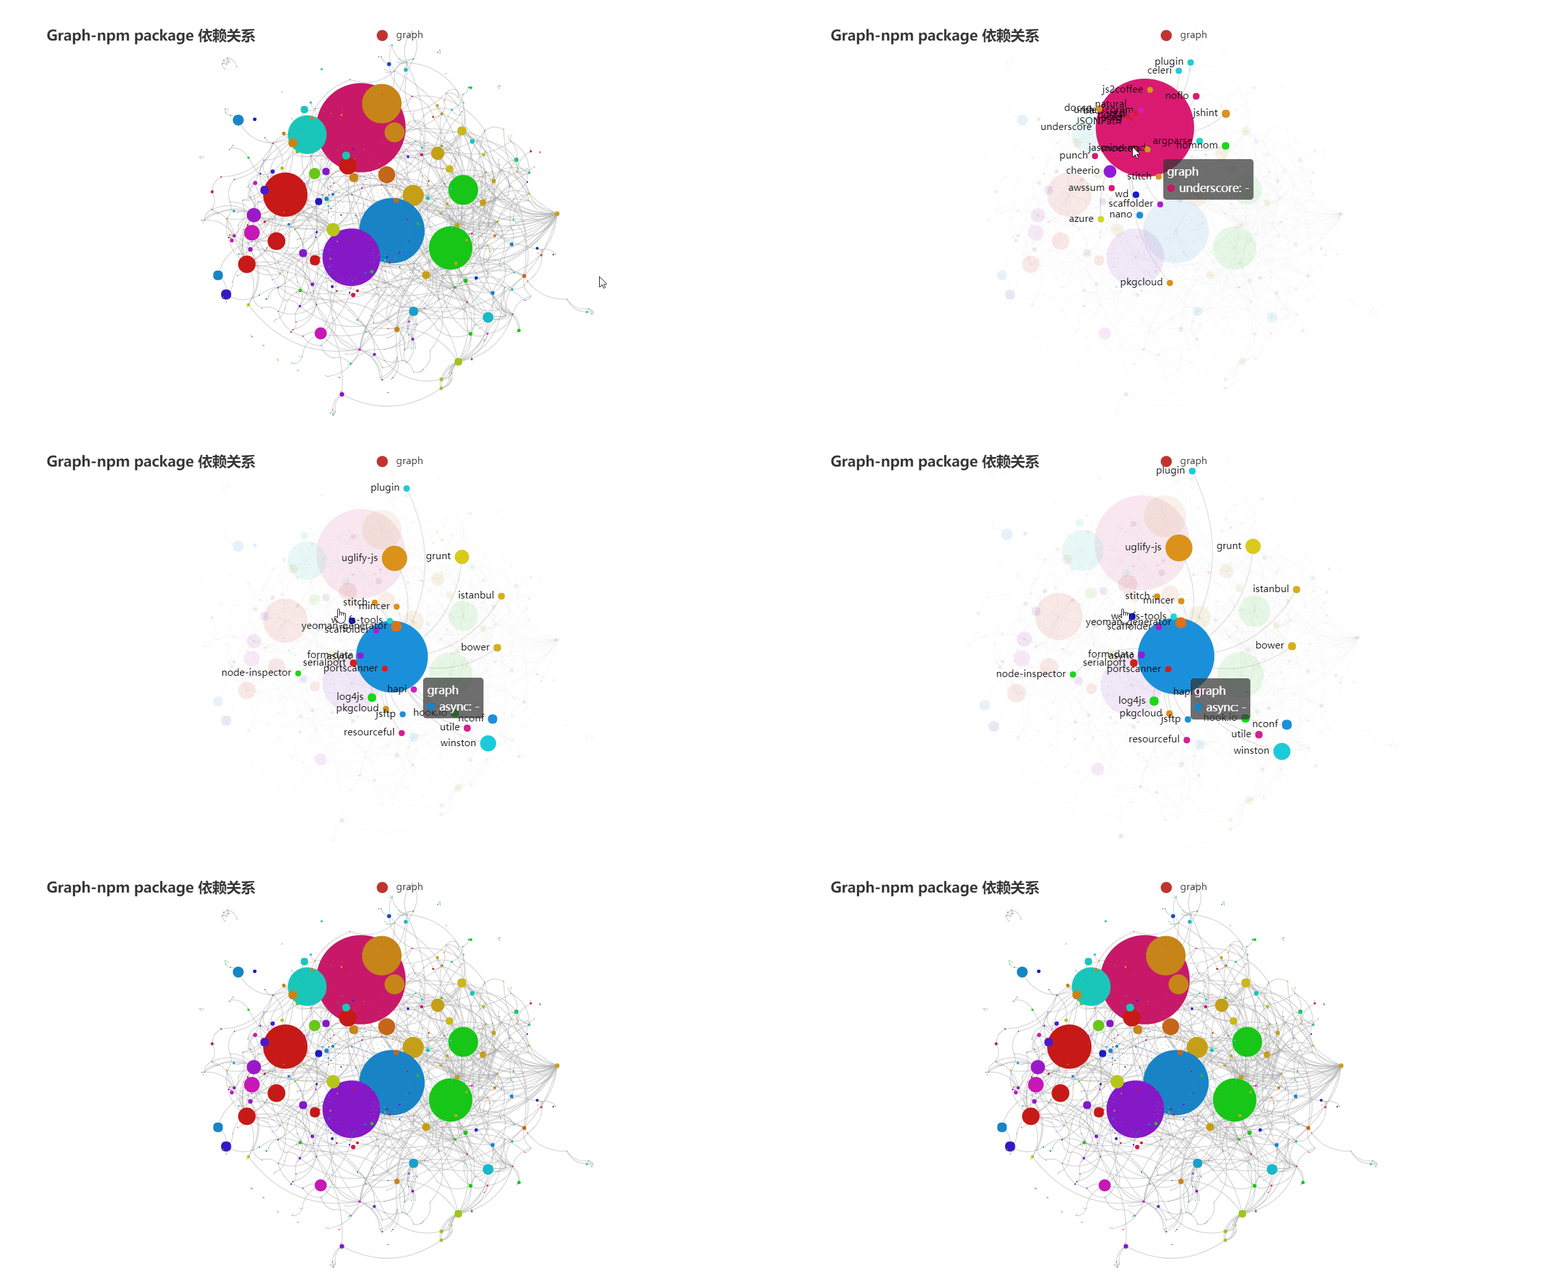
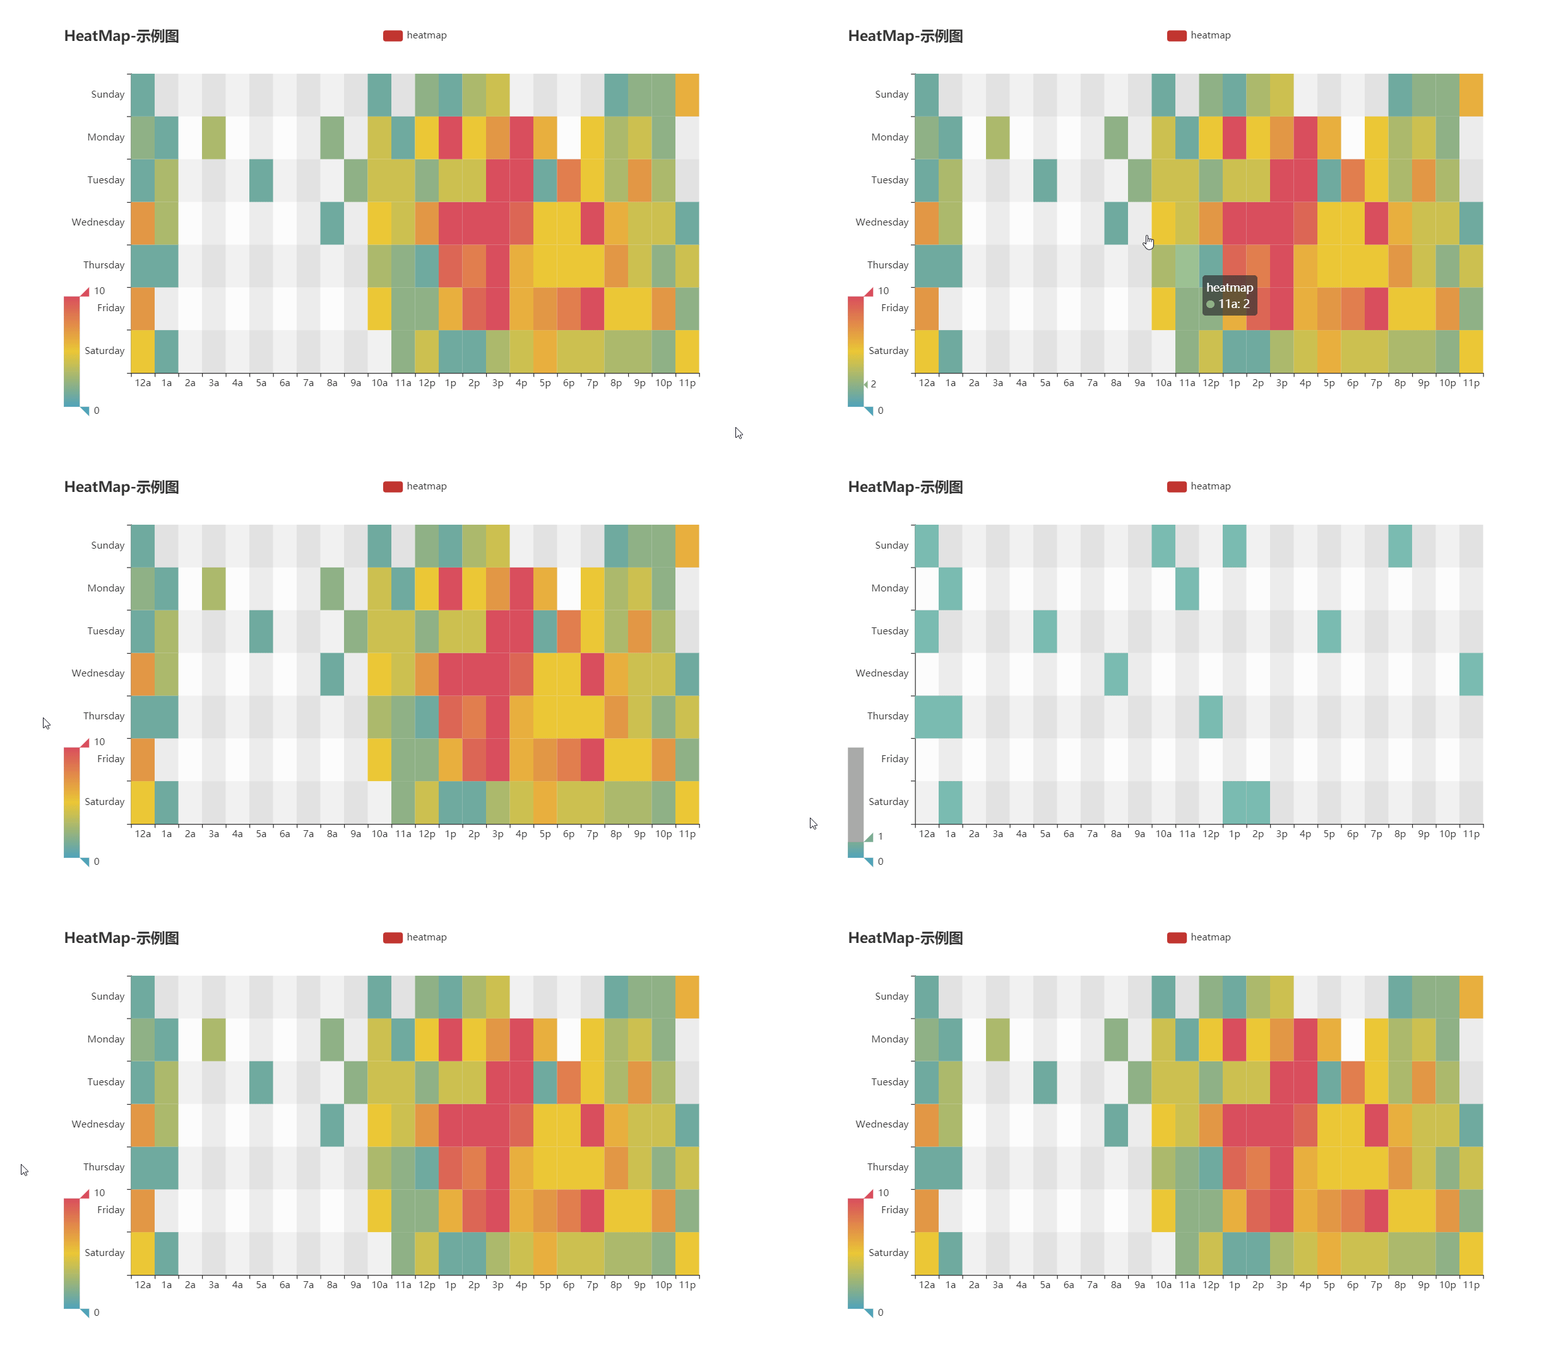
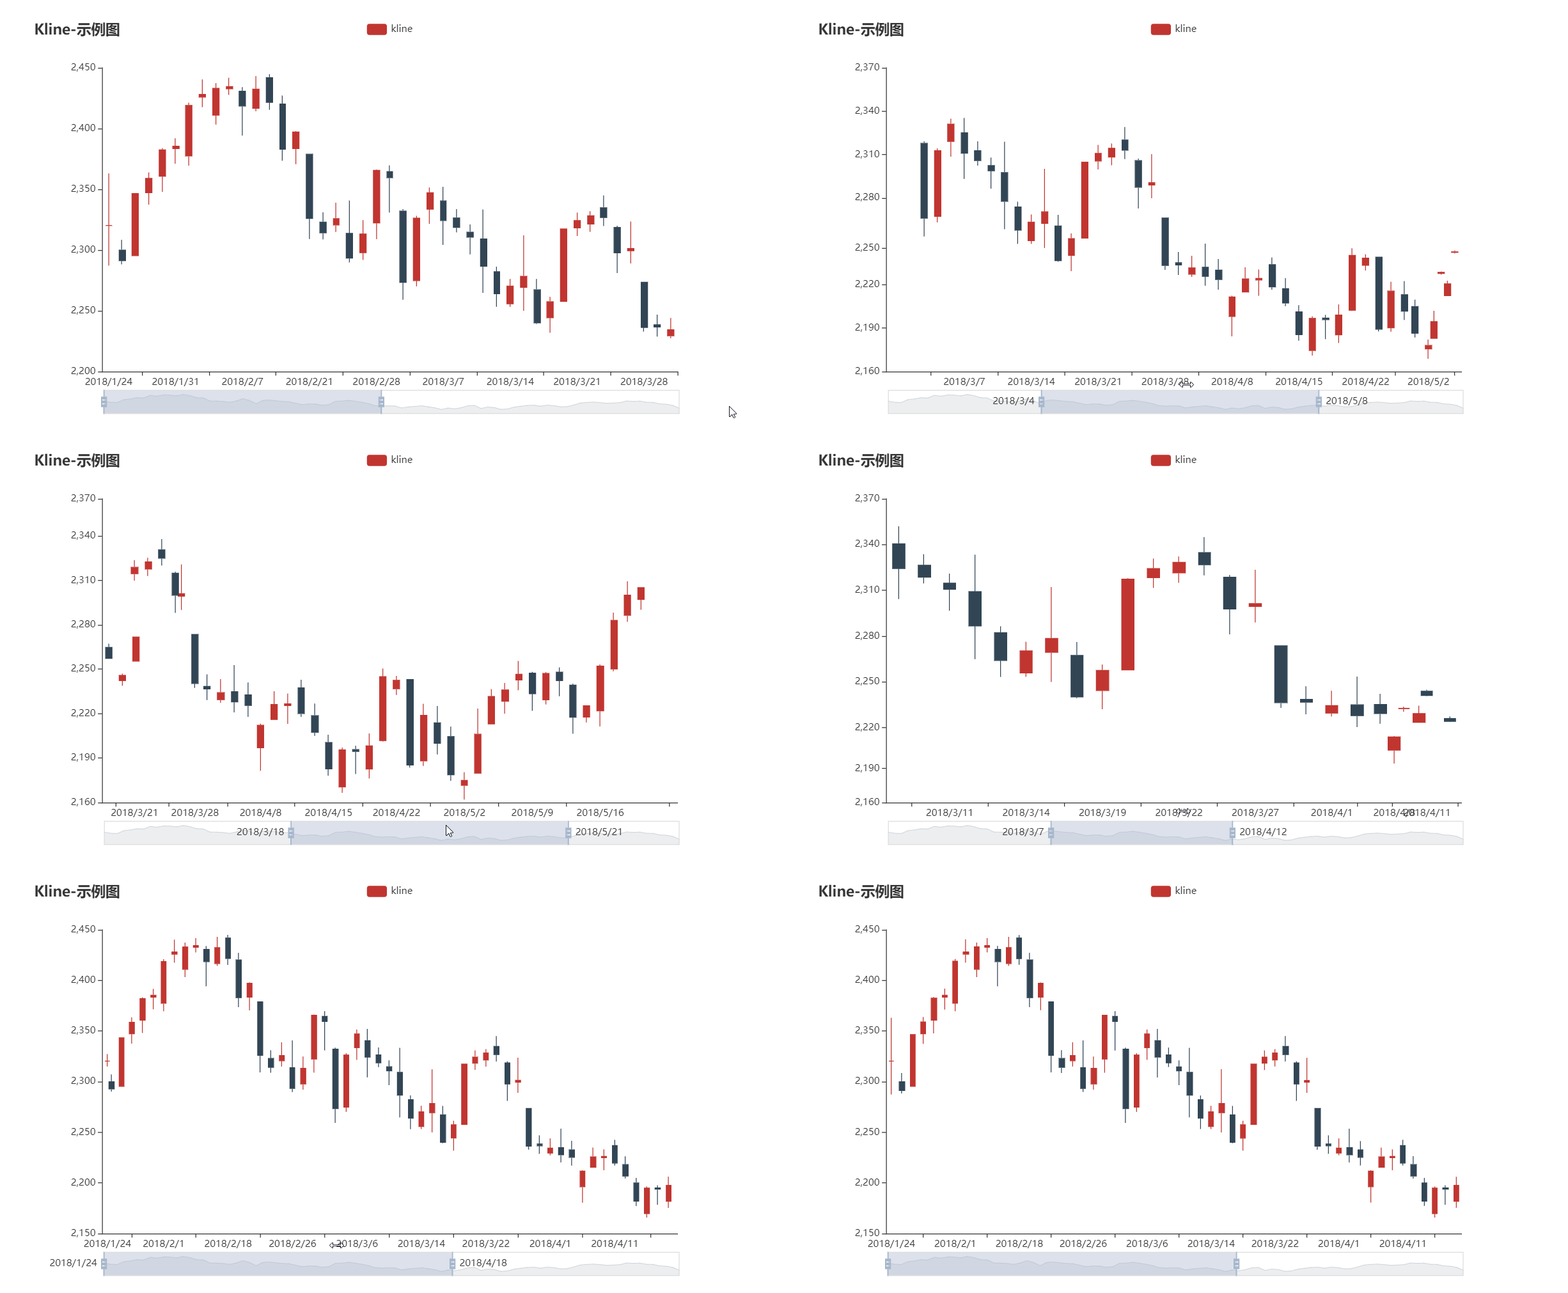
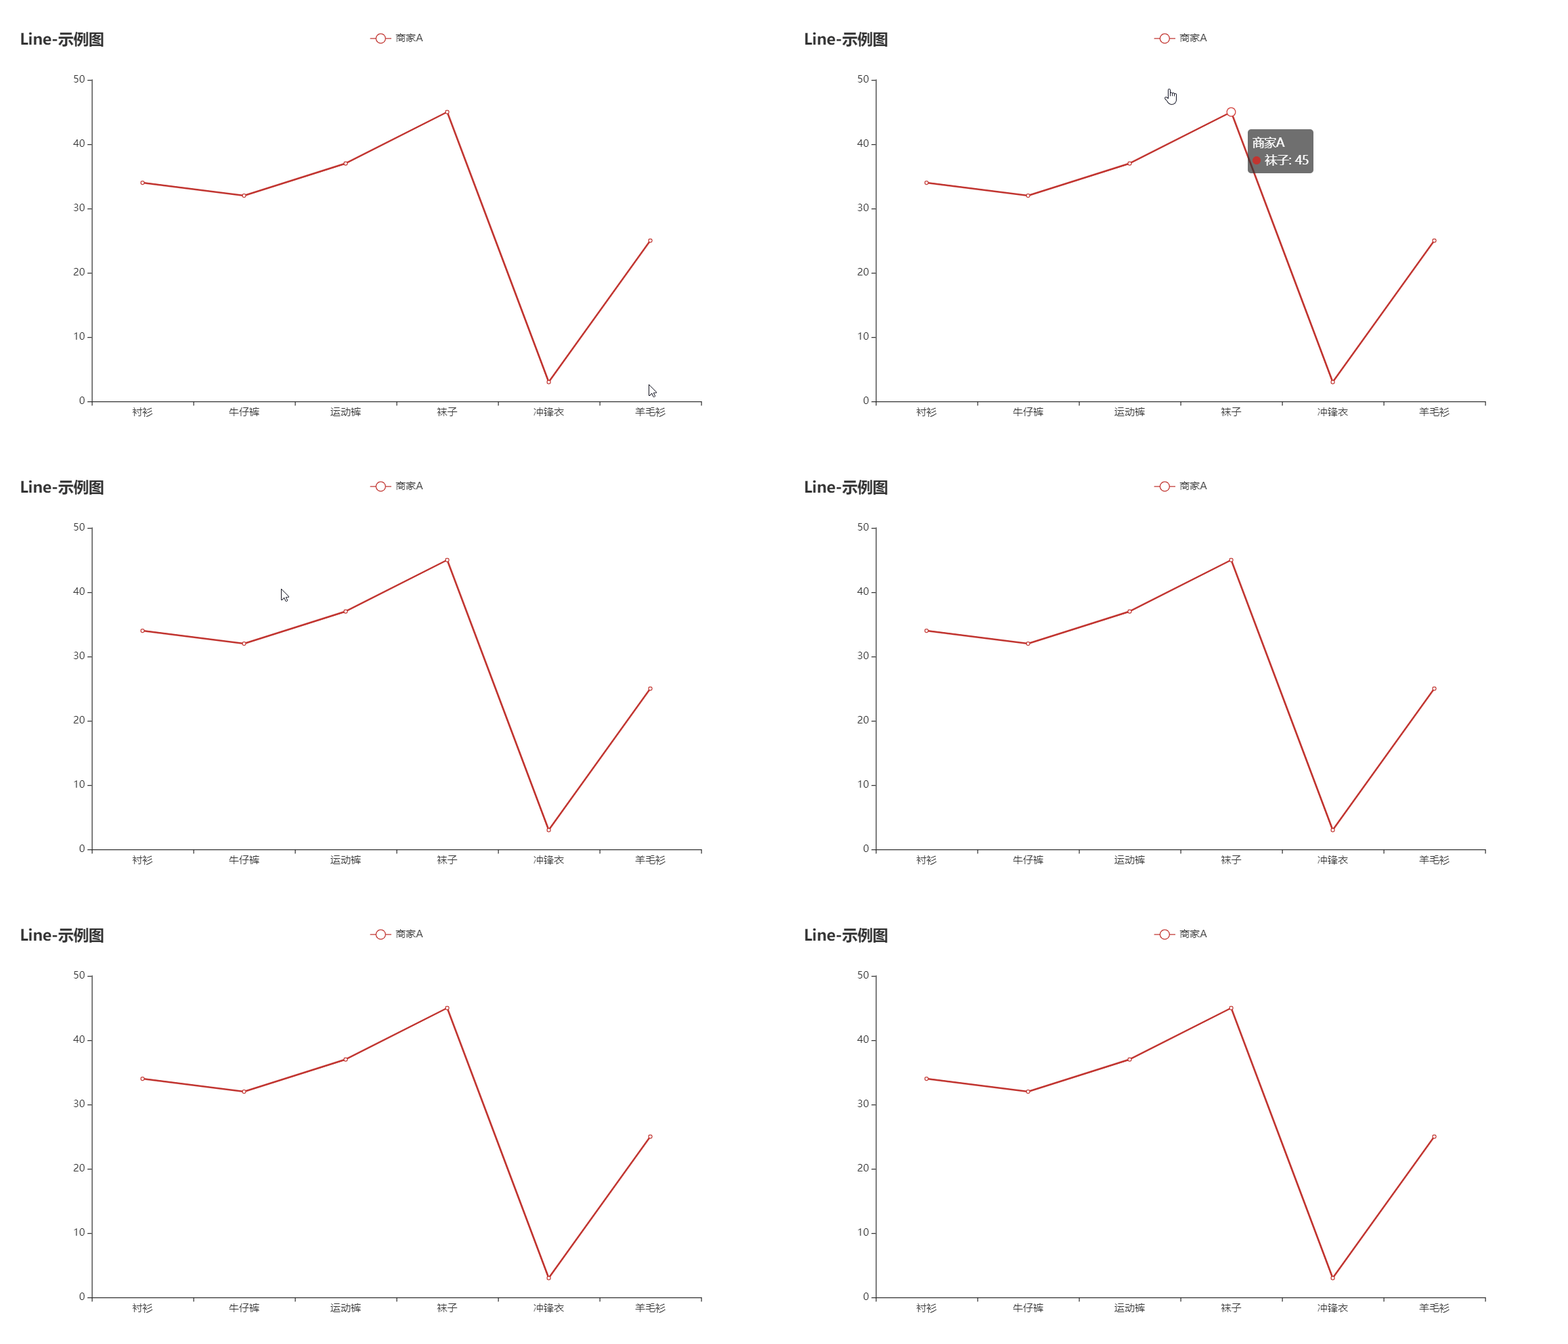
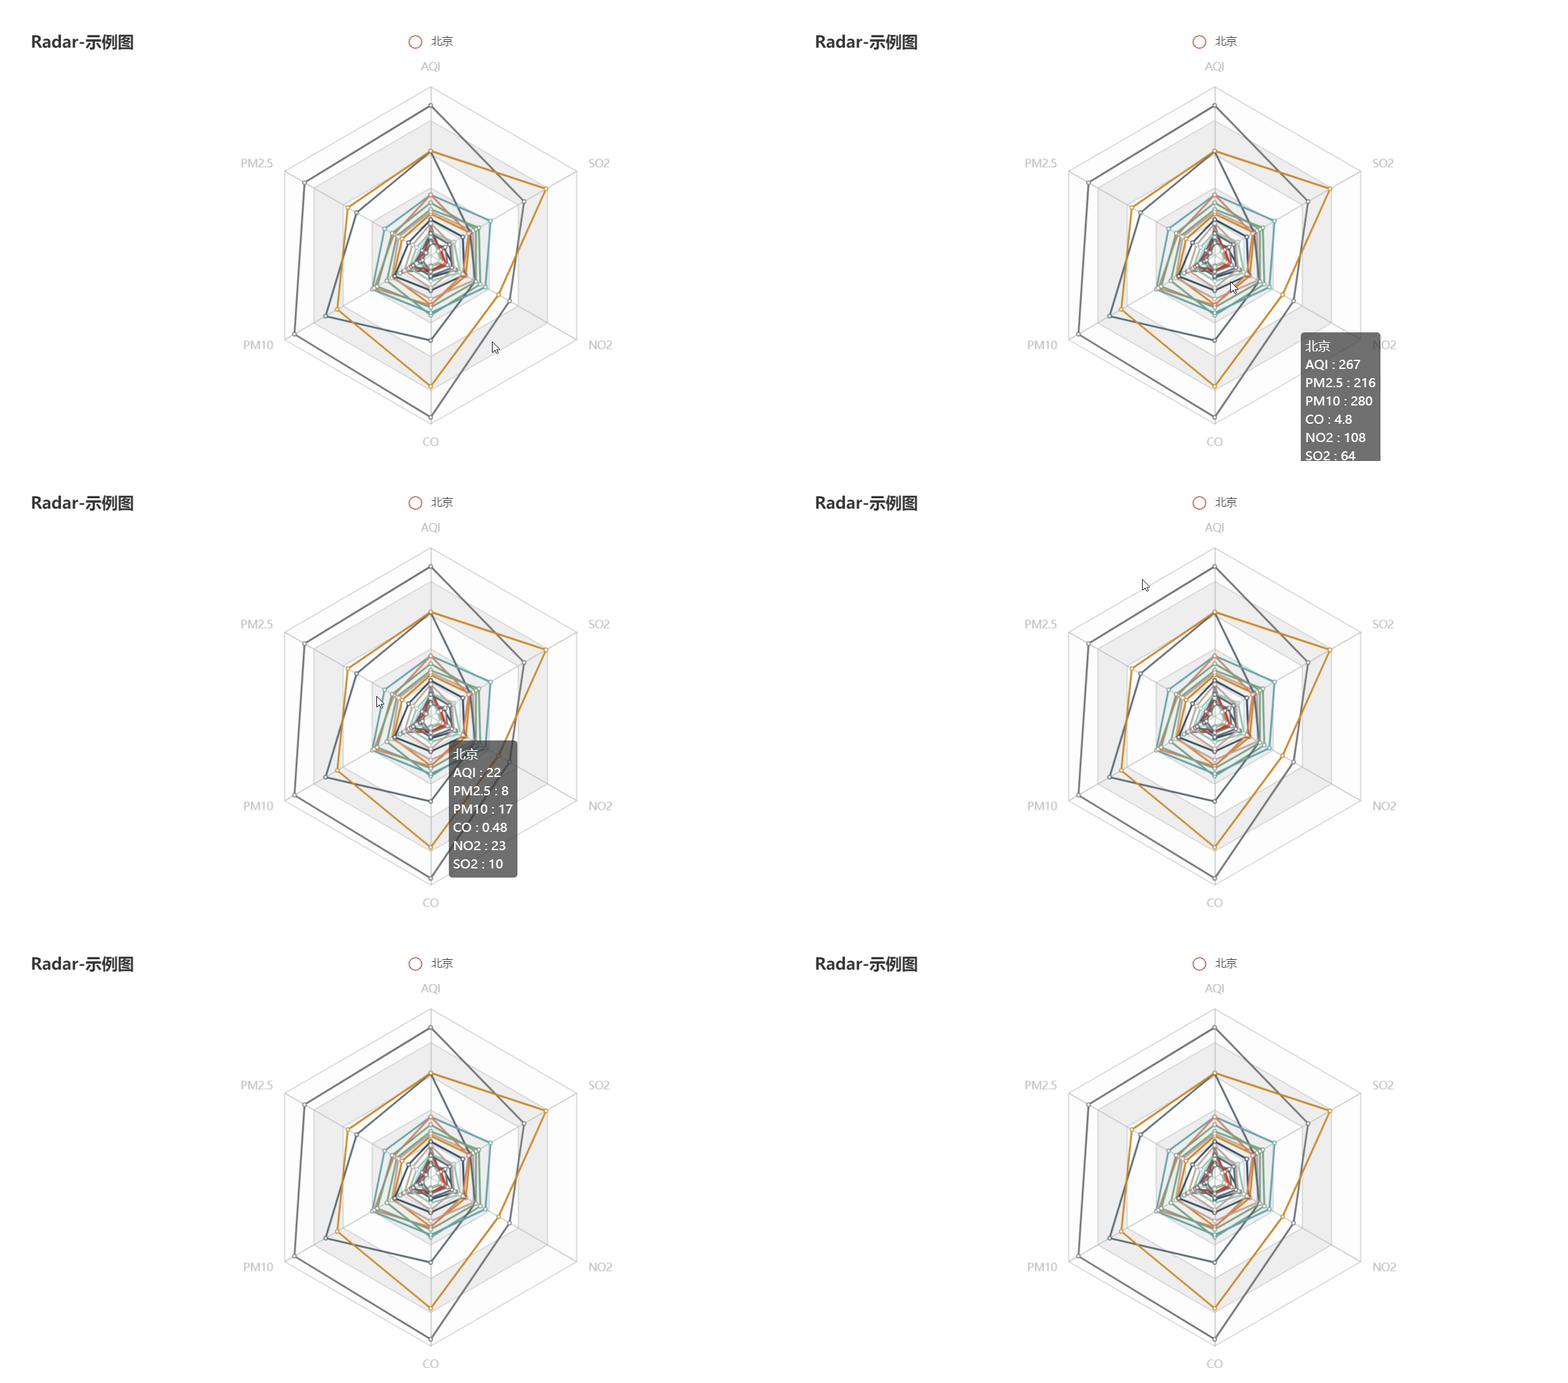
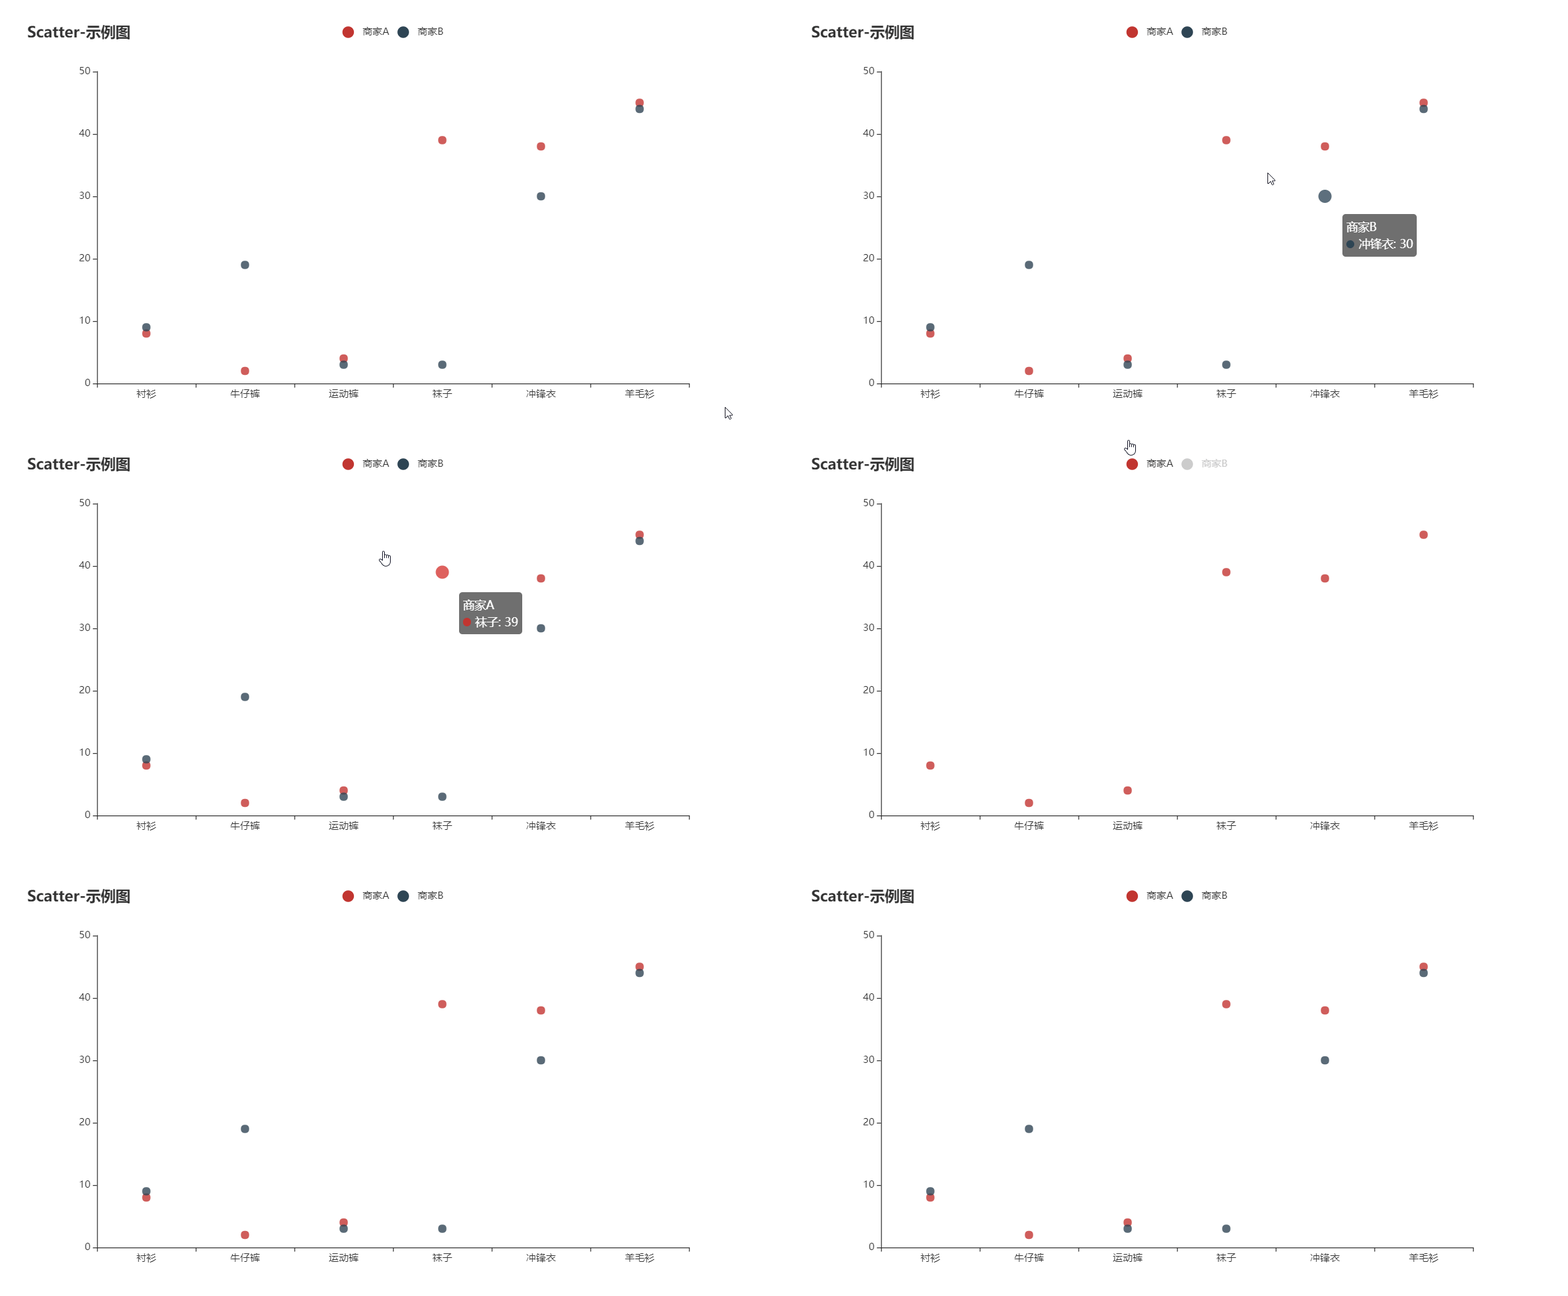
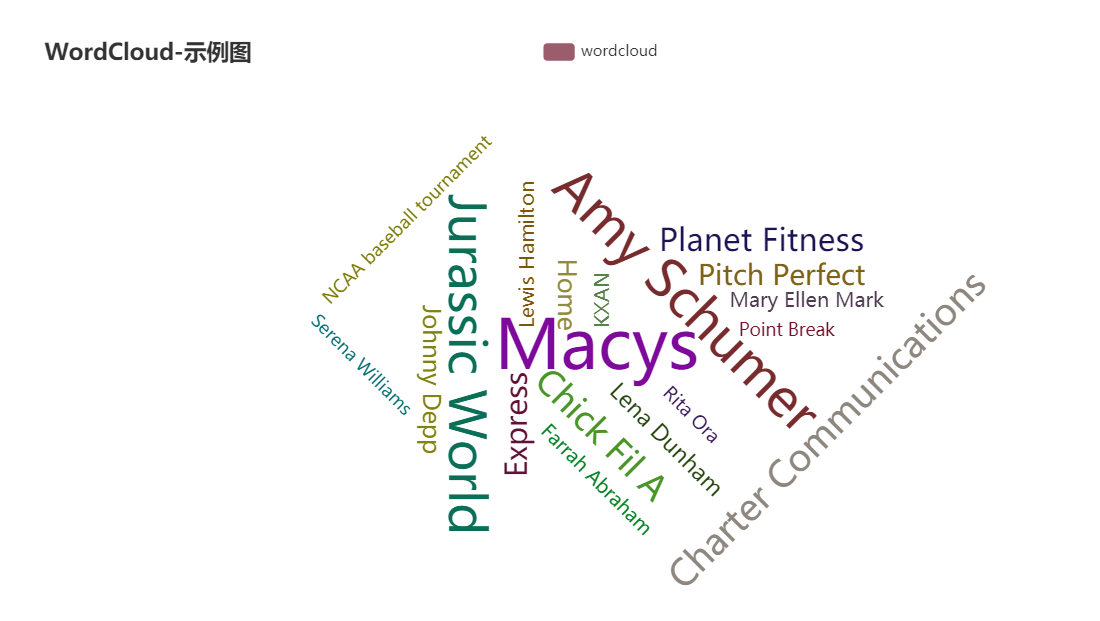
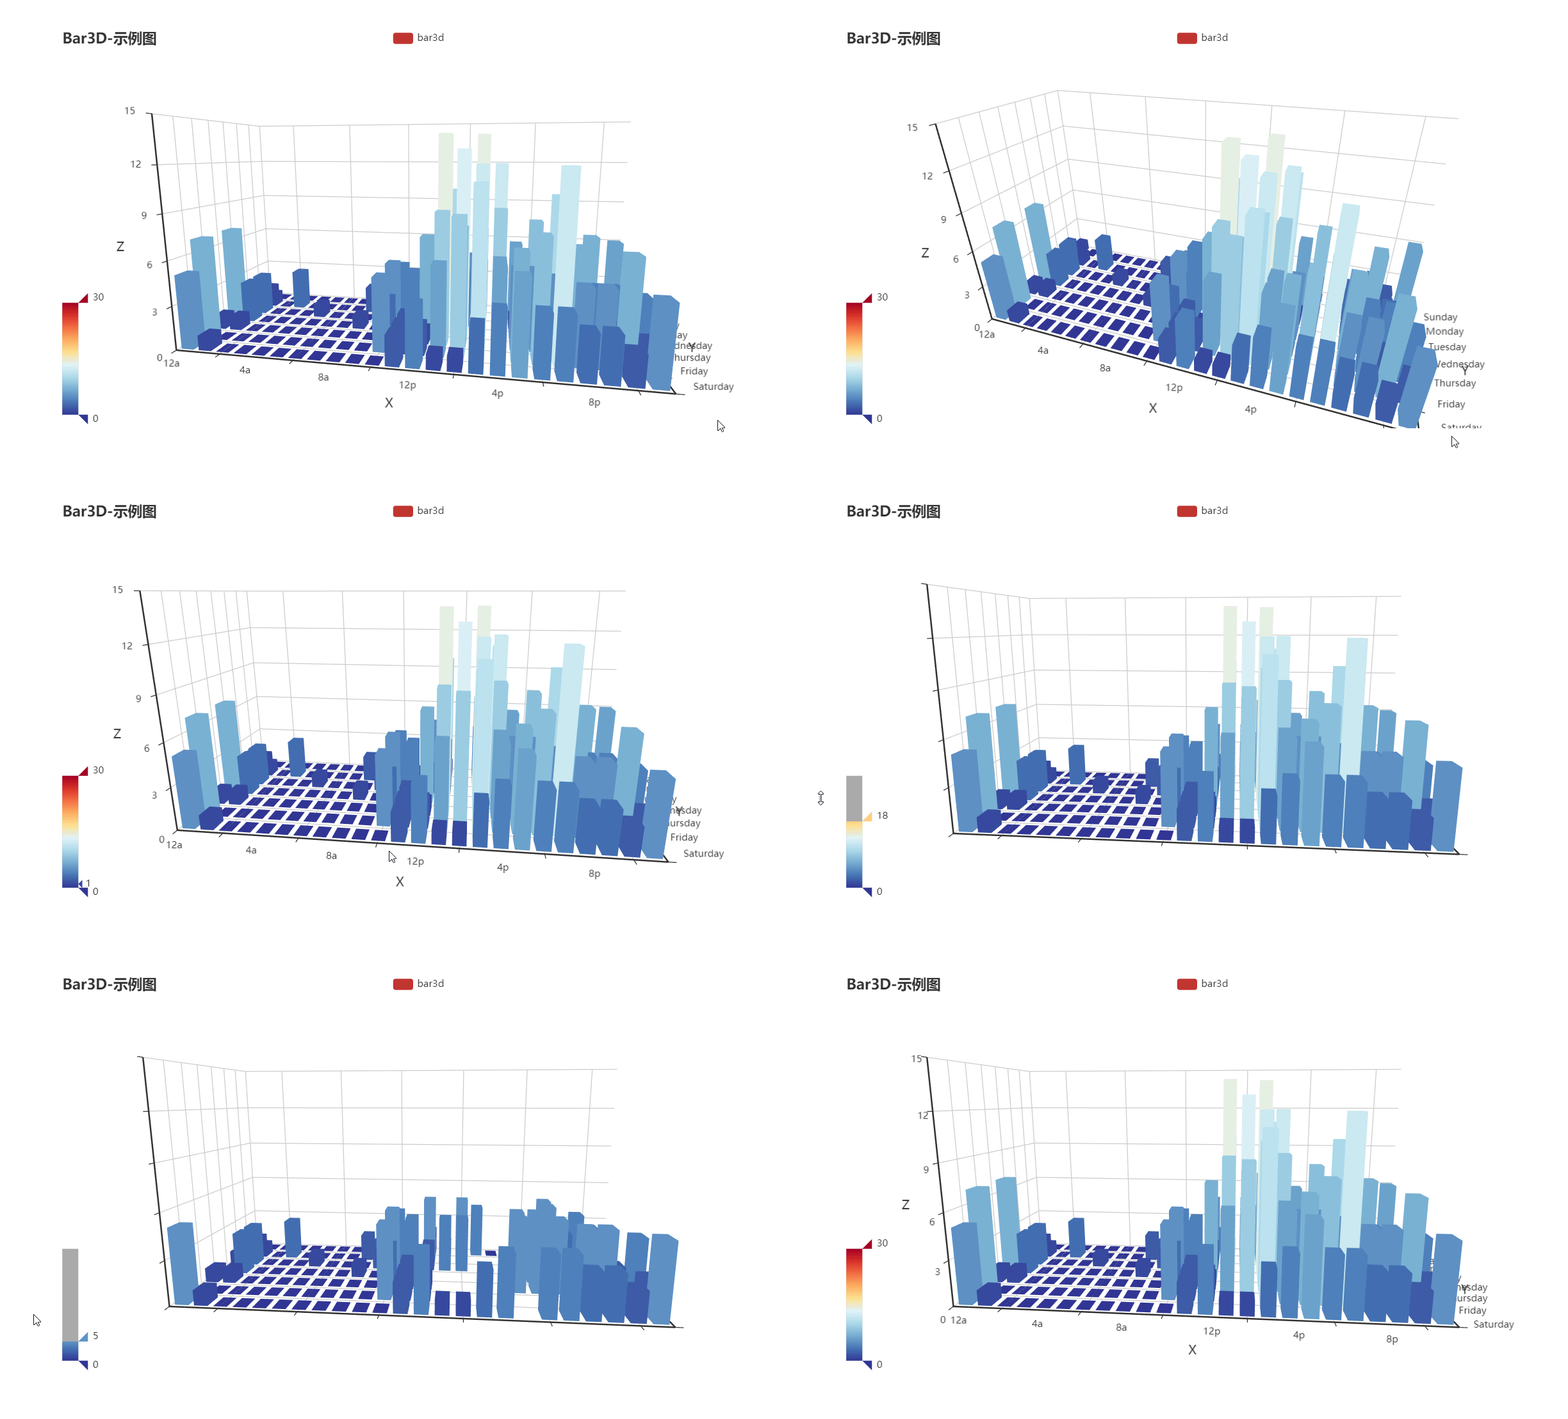
- Visualize your data in 25+ different ways.
- Highly configurable chart options.
- Detailed documentation and a rich collection of examples.
- Visualize your geographical data with 400+ maps.
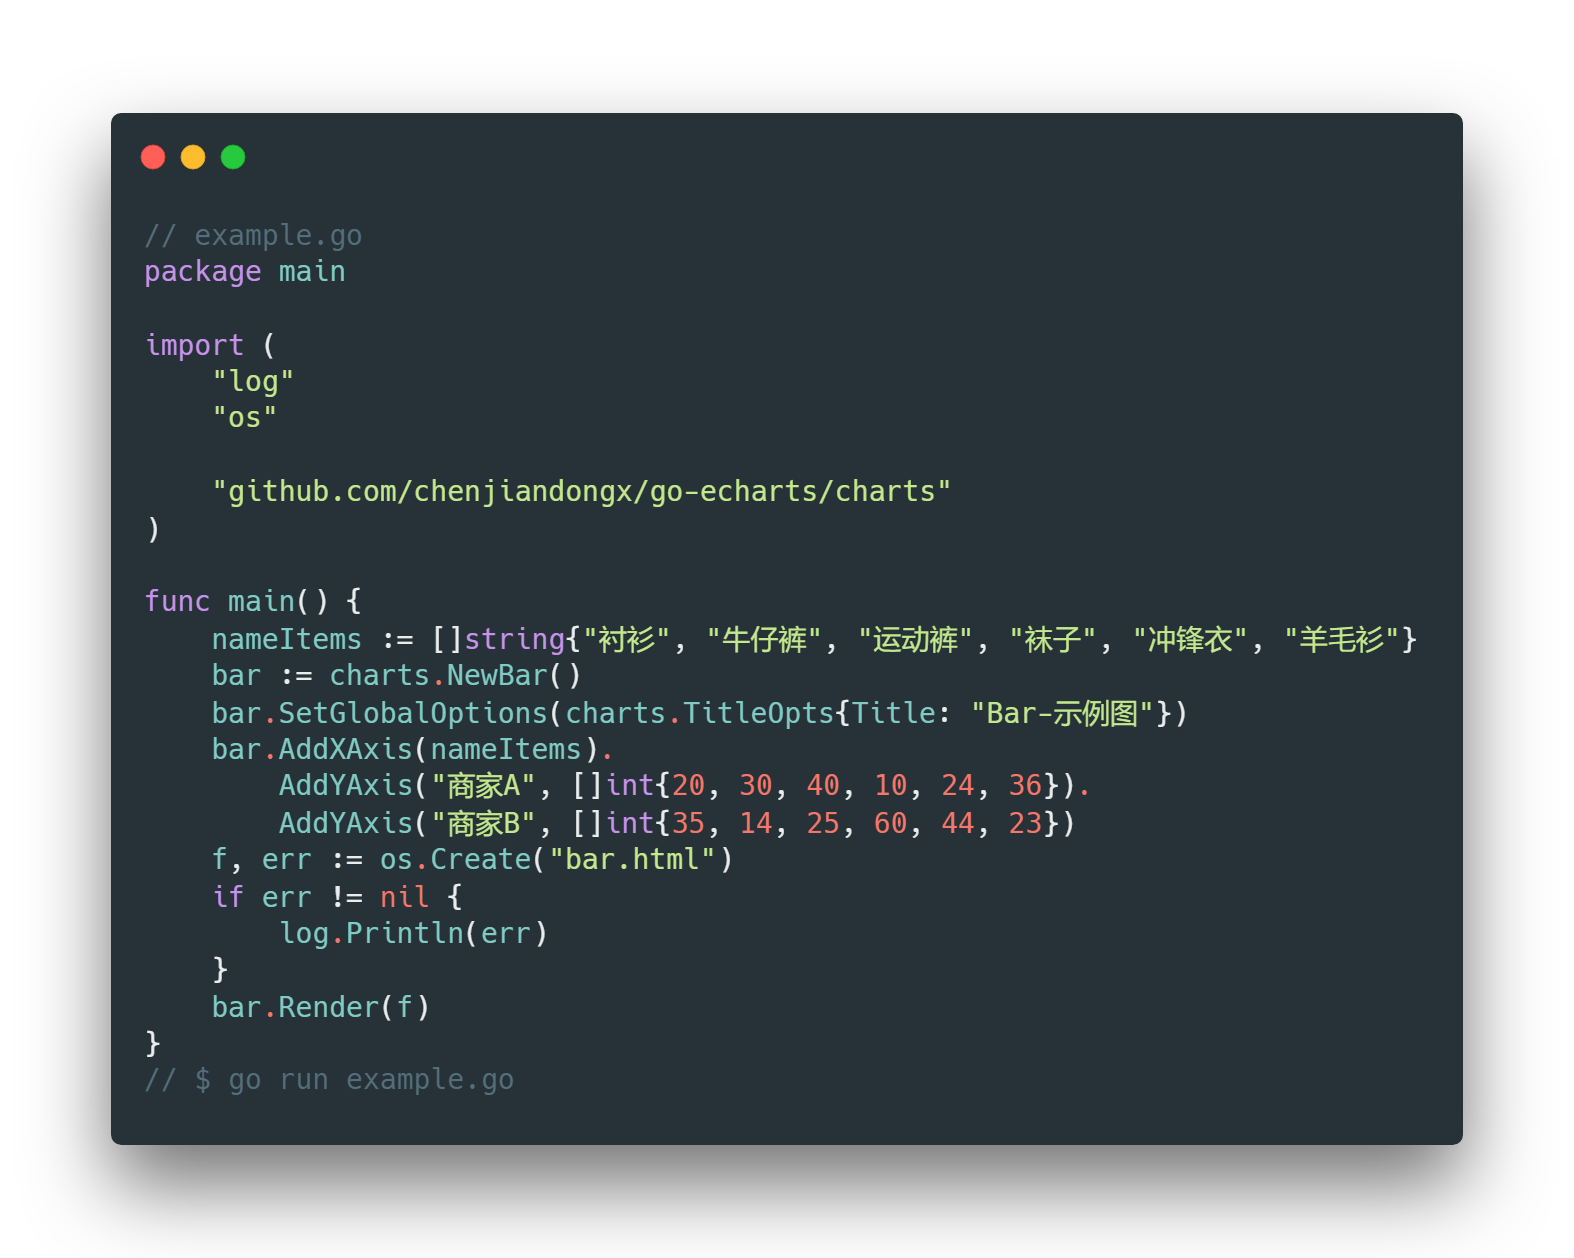
It's easy to get started with go-echarts. In this example, we create a simple bar chart with only a few lines of code.
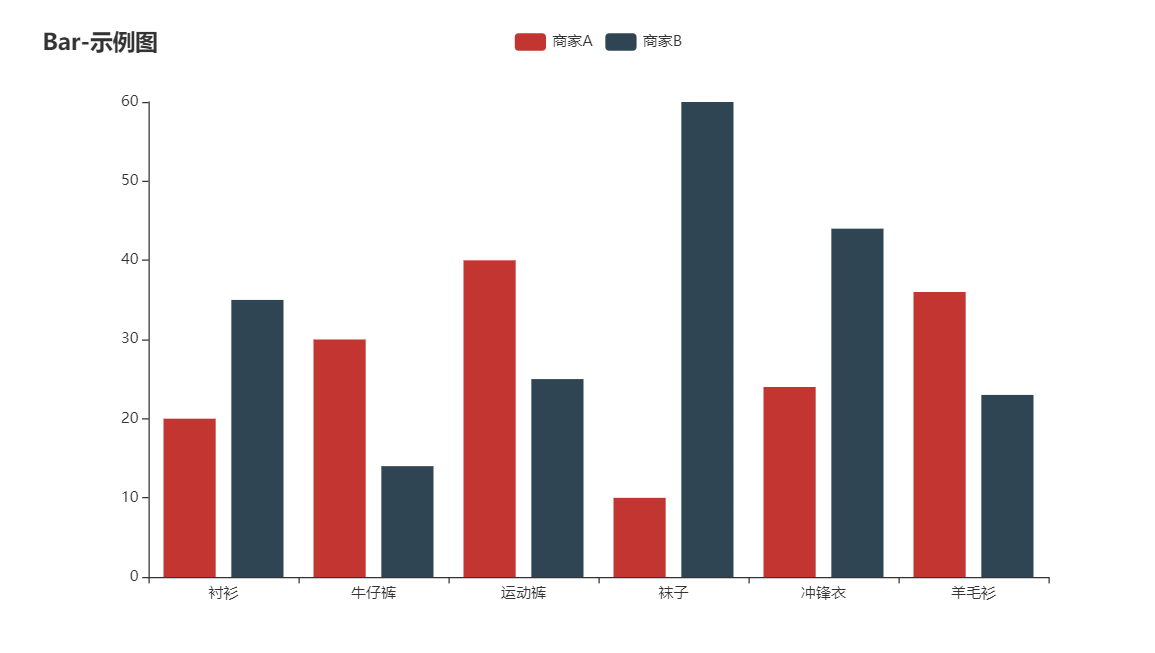
And the generated bar.html is rendered as below. Isn't that cool!
Of course we can also start a listening web server with net/http.
Now visit http://localhost:8081 in your browser and you'll see the same bar chart.
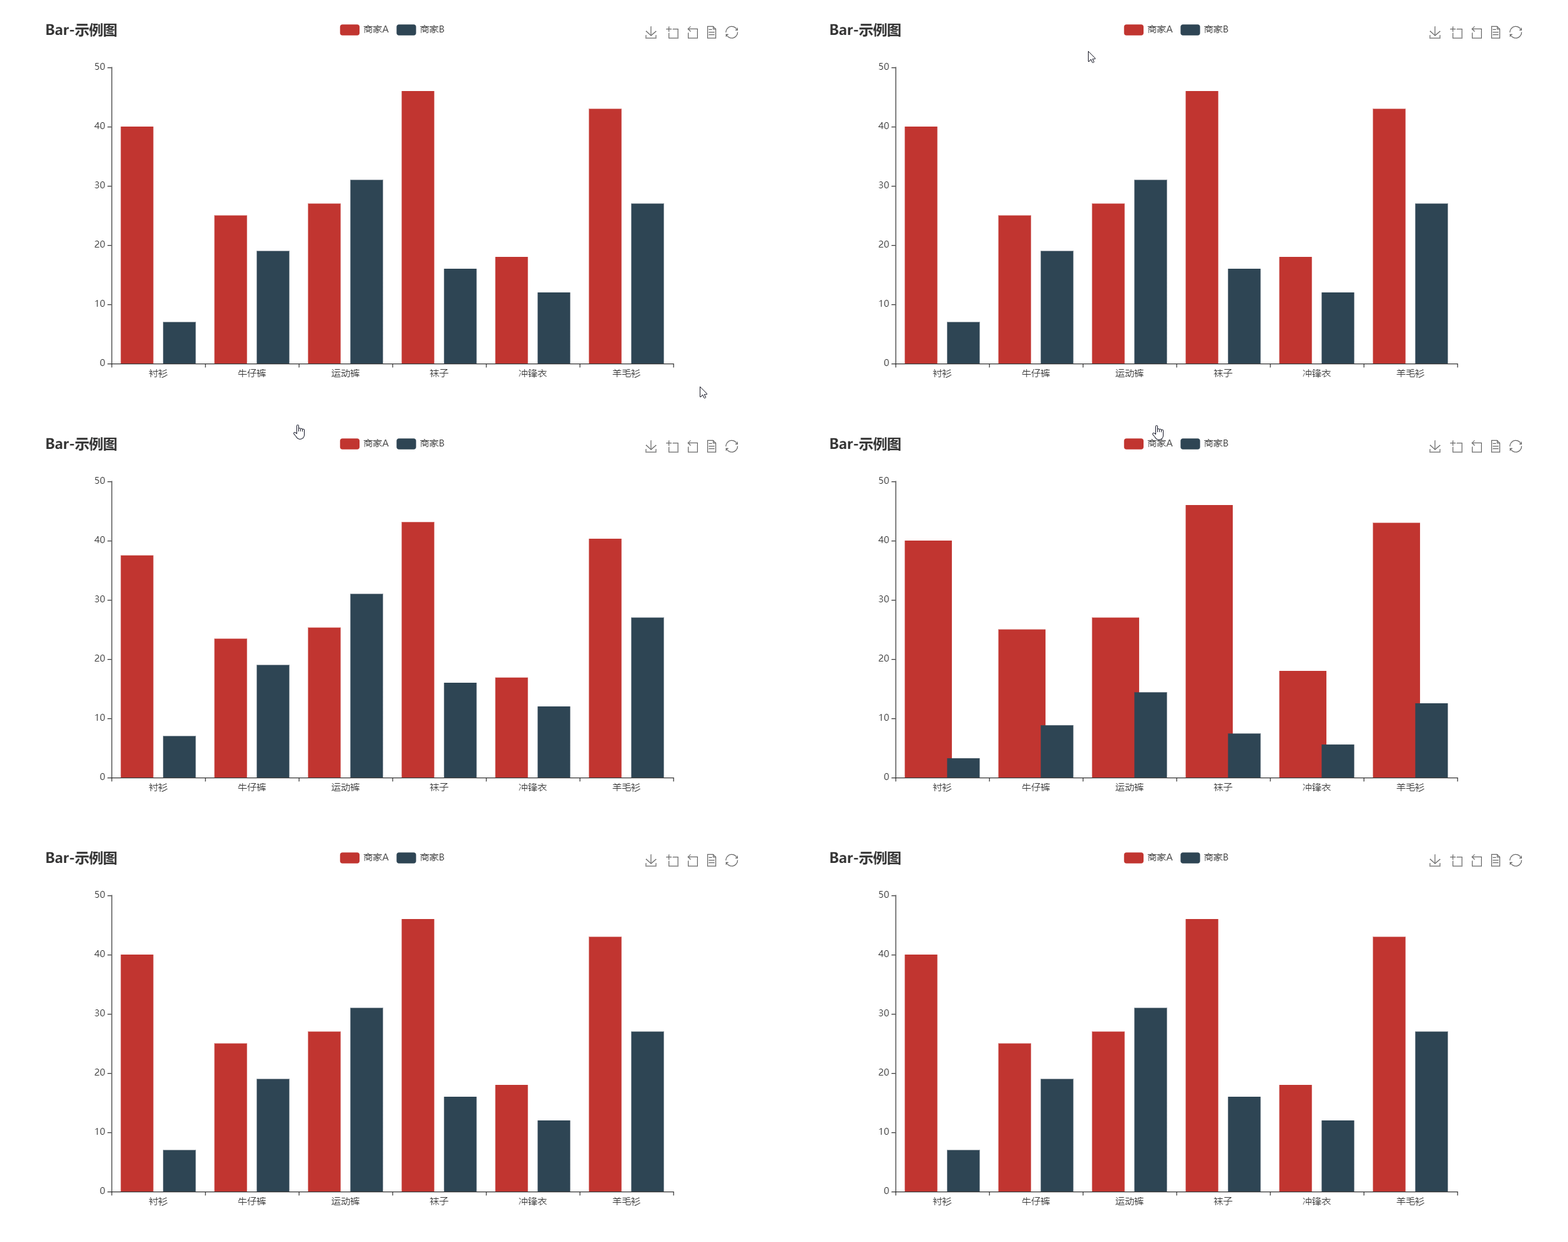
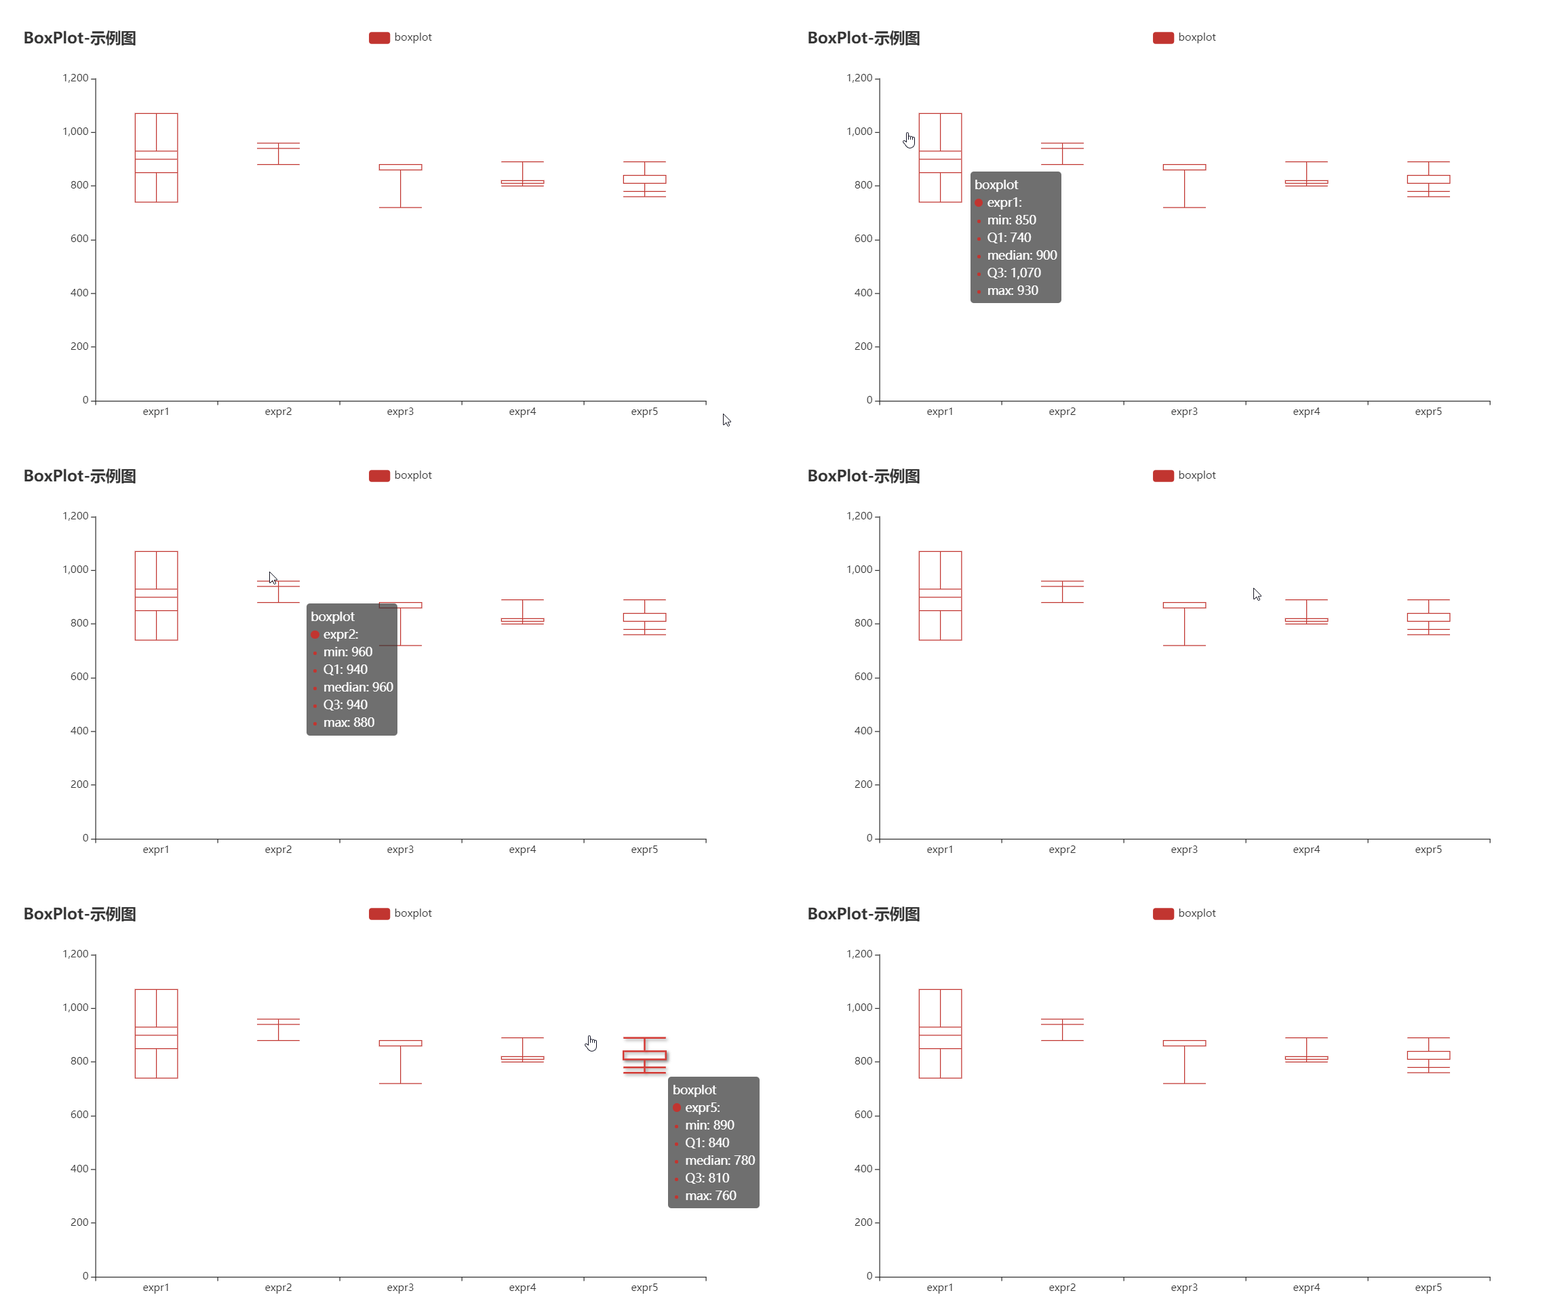
Run the demo program under example/ to view all the above chart examples.
$ cd your/gopath/src/github.com/go-echarts/go-echarts/example
$ go build .
$ ./example
For more information, please refer to go-echarts.github.io/go-echarts/.
MIT ©chenjiandongx


