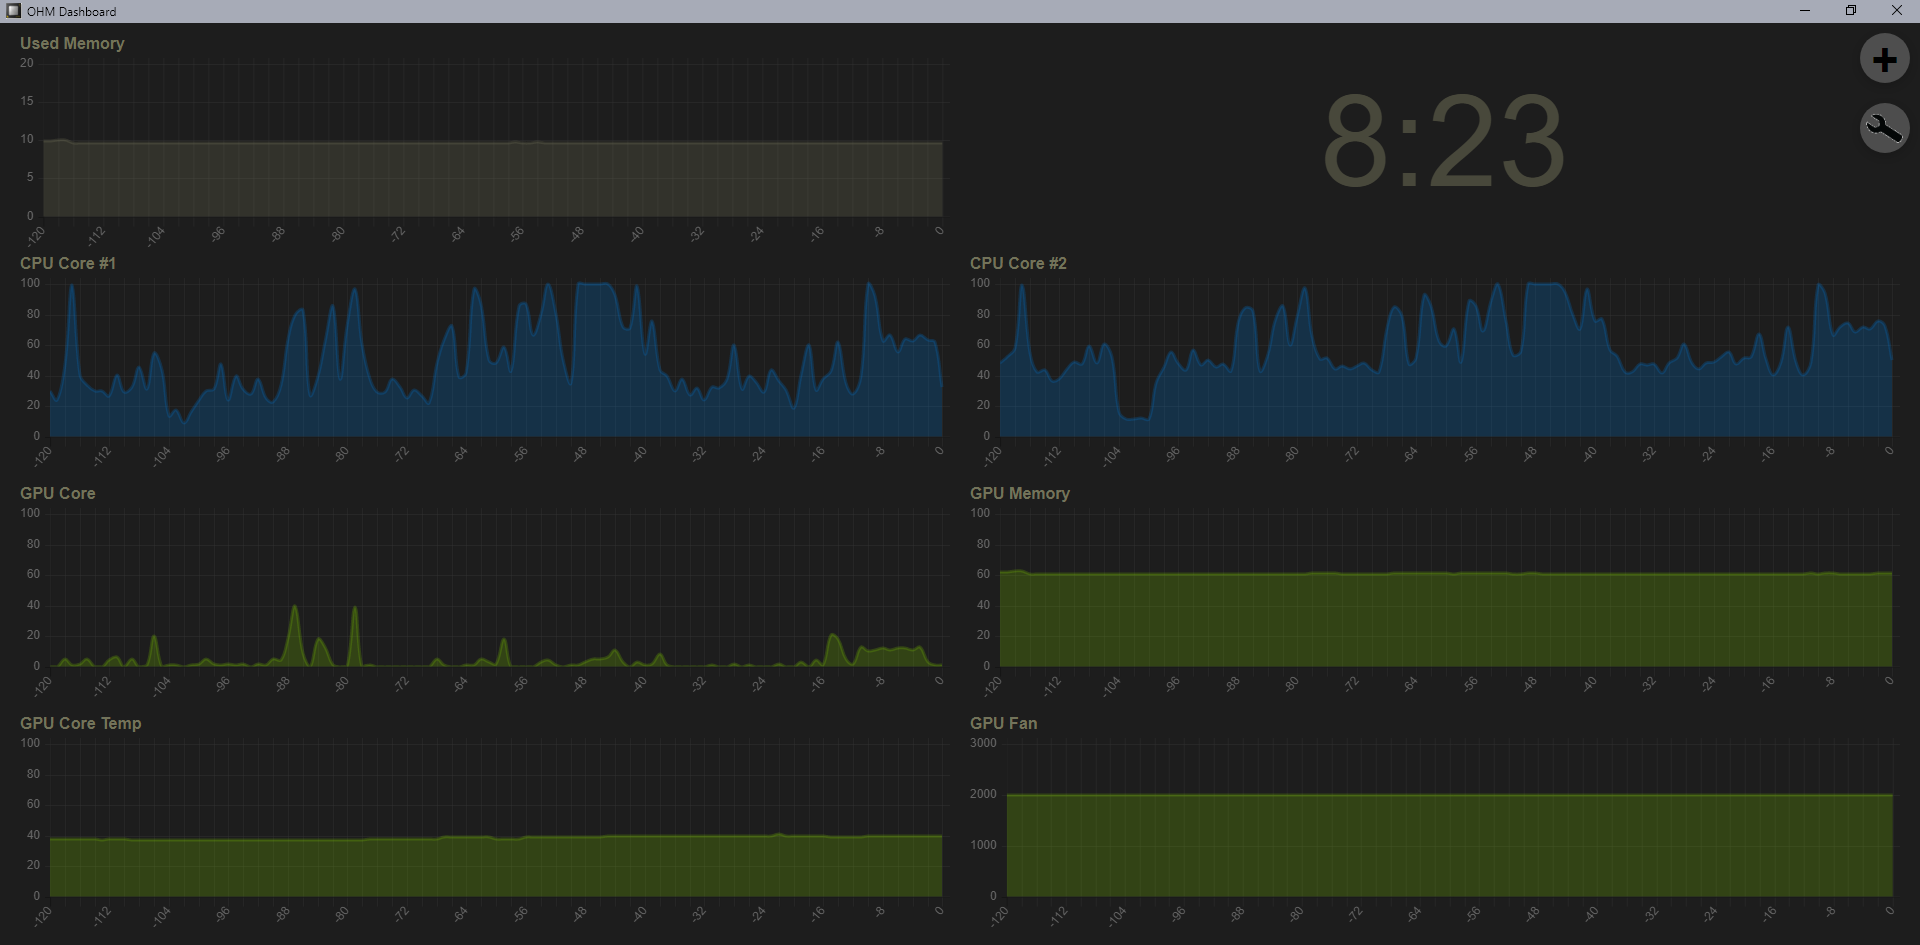
Dashboard for Open Hardware Monitor's Web Interface
Tested with LibreHardwareMonitor
You need to have a UserScript extension (e.g. Tampermonkey for Chrome, Greasemonkey for Firefox) installed to run this script.
- Install this UserScript
- Start Open Hardware Monitor on the computer you want to monitor and activate the web interface (Options -> Remote Web Server -> Run)
- With the computer you want to see the dashboard on, go to the web interface's address (e.g. http://gamingpc:8085) to see the default web interface. You can start the dashboard here but I would suggest adding another part to the address to still have access to the default interface (e.g. go to http://gamingpc:8085/dashboard).
- In the menu of your userscript extension you should see an entry "OHM Dashboard - Activate". Click on that entry to start the dashboard. The dashboard will now always load when you browse to that address. You will now find an entry "OHM Dashboard - Deactivate" in that same menu to turn of the dashboard for that address.
- Start adding graphs and values to your dashboard...
To open the dashboard in a standalone window without all the browser toolbars, you can launch Chrome with:
chrome --app="http://gamingpc:8085"
Credits go to /u/BIGCHOOK for the idea (SMT post)