| Contact | André Dietrich | Sebastian Zug |
|---|---|---|
| andre.dietrich@informatik.tu-freiberg.de | sebastian.zug@informatik.tu-freiberg.de | |
| @an_dietrich | @SebastianZug | |
| web | https://aizac.herokuapp.com | https://tu-freiberg.de/fakult1/inf/professuren/softwaretechnologie-und-robotik |
| https://www.linkedin.com/in/andr%C3%A9-dietrich-73949415/ |
Login & Register & Login again :-)
- goto https://codilia.herokuapp.com
- click on
login - enter an email and password
- click on
register - click on
loginagain - enter your email and password again
- click on
login
OR SELECT ONE OF THE FOLLING LINKS
- Project: https://github.com/LiaScript/CodiLIA
!?CodiLIA
Download the free and open Atom editor and install the required plugins.
- Download: https://atom.io
- Plugins:
- liascript-preview: https://atom.io/packages/liascript-preview
- liascript-snippets: https://atom.io/packages/liascript-snippets

--{{0}}--
Actually you can also apply any other text-editor you want! If you want to preview your course, you will can share your document using Dropbox, NextCloud, etc. by adding your document-url as a parameter to the project website: https://LiaScript.github.io/course?
<iframe src="https://LiaScript.github.io/course?https://github.com/LiaScript/docs/blob/master/README.md" style="width: 100%; height: 400px" ></iframe>--{{0}}--
We are not separated by topics ... we are separated by Learing-Management-Systems and authoring tools. As the data shows, there is a huge amount of LMSs that differ between institutions, countries, and continents. From one perspective, this is great, since it supports the competition and thus evolution of such systems. But, and this is a major drawback, these systems also separate or isolate the developers of educational content. People get stuck to one system or another, without the chance of building communities throug topics.
| Market Share of LMS in 2016 | Europe |
|---|---|
| Blackboard learn | 192 |
| Canvas | 16 |
| Claroline | 32 |
| D2L Brightspace | 16 |
| GUNET eClass | 32 |
| Ilias | 64 |
| Itslearning | 32 |
| Moodle | 1043 |
| Olat | 17 |
| Others | 80 |
| Sakai | 48 |
| Stud.IP | 32 |
_Source: https://www.lmspulse.com/2016/europe-report-moodle-market-share-leader-almost-everywhere _
--{{1}}--
Of course, there is mostly also the possibility of exporting content in a way, that it can be uploaded to various plattforms (e.g. SCORM, xAPI, AICC, etc.), but this does not allow for multiple authors and versioning, as it is common in most open-source communities. Furthermore, the development is mostly hidden behind a certain authoring tool, which leeds us to the next problem ...
--{{0}}--
User-interfaces like the one presented below are not made for humans in the first place, they are designed to guide humans so that their inputs/configurations result in something that be understood by a machine.
{{0-1}}
_")
--{{1}}--
It might look sad, but this is you ;-) ... You cannot break out, you cannot create something new for what there is no input-mask or menu.
{{1-2}}

--{{2}}--
Many of us tend to forget how long it took to get used to this type of interaction and even worse, some start to believe that this is the only way of creating and organizing educational content.
{{2}}

--{{3}}--
Using something like "programming" or markup language for creating interactive educational content requires a learning courve and might look intemidating at first, but afterwards it will be difficult to go back. Furthermore, the language is now your UI/API where you can freely created content, combine elements, or develop new features that have not existed before.
-
{{1}} A Markup-language & interpreter ... for interactive educational content
-
{{2}} Runs in the browser, entirely clientside, no backend, no login required
-
{{3}} Based on:
{{4}}
- Markdown
- HTML
- JavaScript
- LiaScript - Macros
-
{{5}} Features:
{{6}}
-
Animations and Text2Speech output
-
Quizzes & Surveys
-
Interactive Coding & Experimenting
-
Simplified data-visualization & exploration
-
Interactive Texts
-
Extendable
{{7}}
-
Further Sources:
Project-website: https://LiaScript.github.io
Documentation: https://github.com/LiaScript/docs
YouTube: https://www.youtube.com/channel/UCyiTe2GkW_u05HSdvUblGYg
todo
Markdown is a lightweight markup language with plain-text-formatting syntax, created in 2004 by John Gruber and Aaron Swartz. Markdown is often used for formatting readme files, for writing messages in online discussion forums, and to create rich text using a plain text editor.
This is a paragraph. A paragraph consist of multiple lines.
Paragraphs and other Markdown-Blocks are separated from each other by an empty line.
As it is visible above and below in the code, headers are defined with starting
hashtags #. The number of hashtags defines the type of header, reaching from
h1 to h6.
*italic* ==> italic
**bold** ==> bold
***bold and italic*** ==> bold and italic
_also italic_ ==> also italic
__also bold__ ==> also bold
___also bold and italic___ ==> also bold and italic
~strike~ ==> strike
~~underline~~ ==> underline
~~~strike and underline~~~ ==> ~~~strike and underline~~~
^superscript^ ==> ^superscript^
- alpha
- beta
-
gamma and delta
new Paragraph
- alpha
- beta
-
- gamma
- delta
- and epsilon
- probably zeta
| Tables | Are | Cool |
|---|---|---|
| *** col 3 is *** | right-aligned | $1600 |
| ** col 2 is ** | centered | $12 |
| * zebra stripes * | are neat | $1 |
var s = "JavaScript syntax highlighting";
alert(s);
!?CodiLIA
{{1}}
I will appear at first.
{{2-3}} I am the second bullet point and will disappear on 3.
{{3}}
| Table | with |
|---|---|
| some | {4}{ |
--{{1}}--
Hello World! This paragraph is used to describe an important point.
{{1-2}}
The default narrator is defined within the main comment at the top of the document.
<!--
author:   André Dietrich  & Sebastian Zug

email:    your@mail.org

version:  0.0.1

language: en

narrator: US English Female

comment:  Try to write a short comment about
         your course, multiline is also okay.

js: <script>@0</script>
-->
--{{2 French Female}}--
We use responsivevoice to generate spoken output.
{{2-3}}
| Female | Male |
|---|---|
| UK English Female | UK English Male |
| US English Female | US English Male |
| Afrikaans Male | |
| Albanian Male | |
| Arabic Female | Arabic Male |
| Armenian Male | |
| Australian Female | Australian Male |
| Bangla Bangladesh Female | Bangla Bangladesh Male |
| Bangla India Female | Bangla India Male |
| Bosnian Male | |
| Brazilian Portuguese Female | Brazilian Portuguese Male |
| Catalan Male | |
| Chinese Female | Chinese Male |
| Chinese (Hong Kong) Female | Chinese (Hong Kong) Male |
| Chinese Taiwan Female | Chinese Taiwan Male |
| Croatian Male | |
| Czech Female | Czech Male |
| Danish Female | Danish Male |
| Deutsch Female | Deutsch Male |
| Dutch Female | Dutch Male |
| Esperanto Male | |
| Estonian Male | |
| Filipino Female | |
| Finnish Female | Finnish Male |
| French Canadian Female | French Canadian Male |
| French Female | French Male |
| Greek Female | Greek Male |
| Hindi Female | Hindi Male |
| Hungarian Female | Hungarian Male |
| Icelandic Male | |
| Indonesian Female | Indonesian Male |
| Italian Female | Italian Male |
| Japanese Female | Japanese Male |
| Korean Female | Korean Male |
| Latin Female | Latin Male |
| Latvian Male | |
| Macedonian Male | |
| Moldavian Female | Moldavian Male |
| Montenegrin Male | |
| Nepali | Nepali |
| Norwegian Female | Norwegian Male |
| Polish Female | Polish Male |
| Portuguese Female | Portuguese Male |
| Romanian Female | Romanian Male |
| Russian Female | Russian Male |
| Serbian Male | |
| Serbo-Croatian Male | |
| Sinhala | Sinhala |
| Slovak Female | Slovak Male |
| Spanish Female | Spanish Male |
| Spanish Latin American Female | Spanish Latin American Male |
| Swahili Male | |
| Swedish Female | Swedish Male |
| Tamil Female | Tamil Male |
| Thai Female | Thai Male |
| Turkish Female | Turkish Male |
| Ukrainian Female | |
| Vietnamese Female | Vietnamese Male |
| Welsh Male |
--{{3 Russian Female}}--
Все это тоже работает на разных языках.
{{|>}} Please, press the play-button.
{{2 |>}} These play-buttons can also be combined with {|> 3}{multiple} effects.
| go | EN | DE | RU | AR male | AR female |
|---|---|---|---|---|---|
| I | @en(I go) | @de(ich gehe) | @ru(я хожу) | @ar(Male,أذْهبُ) | |
| you | @en(you go) | @de(du gehst) | @ru(ты ходишь) | @ar(Male,تذْهبُ) | @ar(Female,تذْهبين) |
| he/she/it | @en(he/she/it goes) | @de(er/sie/es geht) | @ru(он / она / оно ходит) | @ar(Male,يذْهبُ) | @ar(Female,تذْهبُ) |
| we | @en(we go) | @de(wir gehen) | @ru(мы ходим) | @ar(Male,نذْهبُ) | |
| you | @en(you go) | @de(ihr geht) | @ru(вы ходите) | @ar(Male,تذْهبون) | @ar(Female,تذْهبْن) |
| they | @en(they go) | @de(sie gehen) | @ru(они ходят) | @ar(Male,يذْهبون) | @ar(Female,يذْهبْن) |
This can be used everywhere $ f(a,b,c) = (a^2+b^2+c^2)^3 $ within your text.
This defines a single block
What did the fish say, when he hit the wall?
[[dam]]
I have 3 brothers and each brother has 3 brothers how many are we?
[( )] X
[(X)] IV
[( )] III
[( )] IIX
Where is the OEB situated in 2020 during the Covid-pandamnic?
[[X]] Berlin
[[ ]] Egypt
[[X]] ... at home
Select the general quibic formula!
[[$ f(x) = ax + b $
| $ f(x) = ax^2 + bx + c $
|($ f(x) = ax^3 + bx^2 + cx + d $)
| $ f(a,b,c) = (a^2+b^2+c^2)^3 $
]]
I have 3 brothers and each brother has 3 brothers how many are we?
[( )] X
[(X)] IV
[( )] III
[( )] IX
[[?]] !?[youtube](https://www.youtube.com/watch?v=vAmCV_lEqsc)
[[?]] Roman numerals from 1 to 10 --> 1:I; 2:II; 3:III; 4:IV; 5:V; 6:VI; 7:VII; 8:VIII; 9:IX; 10:X
I have 3 brothers and each brother has 3 brothers how many are we?
[( )] X
[(X)] IV
[( )] III
[( )] IX
[[?]] !?[youtube](https://www.youtube.com/watch?v=vAmCV_lEqsc)
[[?]] Roman numerals from 1 to 10 --> 1:I; 2:II; 3:III; 4:IV; 5:V; 6:VI; 7:VII; 8:VIII; 9:IX; 10:X
*******************************************************
If one brother has 3 brothers, then there are actually
4 of them.

The main problem then is to express the number 4 in
roman numerals, thus 4 is equal to ( 5 - 1 ) => (IV).
*******************************************************
What did the fish say, when he hit the wall?
[[dam]]
<script>
  // @input will be replace by the user input
  let input_string = "@input".trim().toLowerCase()
  input_string == "dam" || input_string == "damn"
</script>
--{{0}}--
Of course it is possible to add images, but ASCII-art gives you the opportunity to stay with the editor and the medium text. You can quickly sketch a signal-path, a graph, diagram or some data-points. Changes can be made imediately, without ever switching to another tool.
--{{1}}--
Plot-like representation are identified by the depiction of x and y axis, horizontal and vertical lines, that are connected via a plus. The height and width of the plot can be set arbitrarily, and all labels and annotions as well as the title are optional. Different characters result in different curves and shapes, and if some characters cannot be presented as a function-plot in the mathematical sense, then only the dots are drawn.
{{1-2}}
                                     Title
0.9 | DOTS
    |                ***                        (* Just an example function)
  y |              *     *                      (r some upper bound)
  - |r r r r r r r*r r r r*r r r r r r r        (B some lower bound)
  a |            *         *
  x |           *           *
  i |B B B B B * B B B B B B * B B B B B
  s |        *                 *
    |*  * *                       * * * *
 -1 +-----------------------------------
    -0              x-axis              5


--{{2}}--
If you want to have more complex drawings that might interfere with the common
Markdown-nontation you can enclose them within three backticks (\``) like a code snippet, but indicate the appropriate visualization with asciiorart`.
{{2-3}}
             .--.            .---.  .---. .---.  .---.    .---.  .---.
             |  |   OS API   '-o-'  '-o-' '-+-'  '-#-'    '-+-'  '-o-'
             v  |              |      |     |      |        |      |
    .-. .-. .-. |              v      v     |      v        |      v
.-->'-' '-' '-' |            .------------. | .-----------. |  .-----.
|     \  |  /   |            | Filesystem | | | Scheduler | |  | MMU |
|      v + v    |            '------+-----' | '----+------' |  '-----'
|_______/ \_____|                   |       |      |        |
        \ /                         v       |      |        v
         +     ____              .----.     |      |    .---------.
         '--> /___/              | IO |<----'      |    | Network |
                                 '--+-'            |    '----+----'
                                    |              |         |
                                    v              v         v
                             .---------------------------------------.
                             |                  HAL                  |
                             '---------------------------------------'
--{{3}}--
But for shorthand it is also possible to use at least 8 backtics (\``), which is similare to the usage of the keyword ascii`.
{{3}}
       0       3                       +y
       *-------*                       ^
    1 /|    2 /|                       |
     *-+-----* |                       |
     | |4    | |7                      | ◄╮
     | *-----+-*                     ⤹ +------> +x
     |/      |/                       / ⤴
     *-------*                       /
    5       6                       V +z


      P *              Eye /         ^     /
         \                +)          \   /  Reflection
          \                \           \ v
    v0     \       v3           --------*--------
       *----\----*
      /      v /  \          .-.<--------        o
     /        o    \        ( / ) Refraction    / \
    /               \        '-'               /   \
v1 *-----------------* v2    |                o-----o
                             v
https://github.com/andre-dietrich/elm-svgbob
--{{0}}--
Since the dawn of mankind any type of media (stone, clay, wood, paper, vinyl, celluloid stripes, ...) could only be used for "passive" consumption of static content. Thus, you had to setup your environment accordingly to reproduce all of the results, the experiments ... at least in your imagination.
{{0}}

--{{1}}--
The invention of computers changed nearly nothing. We can access and create much more content than ever before, but this content is still mostly static. Of course, you can combine combine text, audio, and video, but what we could do, is to dive into the content, run simulations, play with forumlas and data, execute and manipulate code.
{{1}}

{{2}}
Further resources:
-
idyll: A toolkit for creating data-driven stories and explorable explanations.
-
Bret Victor - Media for Thinking the Unthinkable:
!?YouTube
-
Model-driven Authoring (What Can a Technologist Do About Climate Change?)
-
Nextjournal: Towards Model-Driven Authoring: What's Missing?
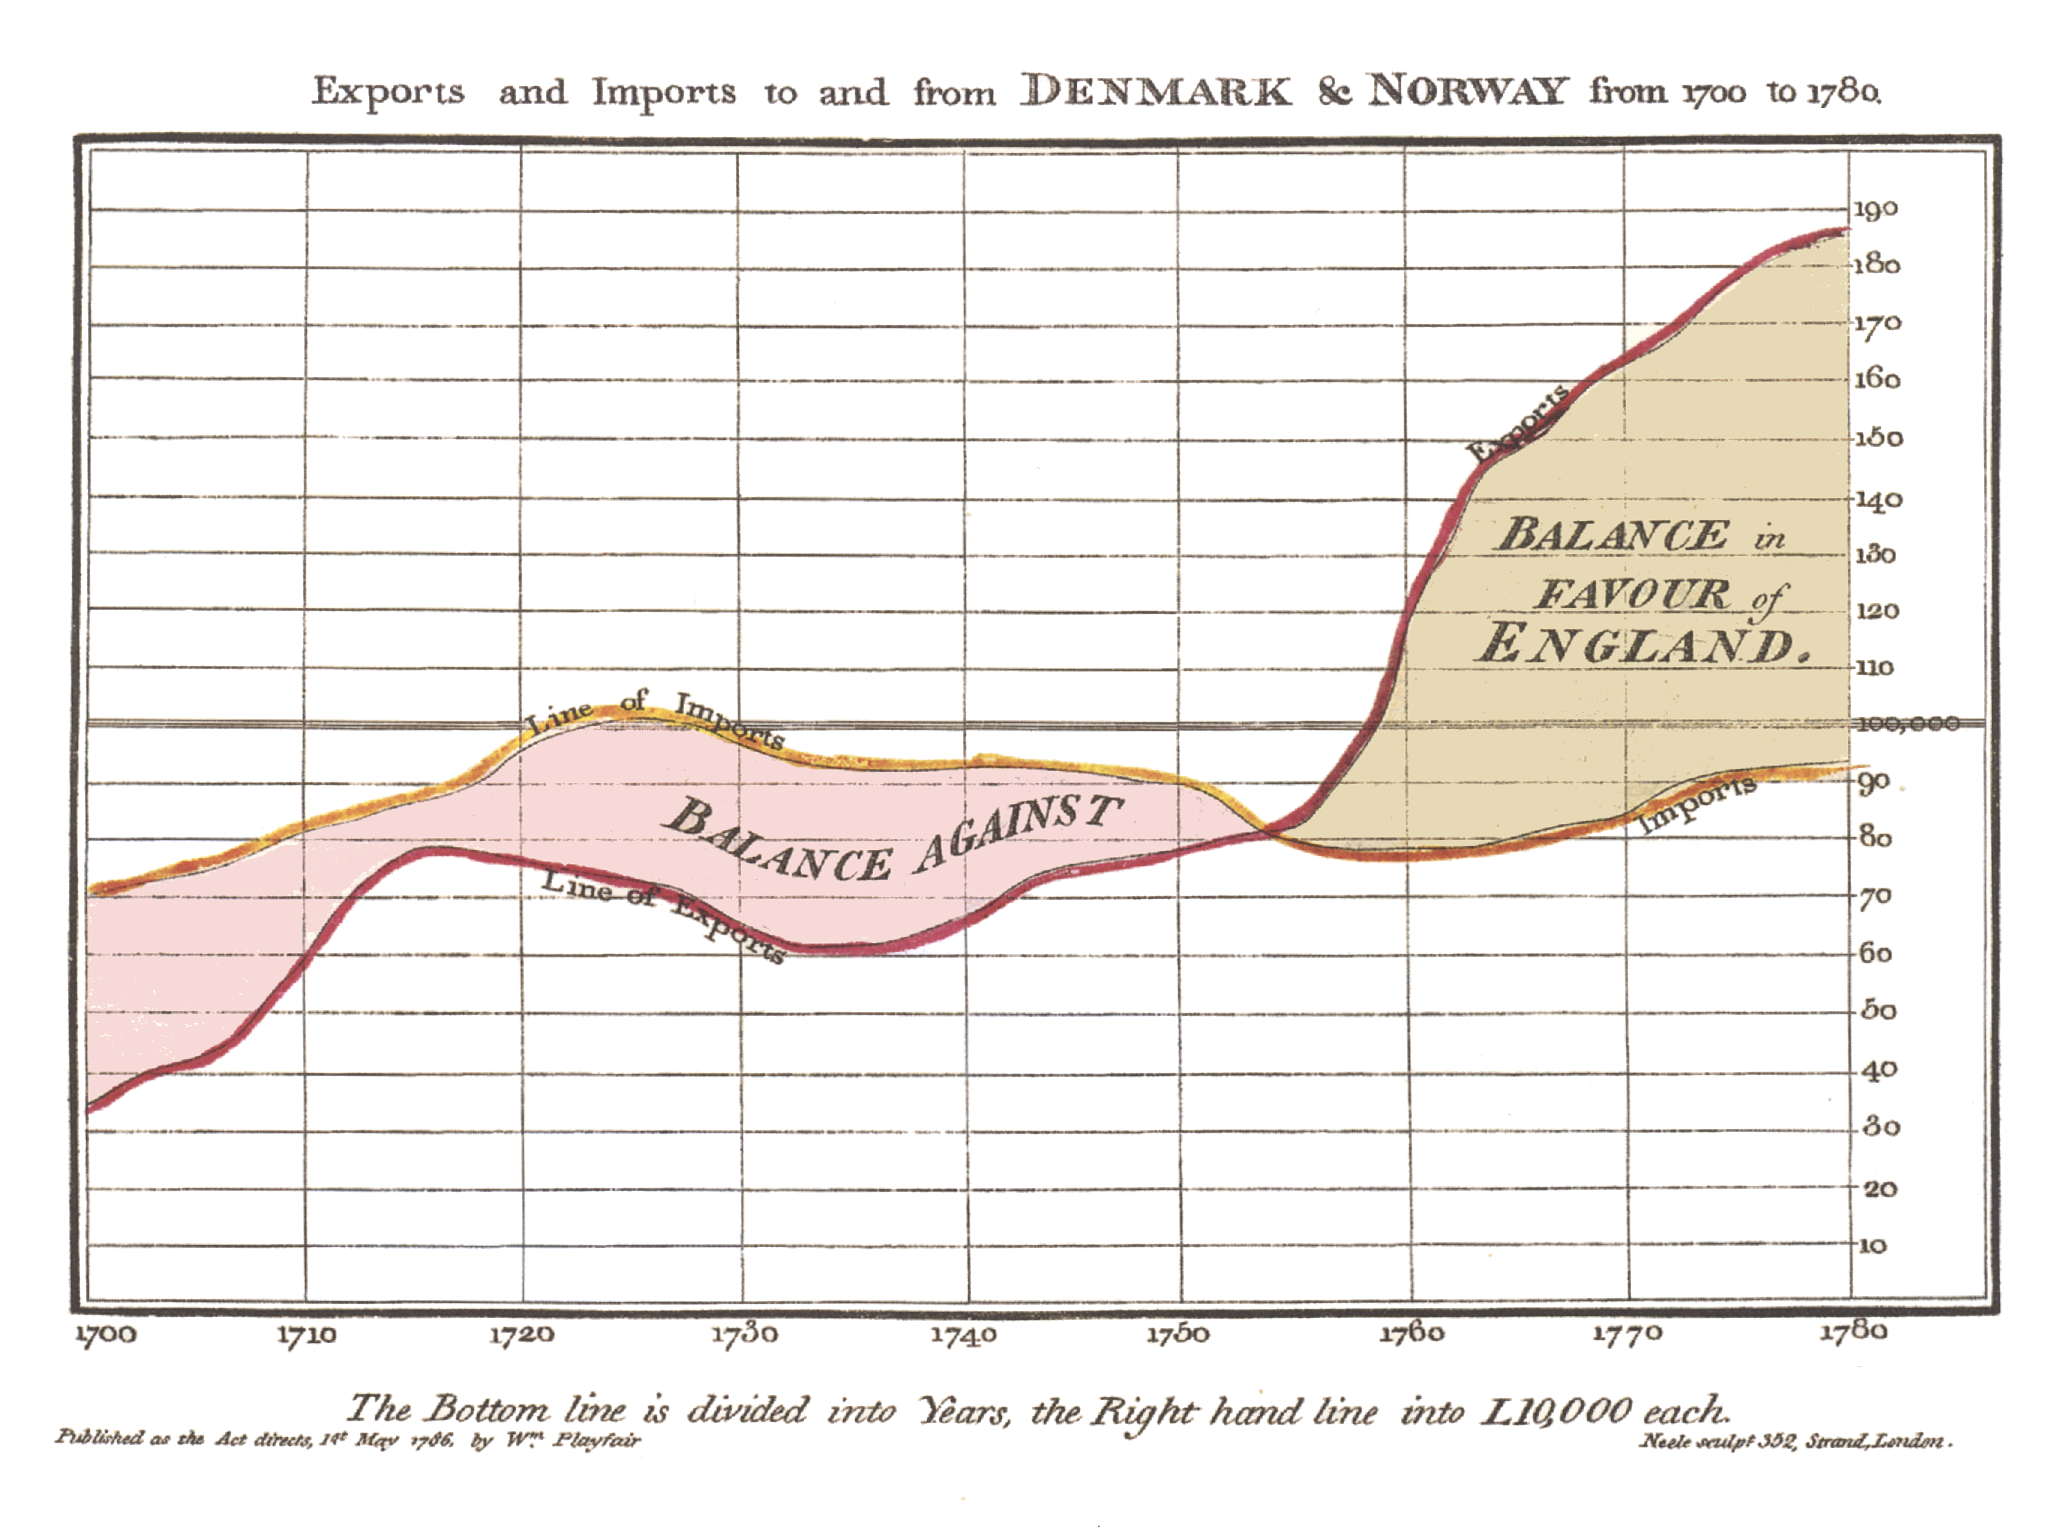
Did you know that William Playfair was the first who invented data graphics (cf. Wikipedia), although René Descates and Pierre de Fermat had invented Cartesian geometry roughly 250 years ealier. Before that time, all observed and measured data was presented in tables.
🎉 Thus, a table and a graph are basically two different respresentation of the same thing.
--{{0}}-- As you can see in the LiaScript interpreted version, tables can be sorted according to a column, either ascending or descending. But why stopping here? Every table also defines a dataset, right. So why not simply using it to directly plot graphs, scatter-plots, or bar-charts.
--{{1}}-- If the first column of a table contains only numbers, and the other columns contain some numbers, then these values can be directly plotted. The first column thus describes always the x values and the rest is up to you. Use the small icon above the table to switch between table view and plotted version.
| Year | Finland | USA | Germany | China |
|---|---|---|---|---|
| 1995 | 6.80942 | 4.42079 | 1.84192 | |
| 1996 | 6.86052 | 4.48319 | 1.85338 | |
| 1997 | ||||
| 1998 | 4.45345 | 1.84432 | ||
| 1999 | 5.86960 | 1.88803 | ||
| 2000 | 5.71687 | |||
| 2001 | 5.84797 | |||
| 2002 | 6.02477 | |||
| 2003 | 6.17476 | |||
| 2004 | 6.16849 | |||
| 2005 | 6.03605 | |||
| 2006 | 5.93809 | 4.27930 | ||
| 2007 | 5.68608 | 4.34302 | ||
| 2008 | 5.84676 | 4.40954 | ||
| 2009 | 6.48517 | 4.88047 | ||
| 2010 | 6.54070 | 5.42001 | 4.91368 | |
| 2011 | 6.48200 | 5.22389 | 4.80779 | |
| 2012 | 7.19254 | 5.19485 | 4.93331 | |
| 2013 | 7.15848 | 4.94378 | 4.93496 | |
| 2014 | 7.15155 | 4.98948 | 4.93112 |
Source https://ourworldindata.org/financing-education#all-charts-preview
--{{0}}--
A function cannot turn an x value into different y values, thus, if you have at least one x value twice, the resulting plot will be a scatter plot. By the way, only the first word in a cell (separated by spaces) gets interpreted as a number. If you don't want this to happen for a certain cell, then simply attach something directly to the number, add a character in front of it or use the math notation.
| Random | I | II |
|---|---|---|
| 5.0 | 1.0 | 5 |
| 6.0 | 1.0 | 4 |
| 7.0 | 1.0 | 5 |
| 8.0 | 1.0 | 5 |
| 9.0 | 1.0 | 4 |
| 10.0 | 1.0 | 5 |
| 5.0 | 10.0 | 7 |
| 6.0 | 10.0 | 8 |
| 7.0 | 10.0 | 7 |
| 8.0 | 10.0 | 7 |
| 9.0 | 10.0 | 8 |
| 10.0 | 10.0 | 7 |
--{{0}}--
If you have a ScatterPlot like representation, but actually want to use this data as primary data for your BoxPlot, you can manually change the type of visualization to BoxPlot, simply by adding the follwing attribute to the head of your table, as it is shown in the snippet below. Columns are then treated as datasets and get visualized accordingly.
| Random | I | II |
|---|---|---|
| 5.0 | 1.0 | 5 |
| 6.0 | 1.0 | 4 |
| 7.0 | 1.0 | 5 |
| 8.0 | 1.0 | 5 |
| 9.0 | 1.0 | 4 |
| 10.0 | 1.0 | 5 |
| 5.0 | 10.0 | 7 |
| 6.0 | 10.0 | 8 |
| 7.0 | 10.0 | 7 |
| 8.0 | 10.0 | 7 |
| 9.0 | 10.0 | 8 |
| 10.0 | 10.0 | 7 |
| 1 |
--{{0}}--
In contrast to a line or a scatter plot, if the first colum contains at least one entry thant cannot be parsed as a number, this might be represented also as BarChart. Which works perfectly with the following example. If the maximum values of the columns do not differ to much, then this dataset it represented as a BarChart, otherwise you might end up seeing only one huge bar, while the other bars are indistiguishable from each other. In this case other visualization are chosen.
| Animal | weight in kg | Lifespan years | Mitogen |
|---|---|---|---|
| Mouse | 0.028 | 2 | 95 |
| Flying squirrel | 0.085 | 15 | 50 |
| Brown bat | 0.020 | 30 | 10 |
| Sheep | 90 | 12 | 95 |
| Human | 68 | 70 | 10 |
--{{0}}--
If for example humans and sheeps are removed from the dataset, then wheight in kg would not be visible in a BarChart at all. In this case a Radar is selected, that allows to analyze data visually with different "y"-axis.
| Animal | weight in kg | Lifespan years | Mitogen |
|---|---|---|---|
| Mouse | 0.028 | 02 | 95 |
| Flying squirrel | 0.085 | 15 | 50 |
| Brown bat | 0.020 | 30 | 10 |
--{{0}}--
If you have a table with only one row full of numbers, this will be automatically presented as an pie chart. The head represents the categories and the body the quatities.
| Classic | Country | Reggae | Hip-Hop | Hard-Rock | Samba |
|---|---|---|---|---|---|
| 50 | 50 | 100 | 200 | 350 | 250 |
--{{1}}--
You can use the first column to give some more information about your data. If the first element of the list body contains a text, that cannot be directly interpreted as a number, then these two text snippets are used to the define the main title and the subtitle of your chart.
{{1}}
| Music-Style 1994 | Classic | Country | Reggae | Hip-Hop | Hard-Rock | Samba |
|---|---|---|---|---|---|---|
| Student rating | 50 | 50 | 100 | 200 | 350 | 250 |
--{{0}}--
The default behavior for the Table below, would be to represent it as a bar-chart.
But, you can enforce the usage of pie charts, simply by adding the attribute
piechart into the HTML comment, directly above the table:
{{0-1}}
| Music-Style | Classic | Country | Reggae | Hip-Hop | Hard-Rock | Samba |
|---|---|---|---|---|---|---|
| 1994 | 50 | 50 | 100 | 200 | 350 | 250 |
| 2014 | 20 | 30 | 100 | 220 | 400 | 230 |
| demo 2034 | 5 | 12 | 98 | 293 | 345 | 32 |
--{{1}}--
Since data is parsed at runtime, you can also use animations to change the values of chart, while go on in your slide or move back. But keep in mind, that this might lead to negative effects, if your audience preferes the textbook mode:
{{1-3}}
| Music-Style {0-1}{1994} {1}{2014} | Classic | Country | Reggae | Hip-Hop | Hard-Rock | Samba |
|---|---|---|---|---|---|---|
| Student rating | {1-2}{50} {2}{20} | {1-2}{50} {2}{30} | 100 | {1-2}{200} {2}{220} | {1-2}{350} {2}{400} | {1-2}{250} {2}{230} |
--{{3}}--
If the upper table might be too long and you prefer to use only two columns and
grow your data vertically, then you can use the attribute data-transpose,
which flips mirrows your data along an imaginary vertical axis.
{{3}}
| Music-Style {3-4}{1994} {4}{2014} | Student rating |
|---|---|
| Classic | {3-4}{50} {4}{20} |
| Country | {3-4}{50} {4}{30} |
| Reggae | 100 |
| Hip-Hop | {3-4}{200} {4}{220} |
| Hard-Rock | {3-4}{350} {4}{400} |
| Samba | {3-4}{250} {4}{230} |
--{{0}}--
Funnel is a similar representation as PieChart, but it is not set automatically.
If you want to use funnel, you will have to set the data-type parameter to
funnel.
| Music-Style {0-1}{1994} {1}{2014} | Student rating |
|---|---|
| Classic | {0-1}{50} {1}{20} |
| Country | {0-1}{50} {1}{30} |
| Reggae | 100 |
| Hip-Hop | {0-1}{200} {1}{220} |
| Hard-Rock | {0-1}{350} {1}{400} |
| Samba | {0-1}{250} {1}{230} |
--{{0}}--
A map is similar to a BarChart from the table structure, but if you want to depict your data on a real map, you will have to add a geojson-file, that contains all relevant data about the form of your countries, states, cities, etc. The first column has to match the names of your objects in your geojson data, that is attached to your table in the following way:
| Country | percent |
|---|---|
| Albania | 73.5 |
| Andorra | 98.9 |
| Armenia | 72.4 |
| Austria | 87.9 |
| Azerbaijan | 79.8 |
| Belarus | 79.7 |
| Belgium | 93.9 |
| Bosnia and Herzegovina | 80.8 |
| Bulgaria | 66.7 |
| Croatia | 91.5 |
| Cyprus | 84.4 |
| Czech Republic | 87.7 |
| Denmark | 97.8 |
| Estonia | 97.9 |
| Finland | 94.0 |
| France | 92.3 |
| Georgia | 68.1 |
| Germany | 96.0 |
| Greece | 72.9 |
| Hungary | 89.0 |
| Iceland | 99.0 |
| Ireland | 91.9 |
| Italy | 92.5 |
| Latvia | 87.1 |
| Liechtenstein | 98.1 |
| Lithuania | 90.9 |
| Luxembourg | 97.8 |
| Macedonia | 79.2 |
| Malta | 83.1 |
| Moldova | 76.1 |
| Monaco | 97.5 |
| Montenegro | 71.5 |
| Netherlands | 95.6 |
| Norway | 98.4 |
| Poland | 78.2 |
| Portugal | 78.2 |
| Republic of Serbia | 73.4 |
| Romania | 73.8 |
| Russia | 80.9 |
| San Marino | 60.2 |
| Slovakia | 84.9 |
| Slovenia | 79.9 |
| Spain | 92.5 |
| Sweden | 96.4 |
| Switzerland | 93.7 |
| Turkey | 83.3 |
| Ukraine | 93.4 |
| United Kingdom | 94.9 |
| Vatican City | 60.1 |
Currently there is only support to visualize one column, but this will be fixed in the future ...
--{{0}}--
Another type of visualization is a HeatMap, which is used, if the table head and
the first column do only contain numbers, in other words coordinates. If you
want to use categories instead of coordinate numbers, you can enforce the usage
of a heatmap, with the comment shown below. The attribute data-show simply
shows the diagram at default, instead of using the table.
| Seattle tmp. | Jan | Feb | Mar | Apr | May | Jun | Jul | Aug | Sep | Oct | Nov | Dec |
|---|---|---|---|---|---|---|---|---|---|---|---|---|
| 0 | 40.7 | 41.5 | 43.6 | 46.6 | 51.4 | 56.0 | 60.5 | 61.2 | 57.0 | 50.1 | 44.1 | 39.6 |
| 2 | 40.2 | 40.7 | 42.7 | 45.3 | 50.0 | 54.4 | 58.5 | 59.2 | 55.4 | 49.2 | 43.5 | 39.3 |
| 4 | 39.7 | 40.0 | 41.9 | 44.4 | 48.9 | 53.2 | 57.0 | 57.7 | 54.2 | 48.6 | 43.1 | 38.9 |
| 6 | 39.6 | 39.5 | 41.3 | 44.2 | 49.5 | 54.2 | 57.8 | 57.4 | 53.6 | 48.2 | 42.8 | 38.7 |
| 8 | 39.6 | 39.9 | 42.9 | 47.1 | 52.7 | 57.3 | 61.3 | 61.1 | 56.7 | 49.5 | 43.1 | 38.7 |
| 10 | 41.3 | 42.7 | 46.4 | 50.7 | 56.4 | 60.9 | 65.2 | 65.4 | 60.9 | 52.8 | 45.5 | 40.4 |
| 12 | 43.8 | 46.0 | 49.5 | 53.8 | 59.6 | 64.3 | 69.4 | 69.8 | 65.1 | 56.0 | 47.8 | 42.6 |
| 14 | 45.1 | 47.7 | 51.3 | 55.9 | 61.9 | 66.9 | 72.6 | 73.2 | 67.7 | 57.8 | 48.8 | 43.6 |
| 16 | 44.5 | 47.5 | 51.4 | 55.9 | 62.3 | 67.5 | 73.9 | 74.3 | 68.2 | 57.4 | 47.8 | 42.6 |
| 18 | 42.6 | 44.7 | 48.7 | 53.8 | 60.3 | 65.9 | 72.3 | 72.2 | 64.6 | 53.9 | 46.0 | 41.2 |
| 20 | 42.0 | 43.3 | 46.4 | 50.2 | 56.0 | 61.4 | 66.9 | 66.6 | 60.7 | 52.3 | 45.2 | 40.7 |
| 22 | 41.4 | 42.5 | 45.0 | 48.3 | 53.5 | 58.2 | 63.2 | 63.5 | 58.7 | 51.1 | 44.5 | 40.1 |
https://datavizpyr.com/heatmaps-with-seaborn-in-python/
A Parallel representation jumps in, if there are simply too many categories, so that your BarChart would contain only thin lines.
| Country | GDP growth (%) | Births per woman | Life expectancy at birth (years) | Population ages >= 65 (%) | Pop. ages 15-64 (%) | Pop ages 0-14 (%) | Pop (total) |
|---|---|---|---|---|---|---|---|
| Albania | 7.5 | 1.858 | 76.6337073170732 | 9.3330694913874 | 66.4522208535245 | 24.2147096550882 | 3143291 |
| Andorra | 3.57073718591123 | 1.260 | NaN | NaN | NaN | NaN | 83810.5 |
| Austria | 2.17880778069679 | 1.414 | 80.4475609756098 | 17.0078802490015 | 67.7942859199021 | 15.1978338310964 | 8336926 |
| Byelarus | 11.29603925282670 | 1.420 | 70.6328780487805 | 13.8161084682917 | 71.3440867491758 | 14.8398047825325 | 9680850 |
| Belgium | 1.00416891576425 | 1.820 | 80.1095609756098 | 17.2425951179457 | 65.9073170003941 | 16.8500878816601 | 10708433 |
| Bosnia and Herzegovina | 5.41999999999929 | 1.209 | 75.1063170731708 | 13.7875788575916 | 70.5586044787057 | 15.6538166637027 | 3773100 |
| Bulgaria | 6.21712220063873 | 1.478 | 73.3165853658537 | 17.3328904412356 | 69.2610054713067 | 13.4061040874577 | 7623395 |
| Channel Islands | NaN | NaN | NaN | NaN | NaN | NaN | NaN |
| Croatia | 2.35925308110710 | 1.470 | 75.9121951219512 | 17.1754953634927 | 67.5174504975681 | 15.3070541389392 | 4434000 |
| Czech Republic | 2.46366103329814 | 1.497 | 77.2112195121951 | 14.6644147081870 | 71.1889763214880 | 14.1466089703250 | 10424336 |
| Denmark | -0.86969912719333 | 1.892 | 78.7004878048781 | 15.9364325701275 | 65.6692750948847 | 18.3942923349878 | 5493621 |
| Estonia | -5.12891873578752 | 1.661 | 73.9731707317073 | 16.9573479430650 | 68.0747344729978 | 14.9679175839372 | 1340675 |
| Faroe Islands | NaN | NaN | NaN | NaN | NaN | NaN | 48511 |
| Finland | 0.92209645431238 | 1.846 | 79.7919512195122 | 16.5283868561977 | 66.6427434111131 | 16.8288697326892 | 5313399 |
| France | 0.21695181782435 | 1.998 | 81.5204878048781 | 16.6134150592142 | 64.9880225189894 | 18.3985624217964 | 62277432 |
| Germany | 0.98801573506542 | 1.376 | 80.0885365853659 | 19.9652972040776 | 66.3351760329956 | 13.6995267629268 | 82110097 |
| Greece | 2.01498162894308 | 1.506 | 79.9631707317073 | 18.1870521529388 | 67.5883962990861 | 14.2245515479751 | 11237094 |
| Hungary | 0.59999999999994 | 1.352 | 74.0090243902439 | 16.0592099507043 | 68.9813743902960 | 14.9594156589996 | 10038188 |
| Iceland | 0.95512219949856 | 2.140 | 81.5751219512195 | 11.6851788453979 | 67.3938402627208 | 20.9209808918813 | 317414 |
| Ireland | -3.03575424255612 | 2.100 | 79.8568292682927 | 11.1093456408398 | 68.3358023622894 | 20.5548519968708 | 4425675 |
| Isle of Man | NaN | NaN | NaN | NaN | NaN | NaN | NaN |
| Italy | -1.31844836660481 | 1.414 | 81.9452097560976 | 20.0909973618083 | 65.7289363852644 | 14.1800662529273 | 59832179 |
| Kosovo | NaN | NaN | NaN | NaN | NaN | NaN | NaN |
| Latvia | -4.55213597961080 | 1.453 | 72.2382926829268 | 17.1863911389844 | 69.0425815911418 | 13.7710272698738 | 2266094 |
| Liechtenstein | 1.79808929851180 | 1.400 | 82.6341463414634 | NaN | NaN | NaN | 35629 |
| Lithuania | 2.76144078921502 | 1.470 | 71.8217073170732 | 15.9677094440150 | 68.7509466357882 | 15.2813439201968 | 3358115 |
| Luxembourg | 0.03220273485962 | 1.605 | 80.5246341463415 | 14.0365040657173 | 67.9773784654310 | 17.9861174688517 | 488650 |
| Macedonia | 4.80000000000011 | 1.438 | 74.2113170731707 | 11.5845850425847 | 69.9825898844976 | 18.4328250729177 | 2041342 |
| Malta | NaN | NaN | NaN | NaN | NaN | NaN | NaN |
| Moldova | 7.76484641287229 | 1.495 | 68.4371463414634 | 11.1369548727738 | 71.6754849214449 | 17.1875602057813 | 3633369 |
| Monaco | NaN | NaN | NaN | NaN | NaN | NaN | NaN |
| Republic of Montenegro | NaN | NaN | NaN | NaN | NaN | NaN | NaN |
| Netherlands | 1.99580842581707 | 1.775 | 80.4007317073171 | 14.7235949405444 | 67.3305328508120 | 17.9458722086436 | 16445593 |
| Norway | 1.81507058553292 | 1.960 | 80.7414634146342 | 14.6455888097593 | 66.2064766744808 | 19.1479345157599 | 4768212 |
| Poland | 5.00408460108383 | 1.390 | 75.5331707317073 | 13.3256480555872 | 71.4634305149354 | 15.2109214294774 | 38125759 |
| Portugal | -0.03467455605676 | 1.374 | 79.2497560975610 | 17.5012814880078 | 67.1365409199047 | 15.3621775920875 | 10622413 |
| San Marino | NaN | NaN | NaN | NaN | NaN | NaN | NaN |
| Serbia | 5.51795169957776 | 1.400 | 73.6365853658537 | 14.5167655385706 | 67.6335858157006 | 17.8496486457288 | 7350221 |
| Slovakia | 6.17046824289093 | 1.320 | 74.8107317073171 | 11.9677699353106 | 72.3868259638361 | 15.6454041008533 | 5406626 |
| Slovenia | 3.49251997044142 | 1.528 | 78.9739024390244 | 16.0267556735963 | 70.1117152095851 | 13.8615291168186 | 2021316 |
| Spain | 0.85776978982683 | 1.461 | 81.0880487804878 | 16.9394050582152 | 68.3398363315641 | 14.7207586102207 | 45555716 |
| Sweden | -0.40879886604371 | 1.910 | 81.2371707317073 | 17.7223651519496 | 65.5617228818501 | 16.7159119662004 | 9219637 |
| Switzerland | 1.89715399119828 | 1.480 | 82.1617073170732 | 16.6721873799941 | 67.8197089730996 | 15.5081036469063 | 7647675 |
| Ukraine | 2.09999999999999 | 1.390 | 68.2514634146342 | 15.9037623084261 | 70.1546462864768 | 13.9415914050970 | 46258200 |
| United Kingdom | 0.54791121956627 | 1.940 | 79.9033658536585 | 16.3019124620612 | 66.1561282590033 | 17.5419592789355 | 61406928 |
| Montenegro | 6.89999999999999 | 1.642 | 74.0975365853659 | 12.8497239486590 | 67.5957824239814 | 19.5544936273596 | 622344 |
| Isle of Man | NaN | NaN | NaN | NaN | NaN | NaN | 80543 |
| Romania | 9.42580218461200 | 1.350 | 73.3734146341464 | 14.8579664297396 | 69.8993946432444 | 15.2426389270160 | 21513622 |
--{{0}}--
If the first column and the head of the table are equal, then the interpreter tries to interpret the content of the table as an adjacency matrix, which defines a graph. If those values are symetrical according to the diagonal, then the matrix defines an undirected graph.
{{0-1}}
| Graph | A | B | C | D | E |
|---|---|---|---|---|---|
| A | 0 | 1 | 0 | 1 | 0 |
| B | 1 | 0 | 0 | 1 | 0 |
| C | 0 | 0 | 0 | 0 | 0 |
| D | 1 | 1 | 0 | 0 | 1 |
| E | 0 | 0 | 0 | 1 | 0 |
--{{1}}--
In contrast to this, if those values differ, then the result is simply an an directed graph, whereby the values define the strength of the line.
{{1}}
| Graph | A | B | C | D | E |
|---|---|---|---|---|---|
| A | 0 | 12 | 0 | 1 | 0 |
| B | -22 | 0 | 0 | 0.4 | 0 |
| C | 0 | 0 | 0 | 0 | 0 |
| D | 2 | 12 | 0 | 0 | 1 |
| E | 0 | 0 | 0 | 2 | 0 |
{{1}}
Unfortunatelly, self referenceing or multigraphs are currently not supported.
--{{0}}--
A Sankey diagram is a special type of directed graph that can be used to streams or the flow of something, such as engergy, money, etc.
| Sankey | A | B | C | D | E |
|---|---|---|---|---|---|
| A | 2 | ||||
| B | 3 | ||||
| C | 1 | 1 | |||
| D | 1 | 1 | |||
| E | 2 | 1 | 1 | 1 |
--{{0}}--
Simply data-type="none" to prevent any kind of visualization.
| Sankey | A | B | C | D | E |
|---|---|---|---|---|---|
| A | 2 | ||||
| B | 3 | ||||
| C | 1 | 1 | |||
| D | 1 | 1 | |||
| E | 2 | 1 | 1 | 1 |
{{0-1}}
var s = "JavaScript syntax highlighting";
alert(s);
s;{{1}}
let who = data.first_name + " " + data.last_name;

if(data.online) {
  who + " is online"; }
else {
  who + " is NOT online"; }
{
"first_name" : "Sammy",
"last_name" : "Shark",
"online" : true
}LiaScript-Macros provide an easy text-substitution mechanism, which add additional functionality while hiding repetive tasks while preserving the readability of a document.
<!--
@author: André Dietrich & Sebastian Zug

import:  https://some-other-course-url.md
script:  https://some-external-javascript.js
link:    https://some-external-styling.css
-->

# Main Title
<!--
author:  jet another author

bold: **@0**
-->

@bold(some text)
@bold(some text) from @bold(@author)
-
Macros are indicated with an
@sign -
Global Macros (& settings): are defined within the initial HTML comment at the beginning of every document.
-
local macros: are defined at the beginning of every section.
-
Macros can be shared across documents and allow to use external:
- macros via
import: - JavaScript libraries via
script: - Style-Sheets via
link:
- macros via
Global Template repository: https://github.com/LiaTemplates
Source: https://github.com/LiaTemplates/VTK
@VTK.loadIframe(https://kitware.github.io/vtk-js-datasets/data/vti/head-binary-zlib.vti)
source: https://github.com/LiaTemplates/AVR8js
byte leds[] = {13, 12, 11, 10,9};
void setup() {
  Serial.begin(115200);
  for (byte i = 0; i < sizeof(leds); i++) {
    pinMode(leds[i], OUTPUT);
  }
}

int i = 0;
void loop() {
  Serial.print("LED: ");
  Serial.println(i);
  digitalWrite(leds[i], HIGH);
  delay(250);
  digitalWrite(leds[i], LOW);
  i = (i + 1) % sizeof(leds);
}
@AVR8js.sketch(example)
A quadratic function
where
For the parameters @param(a,1), @param(b,0), and @param(c,0), the quadratic formula is defined as follows:
$ f(x) = @input(`a`)x^2 + @input(`b`)x + @input(`c`) $
<script run-once style="display: inline-block; width: 100%">
function func(x) {
    x /= 10

    return @input(`a`) * x * x +
           @input(`b`) * x +
           @input(`c`)
}

function generateData() {
    let data = [];

    for (let i = -60; i <= 60; i += 0.1) {
        data.push([i, func(i)]);
    }
    return data;
}

let option = {
    animation: false,
    xAxis: {
        name: 'x',
        minorTick: {
            show: true
        },
        min: -80,
        max: 80,
    },
    yAxis: {
        name: 'y',
        minorTick: {
            show: true
        },
        min: -20,
        max: 50,
    },
    dataZoom: [{
        show: true,
        type: 'inside',
        filterMode: 'none',
        xAxisIndex: [0],
    }, {
        show: true,
        type: 'inside',
        filterMode: 'none',
        yAxisIndex: [0],
    }],
    series: [
        {
            type: 'line',
            showSymbol: false,
            clip: true,
            data: generateData()
        }
    ]
}

"HTML: <lia-chart option='" + JSON.stringify(option) + "'></lia-chart>"
</script>
It's Sophia's birthday. She wants to go to the swimming pool with her friends, pay for every child the entry @euro(ticket,2) and buy an ice cream @euro(ice,1.5). How many friends can she invite if her mother gives her @euro(mom,25)?
[[7]]
<script> Math.abs(@input - (@input(`mom`) / (@input(`ticket`) + @input(`ice`)))) < 1 </script>Sophia can invite roughly
<script>Math.floor( @input(`mom`)/(@input(`ticket`)+@input(`ice`)))</script>of her friends.
Your resulting calculation should look like the following one:
<script style="display:block"> let mom = @input(`mom`); let ticket = @input(`ticket`); let ice = @input(`ice`); `LIASCRIPT: $$ ${Math.floor(mom/(ticket+ice))} \\approx \\frac{${mom}}{${ticket} + ${ice}} $$` </script>