Data Visualization Projects
From the Open Data NYC Porta l
Link to One of Many Medium Articles
Covid Cases in NYC in the First Half of March 2020

Critical and non-critical routes for snow plowing priority by the Department of Sanitation.

Census data from 2010.

Population by numbers of days in a week that trash is picked up.

Motor Vehicle Death in a 6-month Span

NYC Building Number of Floors by ZipCode Population Count

NYC Building Number of Floors by ZipCode Population Count Recolored

ZipCode Outline with Location Overlay

Building Permits and Roads Austin Metro Area

Transit Stops Austin Metro Area

Transit Services and Bus Routes Austin Metro Area

Population by Census Neighborhood Tabulation Area 2020 and Truck Routes

NYC Building Number of Floors by Location in Mid-to-Lower Manhattan

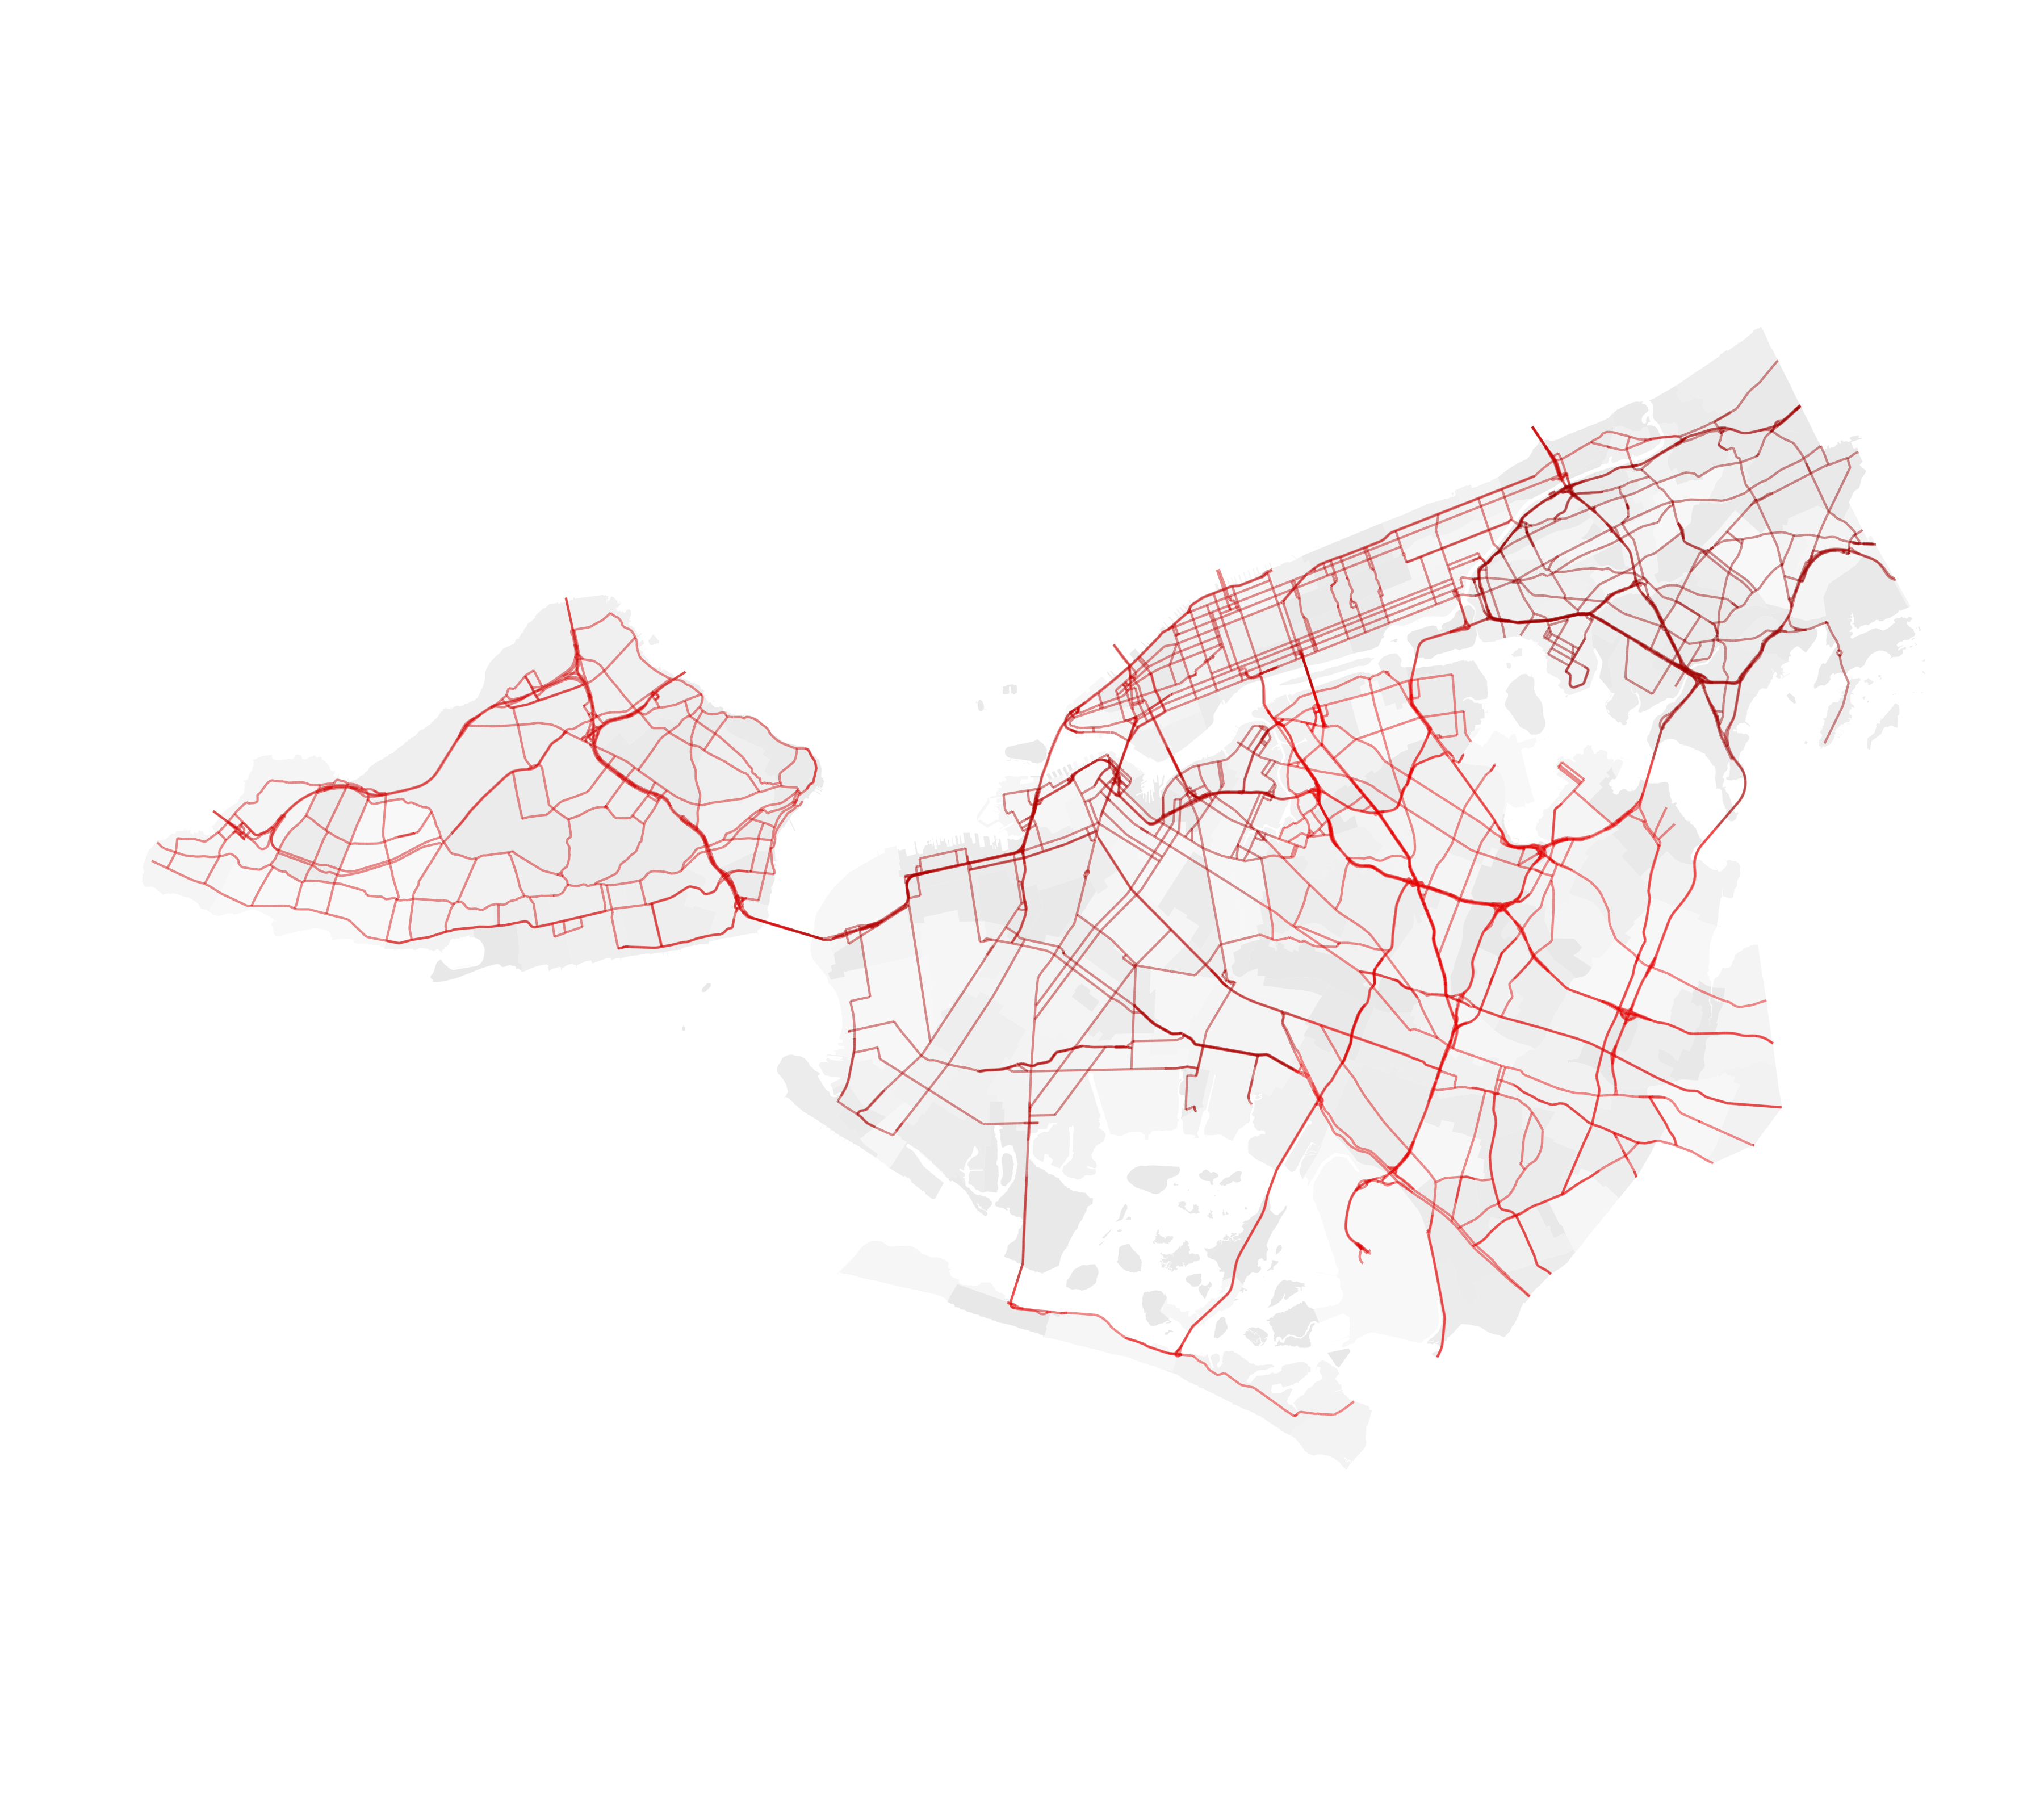
Major Roads in NYC - Truck Routes Dataset from NYC Open Data Portal


Equal Area Projection

Equal Distance Projection

Routes using Contextily Base Maps

New York State Counties and towns
