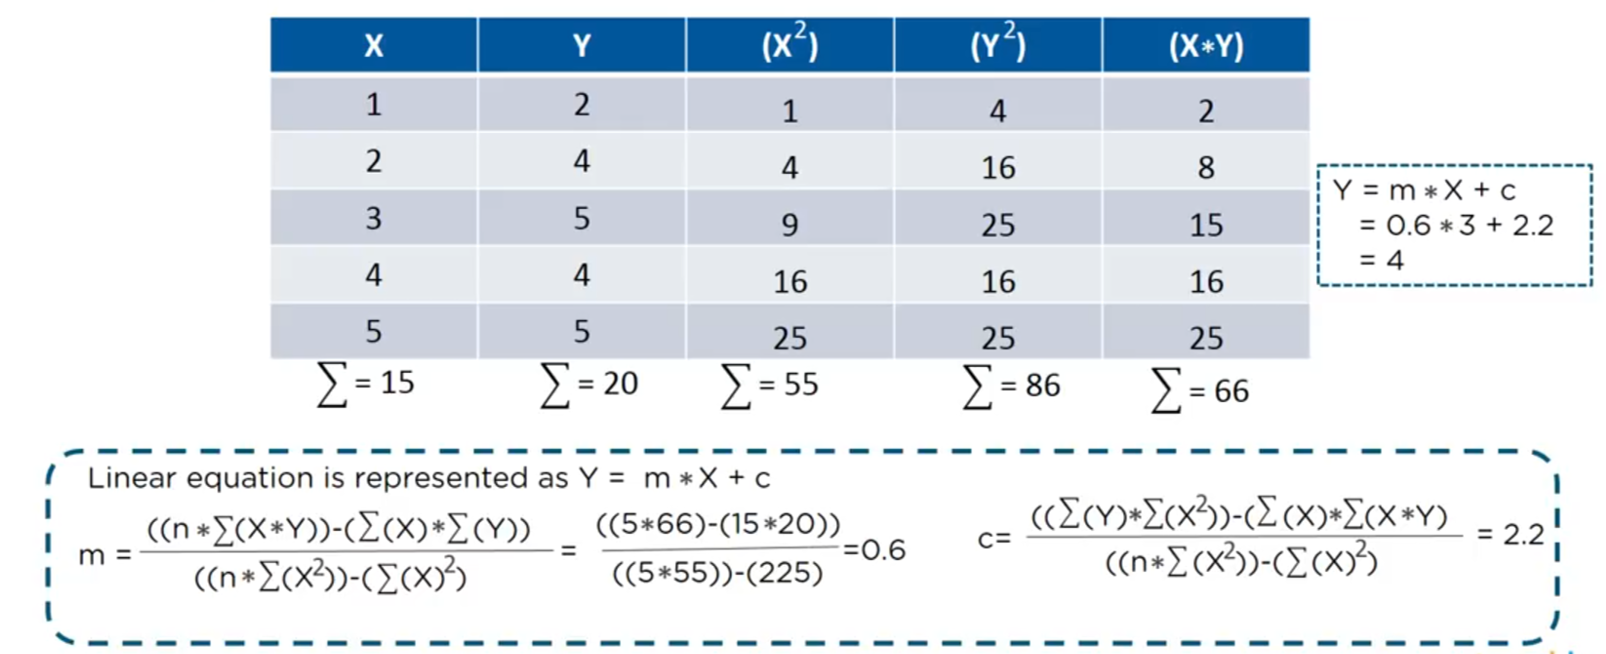
In statistics, linear regression is a linear approach to modelling the relationship between a scalar response (or dependent variable) and one or more explanatory variables (or independent variables). Here is the basic formula of linear regression, especially on how to solve the value of m (slope) & b (intercept) of the best fit line:
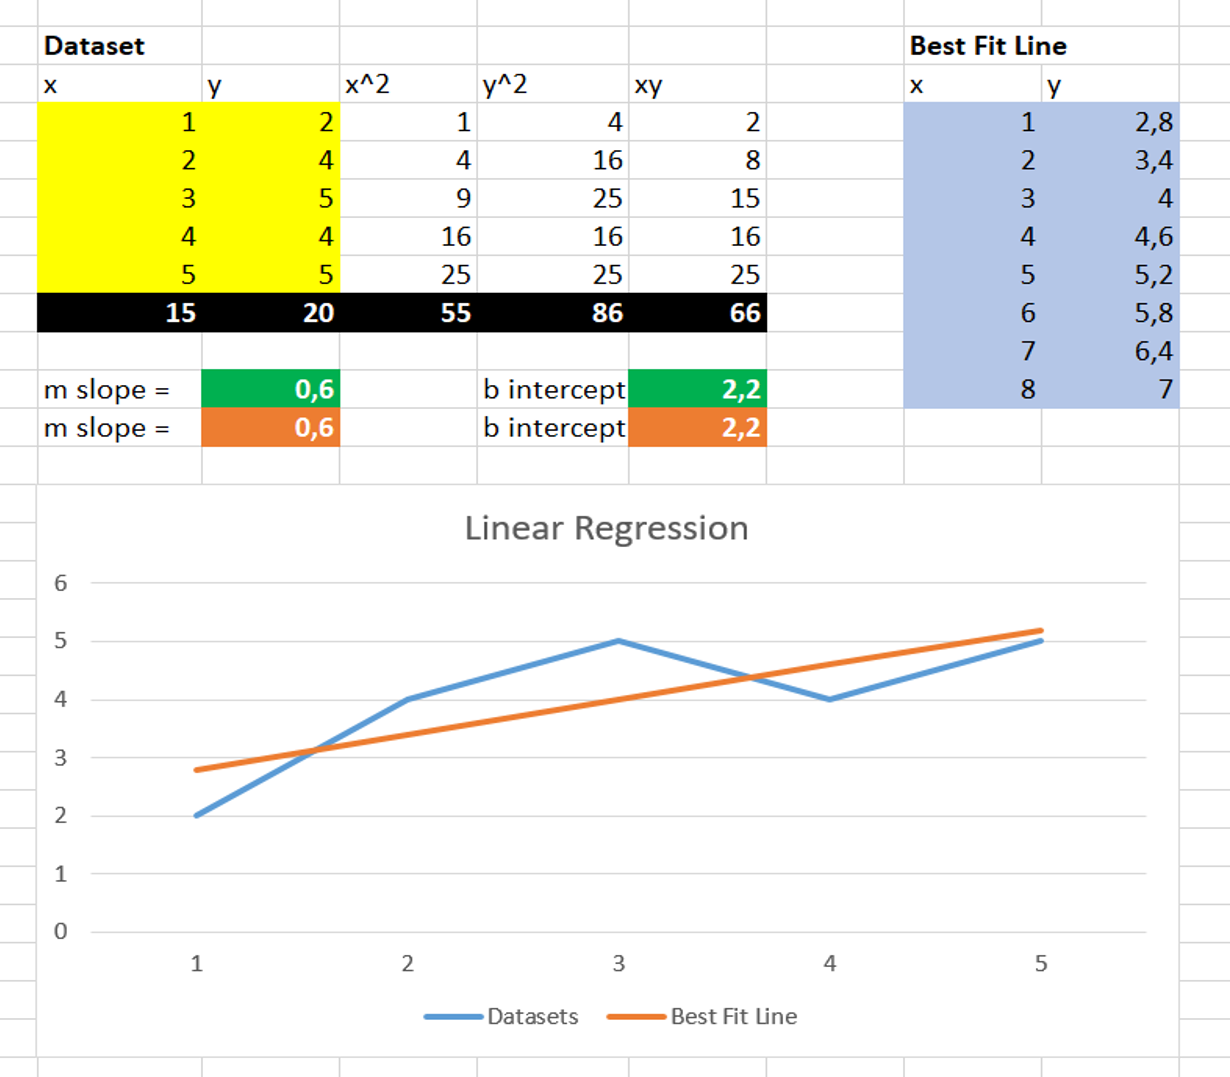
Here is the example of linear regression using Microsoft Excel. Clone/download this repo & open file: 0_basic_regression.xlsx:
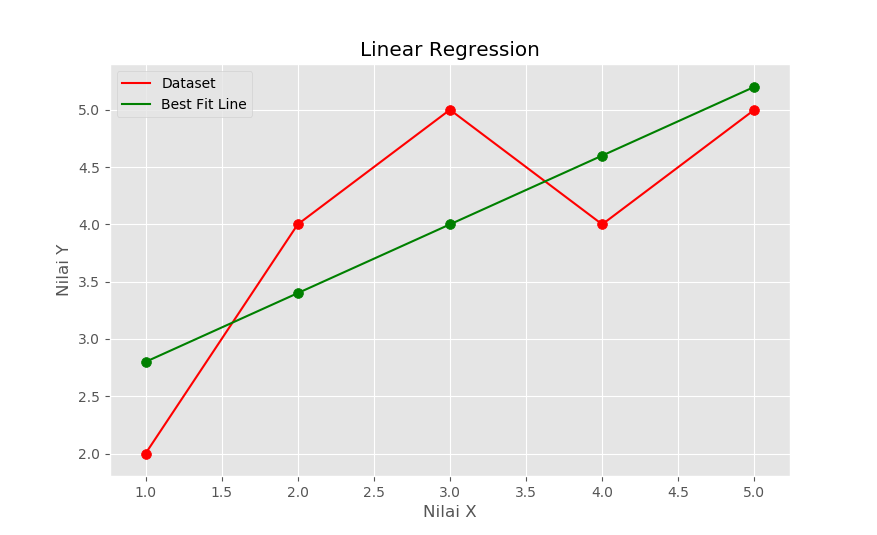
Clone/download this repo, open & run python script: 0_linearReg_without_sklearn.py. It will create a plot figure of dataset with its best fit line. Make sure you have installed pandas, numpy, matplotlib & sklearn packages!
import numpy as np
import pandas as pd
import matplotlib.pyplot as plt

# data
x = [1, 2, 3, 4, 5, 6, 7, 8, 9, 10]
y = [2, 3, 4, 5, 4, 6, 5, 7, 7, 8]

# create dataframe
df = pd.DataFrame({
    'x': np.array(x),
    'y': np.array(y),
    'x2': np.array(x) ** 2,
    'y2': np.array(y) ** 2,
    'xy': np.array(x) * np.array(y)
})

# sum x, sum y, sum x^2, sum y^2, sum xy
sumx = df.sum(axis=0)[0]
sumy = df.sum(axis=0)[1]
sumx2 = df.sum(axis=0)[2]
sumy2 = df.sum(axis=0)[3]
sumxy = df.sum(axis=0)[4]
print(sumx, sumy, sumx2, sumy2, sumxy)

# slope / gradient
m = ((len(x)*sumxy)-(sumx*sumy))/((len(x)*sumx2)-(sumx**2))
print(m)

# intercept
c = ((sumy*sumx2)-(sumx*sumxy))/((len(x)*sumx2)-(sumx**2))
print(c)

# y best fit line (y = mx + c)
df['yBest'] = m * np.array(x) + c
print(df)

# predict x = 200 so y - ???
print(m*200 + c)

# plotting
plt.plot(
    df['x'], df['y'], 'g-',
    df['x'], df['yBest'], 'r-'
)
plt.grid(True)
plt.show()Clone/download this repo, open & run python script: 2_plot_bestFitLine.py. It will create a plot figure of dataset with its best fit line. Make sure you have installed pandas, numpy, matplotlib & sklearn packages!
import pandas as pd
import numpy as np
import matplotlib.pyplot as plt
plt.style.use('ggplot')

# ================================
# create dataframe

x = np.array([1, 2, 3, 4, 5])
y = np.array([2, 4, 5, 4, 5])
df = pd.DataFrame({
    'x': x,
    'y': y
})
print(df)

# ================================
# linear regression

from sklearn import linear_model
model = linear_model.LinearRegression()

# training w/ dataset: mode.fit(dataIndependent[2D], dataDependent[1D])
model.fit(df[['x']], df['y'])

# show m(gradient/slope) & b(intercept) of 'best fit line'
print('Slope = ', model.coef_)
print('Intercept = ', model.intercept_)

# prediction
print(model.predict([[8]]))

# ================================

# plot dataframe
plt.plot(df['x'], df['y'], 'r-')

# plot best fit line
plt.plot(df['x'], model.predict(df[['x']]), 'g-')

# scatter dataframe
plt.scatter(df['x'], df['y'], color='r', marker='o', s=50)

# scatter best fit line
plt.scatter(df['x'], model.predict(df[['x']]), color='g', marker='o', s=50)

plt.xlabel('Nilai X')
plt.ylabel('Nilai Y')
plt.title('Linear Regression')
plt.legend(['Dataset', 'Best Fit Line'])
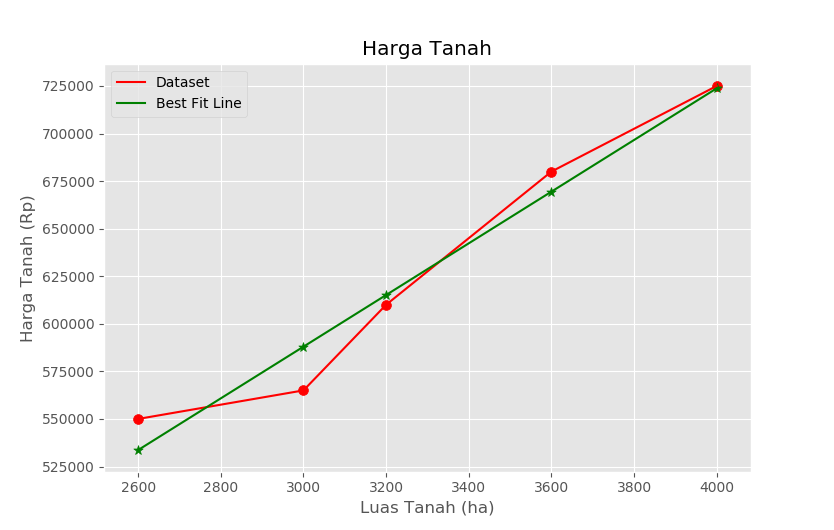
plt.show()Provided a csv file contains a dataset about land size & its price (open 3_hargaTanah.csv). Run 3_hargaTanah.py and it will create the prediction of land price based on its size. Here is the graph:
Lintang Wisesa 💌 lintangwisesa@ymail.com
Facebook | Twitter | Google+ | Youtube | :octocat: GitHub | Hackster


