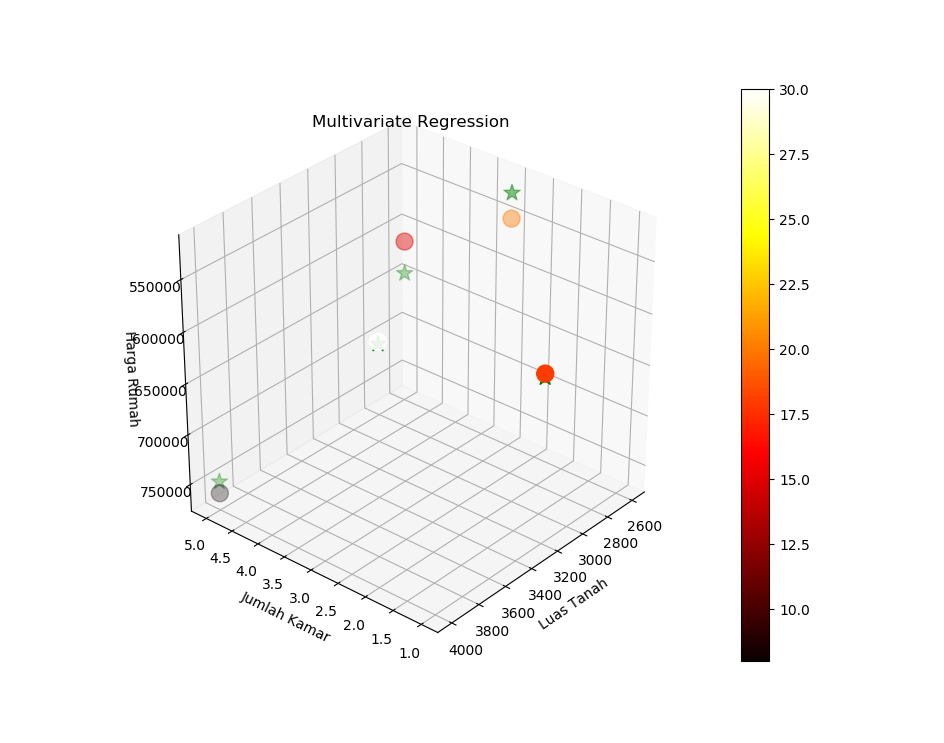
Clone/download this repo, open & run python script: 2_3varRegression.py. It will create a 3D scatter plot of dataset with its predictions. Make sure you have installed pandas, numpy, matplotlib & sklearn packages!
import pandas as pd
import numpy as np
import matplotlib.pyplot as plt

dataRumah = {
    'luas': [2600, 3000, 3200, 3600, 4000],
    'kamar': [3, 4, 1, 3, 5],
    'usia': [20, 15, 18, 30, 8],
    'harga': [550000, 565000, 610000, 595000, 760000]
}
df = pd.DataFrame(dataRumah)
print(df)

# ==============================

from sklearn import linear_model
model = linear_model.LinearRegression()

# training
model.fit(df[['luas', 'kamar', 'usia']], df['harga'])

# slope m1, m2 & m3
print(model.coef_)

# intercept b
print(model.intercept_)

# ==============================

# prediction utk luas: 3200, kamar: 2, usia: 10
print(model.predict([[3200, 2, 10]]))

# ===========================

from mpl_toolkits.mplot3d import axes3d

fig = plt.figure('Multivariate Regression')
ax = plt.subplot(111, projection = '3d')

# plot dataset
plot = ax.scatter(
    df['luas'],
    df['kamar'],
    df[['harga']],
    c = df['usia'],
    marker = 'o',
    s = 150,
    cmap = 'hot'
)

# plot prediction
ax.scatter(
    df['luas'],
    df['kamar'],
    model.predict(df[['luas', 'kamar', 'usia']]),
    color = 'green',
    marker = '*',
    s = 150
)

fig.colorbar(plot)
ax.set_xlabel('Luas Tanah')
ax.set_ylabel('Jumlah Kamar')
ax.set_zlabel('Harga Rumah')

plt.title('Multivariate Regression')
plt.show()
Lintang Wisesa 💌 lintangwisesa@ymail.com
Facebook | Twitter | Google+ | Youtube | :octocat: GitHub | Hackster

