

-
Make sure Node.js is installed on your PC, then simply download or clone this repo and install all dependencies:
$ git clone https://github.com/LintangWisesa/Vue-Chartjs-Favoriot-API.git

$ cd Vue-Chartjs-Favoriot-API

$ npm install
-
Open your code editor (I'm using Visual Studio Code), insert your Favoriot API key and Favoriot device developer ID to the components/favoriotChart.vue file!
-
API key goes to request headers:
var headers = {
headers: {
    'Content-Type': 'application/json',
    'apikey': 'your_API_key'
    }
}
-
Device developer ID goes to request headers:
var dataBody = {
  device_developer_id: "your_device_developer_id",
  data: {
    Temperature: this.$refs.temp.value,
    Humidity: this.$refs.hum.value,
    Potentio: this.$refs.pot.value,
  }
}
-
-
Run the project!
$ npm run serve
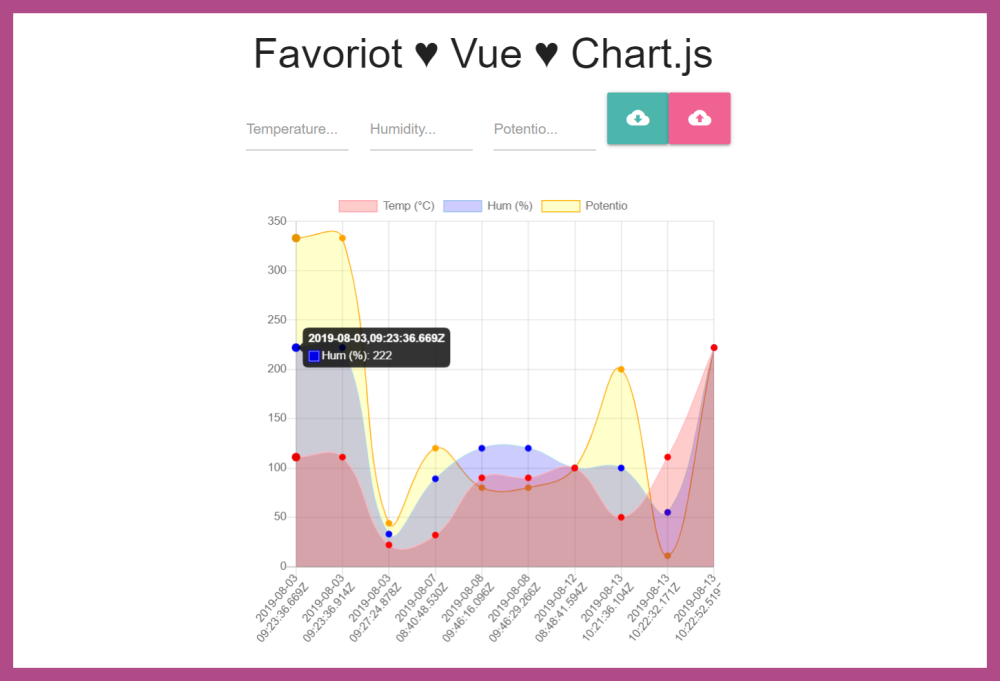
The app will be run automatically on http://localhost:8080/. Try to POST some data & GET the data back from Favoriot!
Enjoy your code~ 😍

Lintang Wisesa 💌 lintangwisesa@ymail.com
Facebook | Twitter | Google+ | Youtube | :octocat: GitHub | Hackster