
Briefly, the goal of metaseq is to tie together lots of existing software into a framework for exploring genomic data. It focuses on flexibility and interactive exploration and plotting of disparate genomic data sets.
The main documentation for metaseq can be found at https://daler.github.io/metaseq.
If you use metaseq in your work, please cite the following publication:
Dale, R. K., Matzat, L. H. & Lei, E. P. metaseq: a Python package for integrative genome-wide analysis reveals relationships between chromatin insulators and associated nuclear mRNA. Nucleic Acids Res. 42, 9158–9170 (2014). http://www.ncbi.nlm.nih.gov/pubmed/25063299
Example 1 walks you through the creation of the following heatmap and line-plot figure:

Top: Heatmap of ATF3 ChIP-seq signal over transcription start sites (TSS) on chr17 in human K562 cells. Middle: average ChIP enrichment over all TSSs +/- 1kb, with 95% CI band. Bottom: Integration with ATF3 knockdown RNA-seq results, showing differential enrichment over transcripts that went up, down, or were unchanged upon ATF3 knockdown.
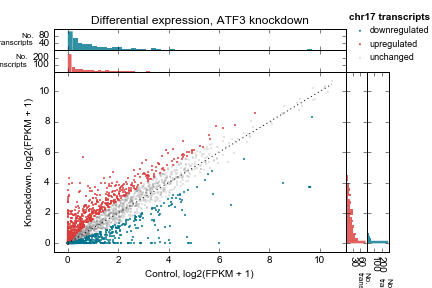
Example 2 walks you through the creation of the following scatterplot and marginal histogram figure:

Control vs knockdown expression (log2(FPKM + 1)) for an ATF3 knockdown experiment. Each point represents one transcript on chromosome 17. Marginal distributions are shown on top and side. 1:1 line shown as a dotted line. Up- and downregulated genes determined by a simple 2-fold cutoff.
In addition, metaseq offers:
- A format-agnostic API for accessing "genomic signal" that allows you to work with BAM, BED, VCF, GTF, GFF, bigBed, and bigWig using the same API.
- Parallel data access from the file formats mentioned above
- "Mini-browsers", zoomable and pannable Python-only figures that show genomic signal and gene models and are spawned by clicking on features of interest
- A wrapper around pandas.DataFrames to simplify the manipulation and plotting of tabular results data that contain gene information (like DESeq results tables)
- Integrates data keyed by genomic interval (think BAM or BED files) with data keyed by gene ID (e.g., Cufflinks or DESeq results tables)
Check out the full documentation for more.