This project is still in development.
For version information check the CHANGELOG.md
This package is for importing data from a YouLess LS120 datalogger that is connected to a smart electricity and gas meter. The data is stored in an SQLite3 database and displayed on a dash webpage using pandas and plotly. I created this package for stand-alone usage and not with a setup.py for installing. While I oriented this on Dash it is ofcourse possible to use the data retrieved from the YouLess and the plotly figures created in any other webpage.
- Dash text is available in Dutch and English (change in settings.py)
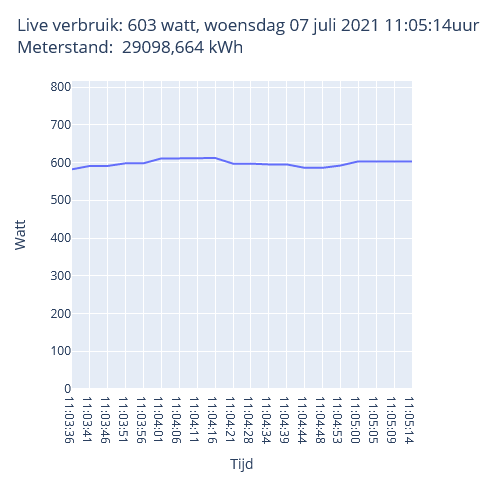
- Realtime live view with about 2 minutes history, updates every 5 seconds (showed data comes directly from the youless and is not stored in the database)
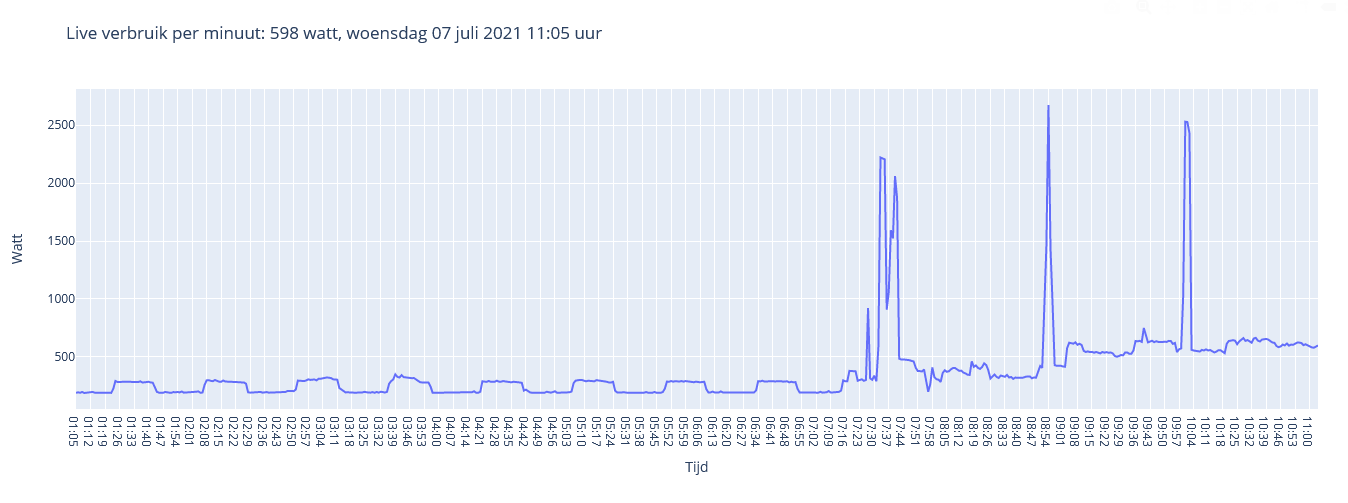
- Live view per minute up to 10 hours history, updates every minute (showed data comes directly from the youless and is not stored in the database)
- Live view per ten minutes up to 10 days history (example shows only 2 days), updates every ten minutes (showed data comes directly from the youless and is stored separately in database)
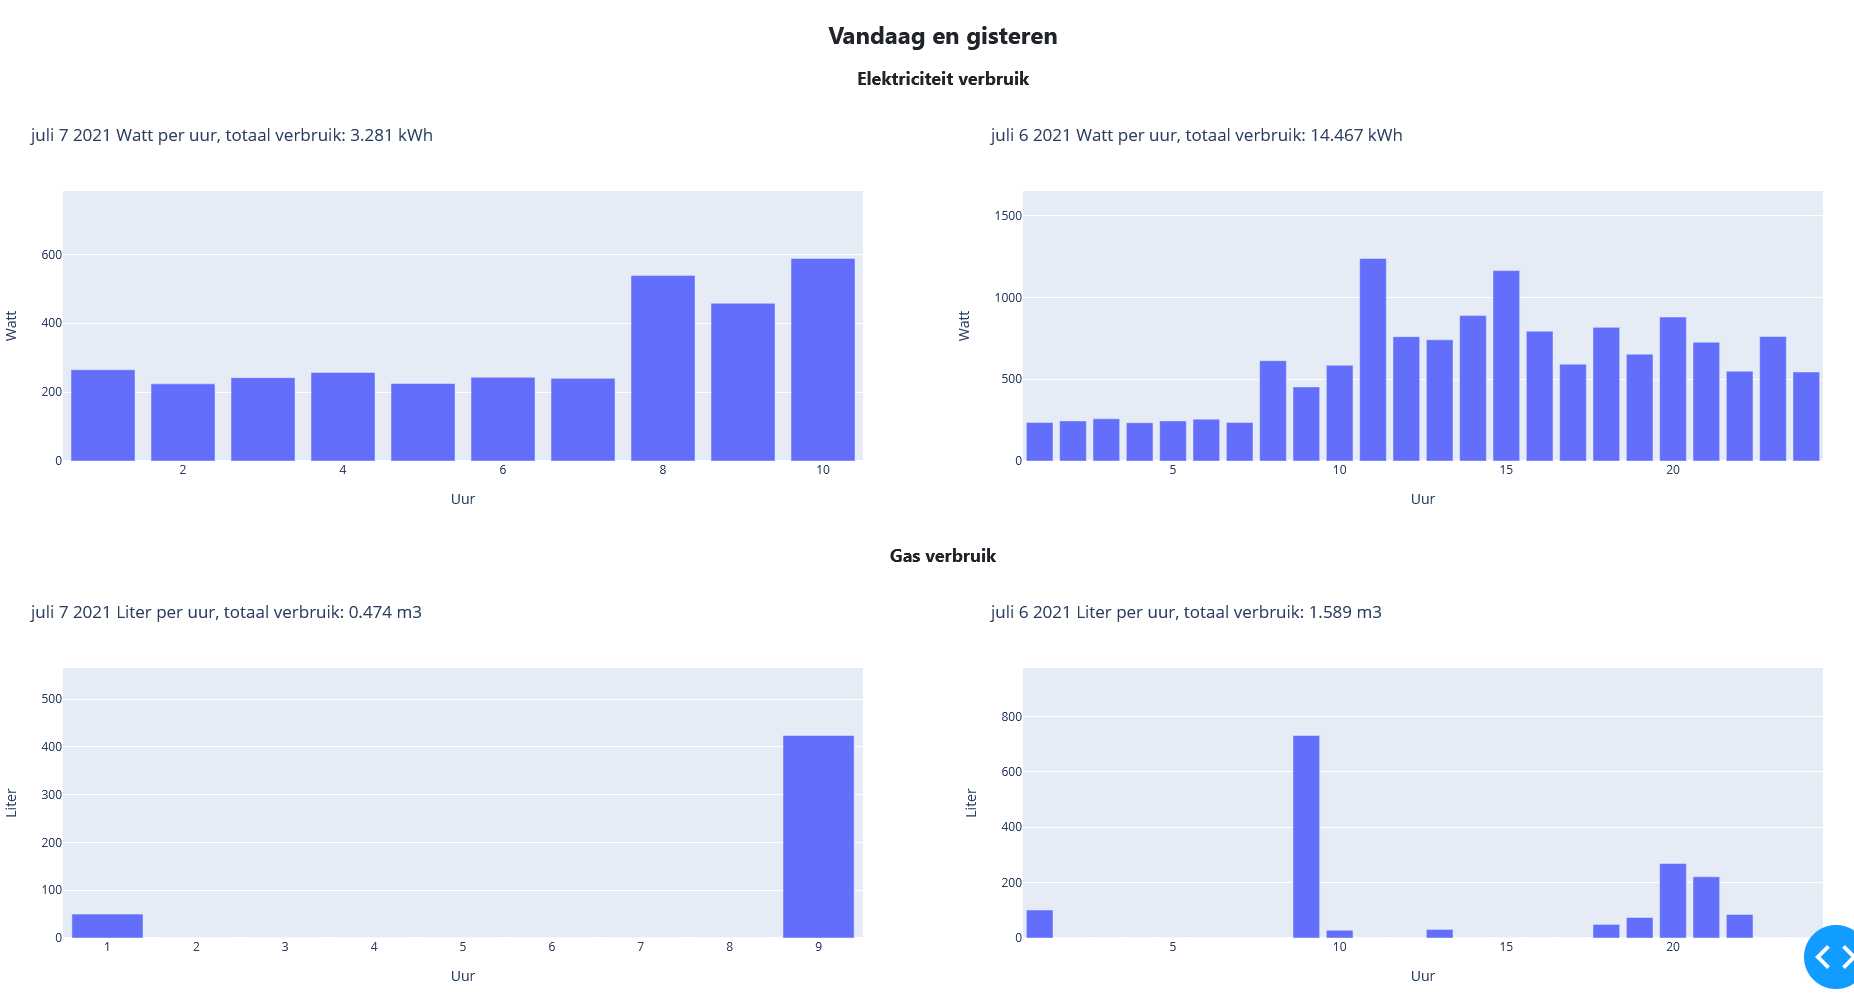
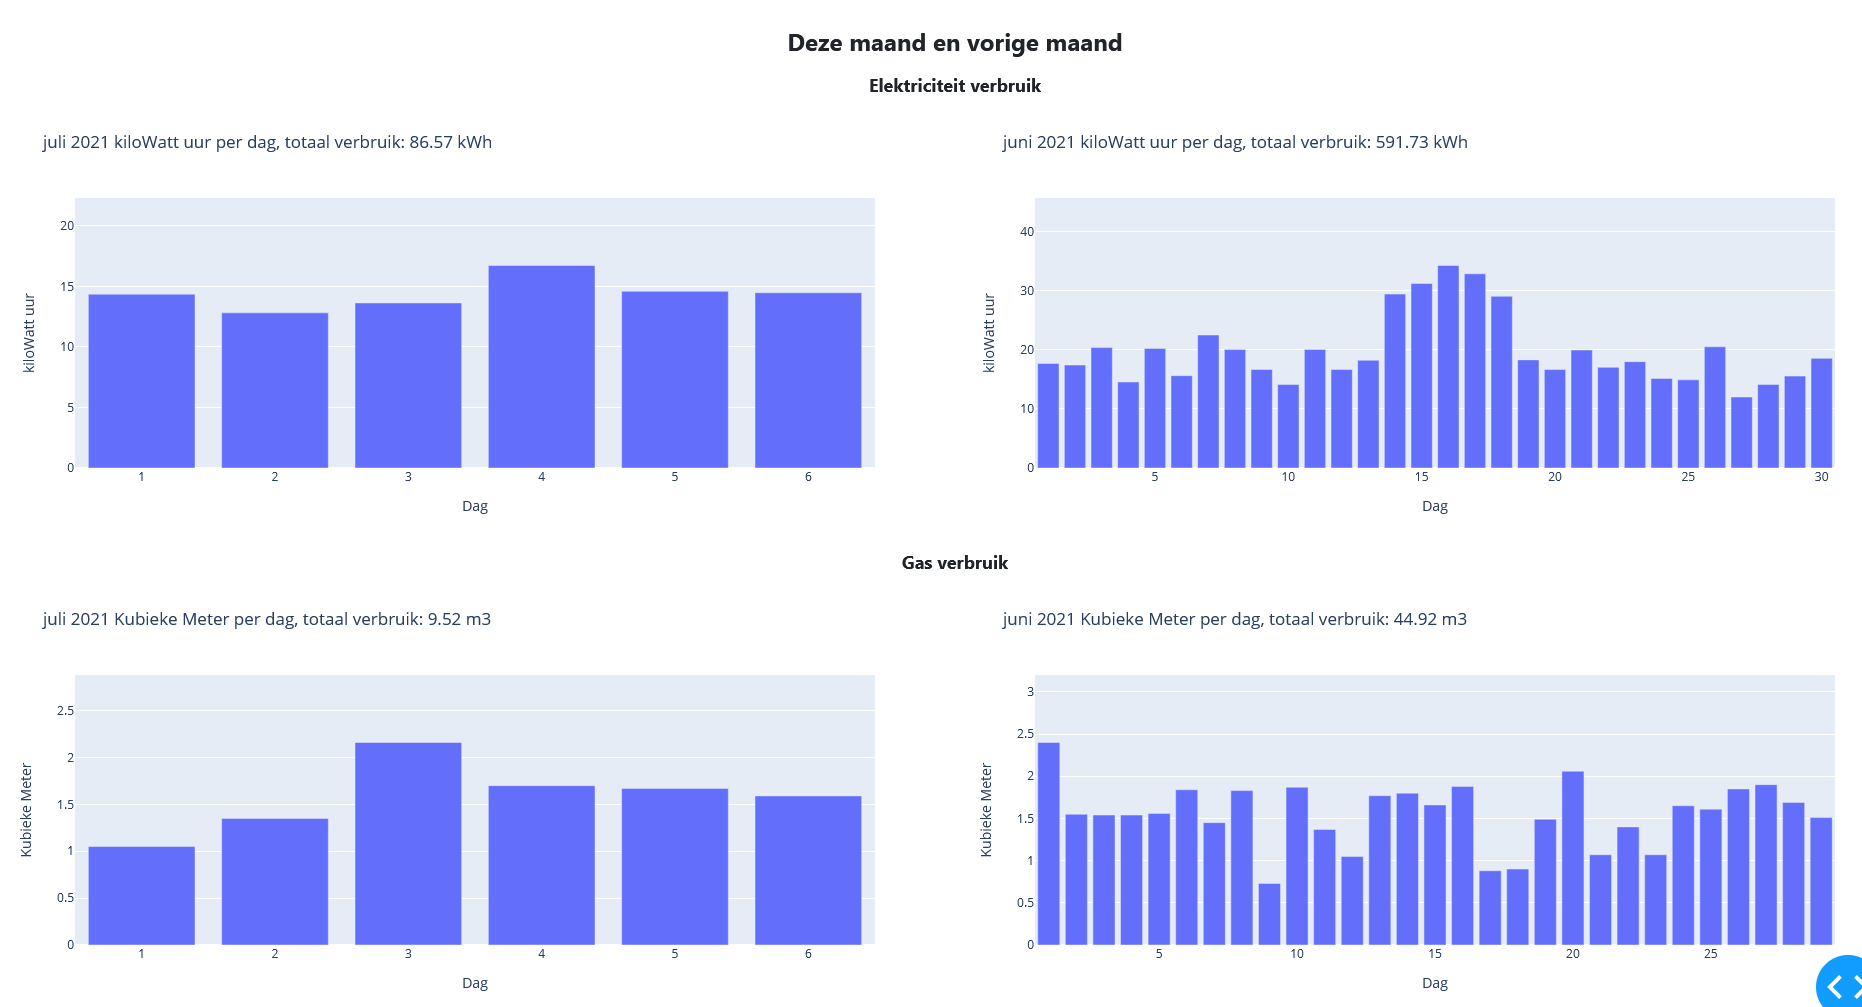
- History view for Electricity and Gas:
- Today and yesterday per hour
- This month and last month per day
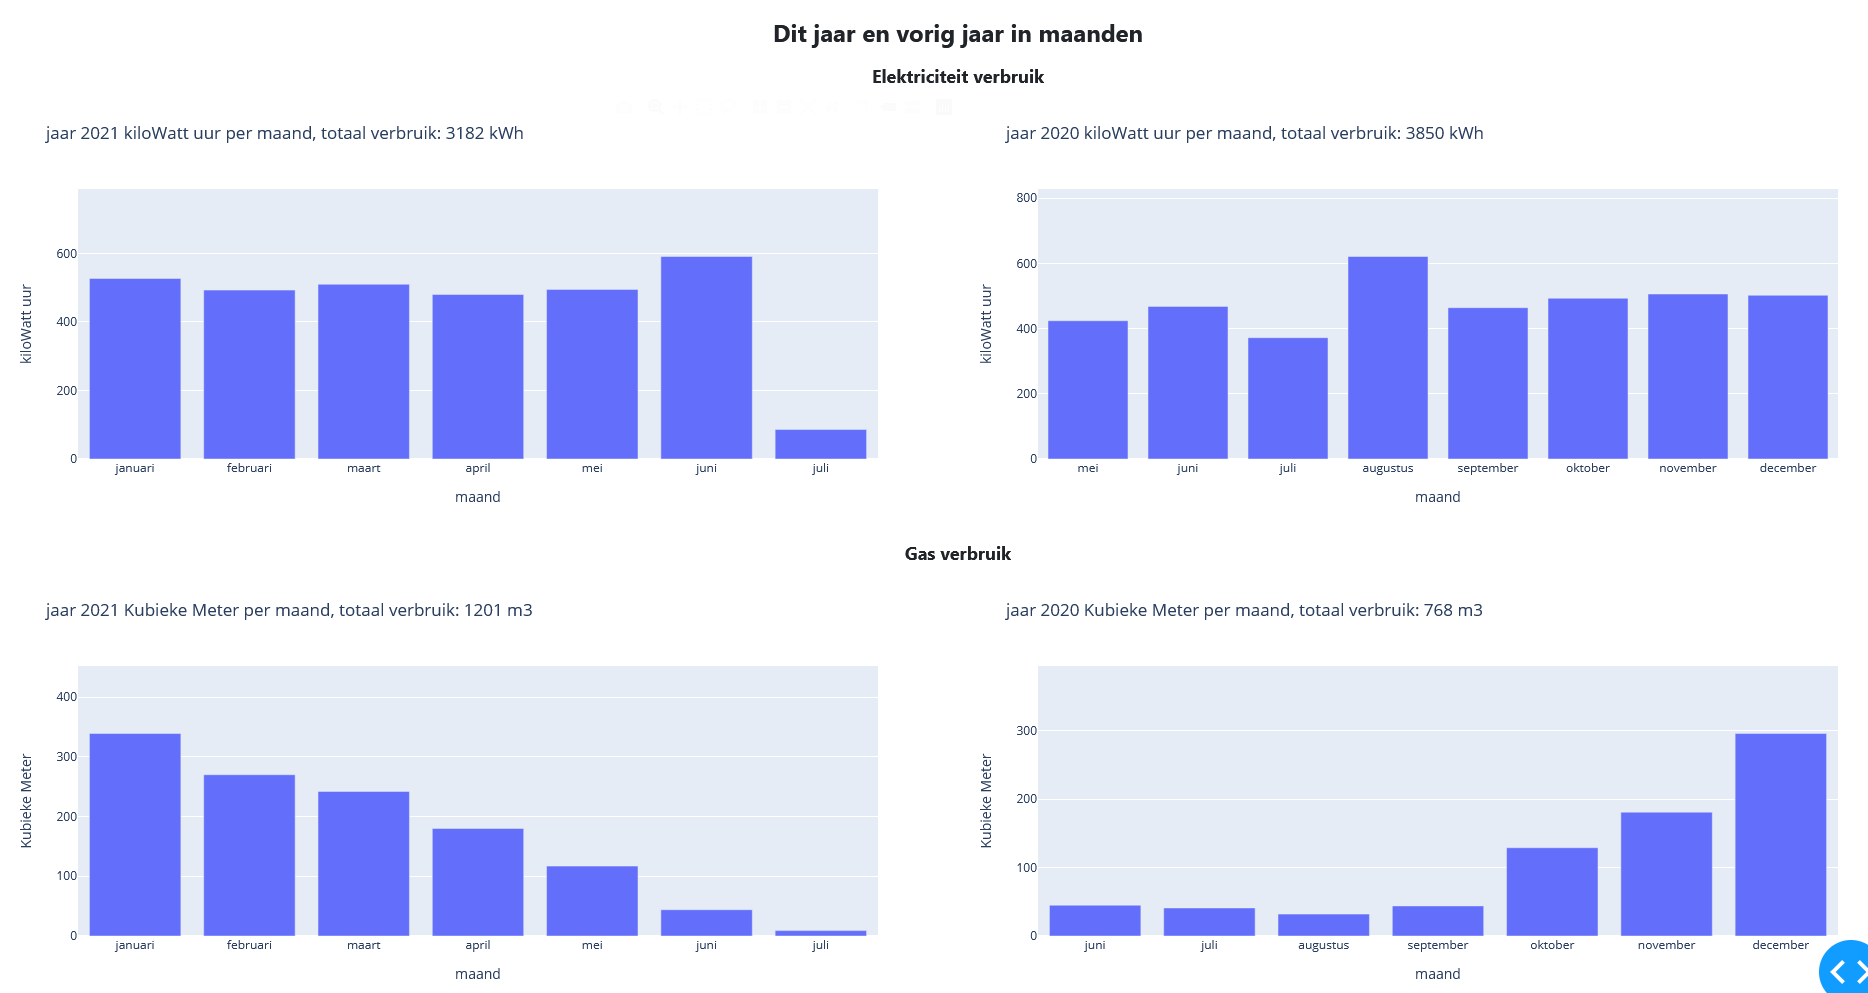
- This year and last year per month
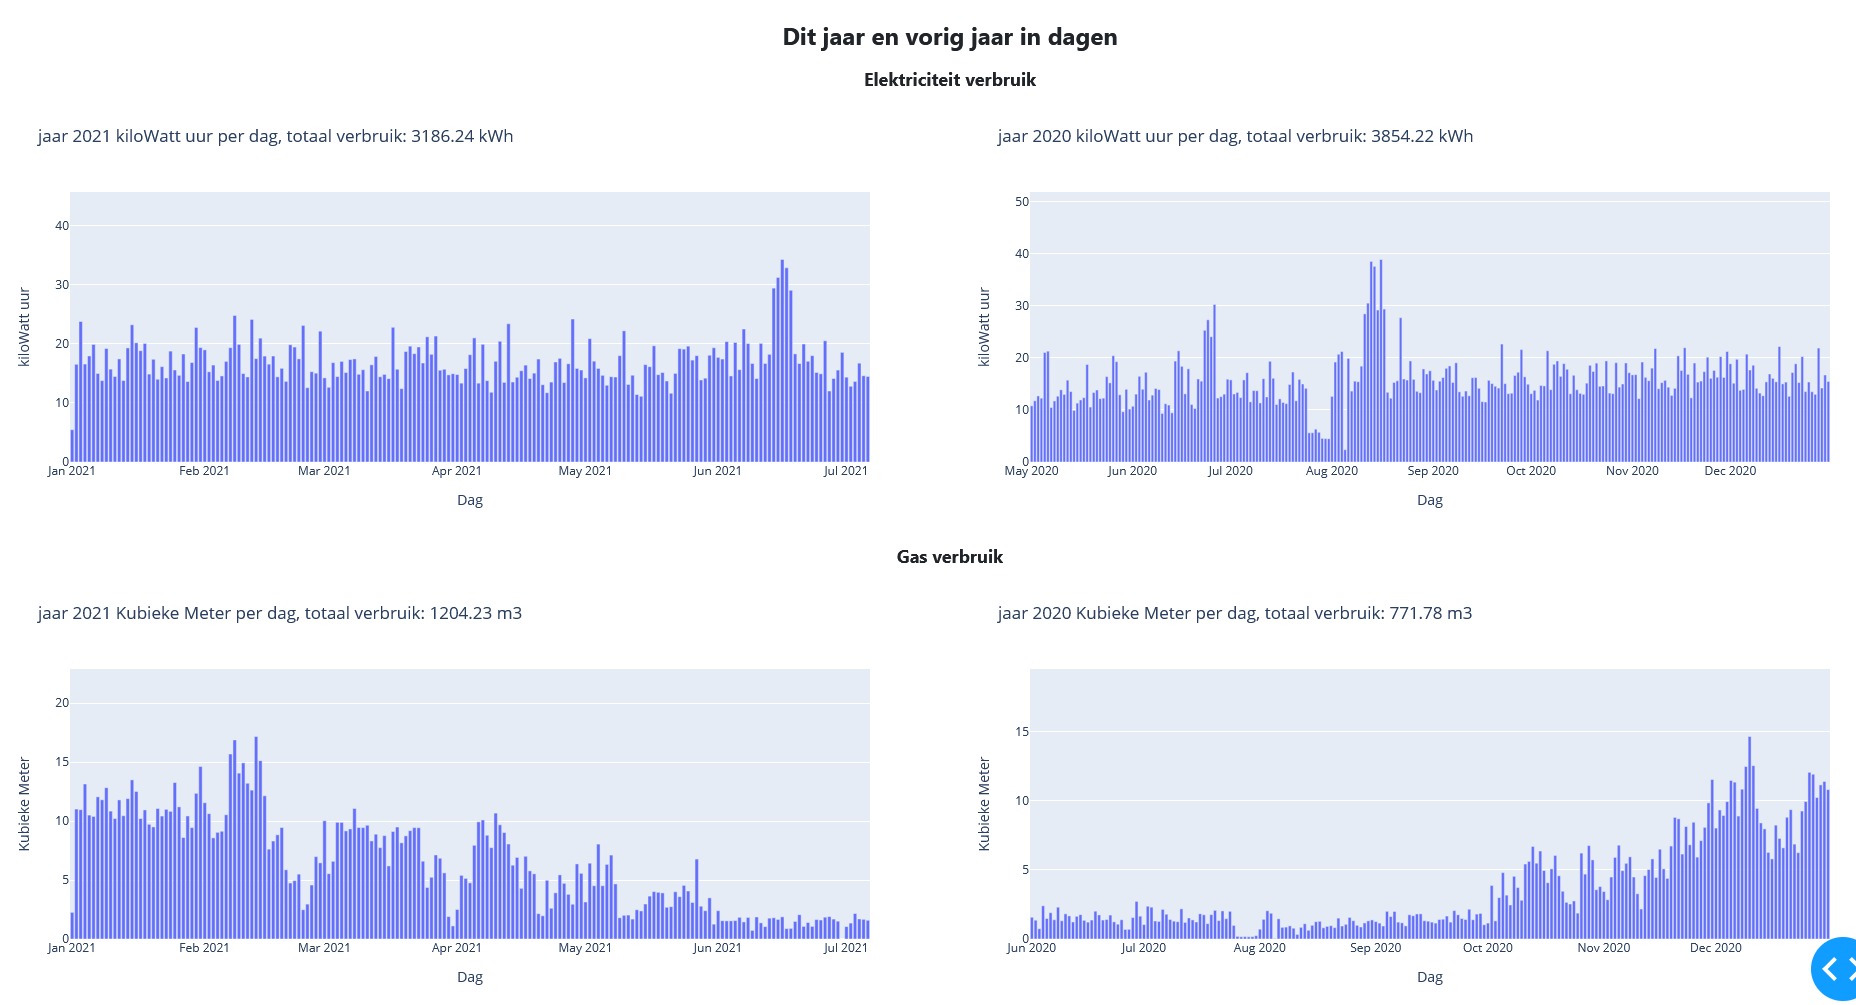
- This year and last year per day
- Import and process Energy (Electricity and Gas) data from Youless LS120 into SQLite3 database
- All data is stored as text and converted when read from the database
- Data is stored in 6 separate tables, 3 per type (Electricity or Gas)
- Appends and overwrites data if needed
- Read data back from SQLite3 database
- Convert read data to list based on wanted items
- Convert list to Pandas DataFrame based on wanted items
- Create dash based website with graphs (used as example)
- git clone the repository
git clone https://github.com/LouDnl/Youless-LS120.git cd Youless-LS120 - install all the requirements from requirements.txt
python3 -m pip install -r requirements.txt
requirements.txt is created with pipreqs - Run either example files to get an idea of what is possible. \
python3 dash_allgraphs_live.py defaultruns dash_allgraphs_live with settings from dash_settings.py: \python3 dash_allgraphs_live.py IP PORT DEBUGruns dash_allgraphs_live with provided settings where:
IP = the ip to host dash on
PORT = the port to host dash on
DEBUG = either True or False to see Dash errors and callbacks
example:python3 dash_allgraphs_live.py 192.168.1.100 8080 False\python3 dash_test_view.pyrunss dash_test_view with settings from dash_settings.py
- Or use any of the package funtions in your own code. Every function
has it's own description, go check them out in the Package files description
- dash_allgraphs_live.py starts a flask webserver that displays all available graphs
- updates the database on start and while active
- plots live, daily, monthly and yearly Electricity and GAS usage
- webpage is hosted on ip that is set in dash_settings.py and based on debug setting
or the webpage is hosted on settings given as command line arguments and ignores dash_settings.py.
- dash_test_view.py starts a flask webserver that displays the graphs set in that same file under the callback and multi_output function
- this file is for testing purposes
- webpage is hosted on ip that is set in dash_settings.py and based on debug setting
- dash_settings.py contains the IP, debug and reloader settings for the dash webserver.
- dash_web_elements.py contains pre defined settings for both example files
they can also be used for your own dash page. - when running default and if DASH_DEBUG in dash_settings.py is set to True the webserver will be hosted on local_ip,
if set to False the webserver will be hosted on remote_ip
- Per file explanation in:
Package files description
- Instructions in Systemd service on linux
- This uses environment variables as settings and omits any settings from the python scripts
- All functions can be tested with unittests found in test
- To run all tests:
 git clone https://github.com/LouDnl/Youless-LS120.git
 cd Youless-LS120
 python3 -m LS120.db_create
 python3 -m tests.test
- Convert read database data to Pandas DataFrame directly
- Create interactive Dash website with:
- Separate webpage from plot script
- Automatic view of available data
- Buttons that click to available data
- Custom graphs based on available data. e.g. average electricity usage on wednesdays
- Add option to use package with setup.py
Add possibility for users to configure settings.pyAdd live per ten minute functionAdd quick tutorial to create a linux service that always runsExamples available in docs/startupscript.txt (No explanation yet)
Split import_data into read and return and write to databaseAdd explanatory usage per package file methodAdd extra notations for more clarityRemove commented out codeAdd quick tutorial on how to install requirements.txtLive usage viewCombine reused code to importable class methodsAdd GAS usageCheck if existing data in database matches retrieved data from Youless, if so then do nothing, else appendCreate automatic readout from LS120Make webpage available on linux server
