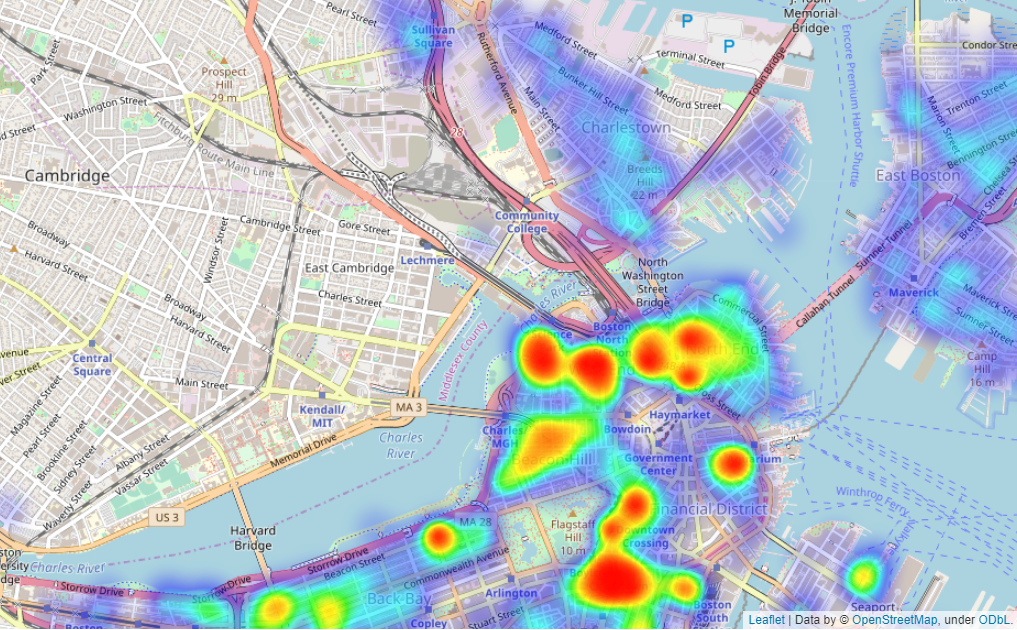
A simple analysis of the boston airbnb housing data which was used for a medium blogpost
Dataexploration and visualization
- numpy
- pandas
- matplotlib
- seaborn
- re
- pandas_profiling
tqdm for visualizing the apply process in the notebook.
- tqdm
- folium
- datetime
- calendar -> day name e.g monday,tuesday, etc.
- holidays -> to get us holidays like laborday, columbus day, independence day.
- LinearRegression
- train_test_split
- r2_score, mean_squared_error
- tree
- xgboost
link to blogpost: https://medium.com/@lukas.forst48_45317/a-short-step-by-step-guide-on-how-to-approach-a-dataset-333b9f56bebc
Data can be downloaded from http://insideairbnb.com/get-the-data.html
