Analysing crawled OpenData from a Bikesharing-Company with the help of Python osmnx and folium
You will need the Pythonmodule OSMnx to perform the geolocation and calculate the routes.
We crawled the Nextbike-Api for the GPS Data of the Bikesharing Bikes in Cologne. You can find a sample csvfile in this repository with data from one day.
With the help of OSMnx we can analyse the geolocations of the bikes and calculate the routes they are driving.
Also we can save the calculated routes into a database to make later analysis on a bigger timerange.
The functions used in the main.ipynb are stored in processes.py
So after loading the csvfile as a dataframe we can calculate the routes with transform() which returns a python dictionary giving us a lot of freedom to process the data in further steps. This will take some minutes since the calculating of the routes is very timeintensive.
routes = ps.transform(df)
The funcion pltfromdoc() reads the dictonary and plots the graph of cologne and paints the routes from the dictionary. The image will be saved into /images/graphbikes.png
The function heatfromdoc() creates a heatmap with timeseries, the stepwidth is set to an hour. You can change the stepwidth by adjusting the cnt (6=1h, 12=2h) inside the function. Check also the index.html for the interactive map.
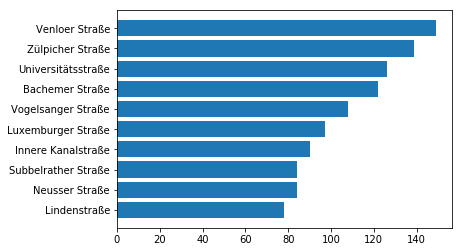
The function pltStreetCount() is a sample analysis on the data that counts the used streets in the route data and displays the top 10


