- How to reduce high dimensional data into plot-able points using PCA
- How to web scrape
Do you ever listen to the radio and hear just the perfect song to start your day? Or do you hunt online to find a certain song with a catchy chorus and a title that escaped your memory? I certainly have! I love to enjoy music, but I also am motivated to discover its secrets. This project in particular helps me - with the aid of a trusty Python script - to better understand the lyrics of the music I listen to. Specifically, this project analyzes the word usage of thousands of songs for lyrical patterns.
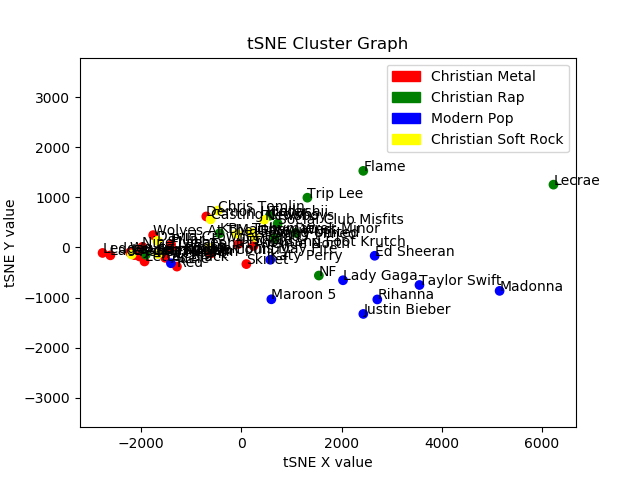
This program is a framework for collecting and analyzing lyrics from the online database azlyrics.com. Lyrics are collected using a custom web scraper that accepts lists of artist names as input. The program is capable of two forms of analysis: artist clustering and word frequency analysis. Artist clustering allows us to generate graphs like the following that show us how each musician is lyrically similar:
This graph contains a lot of artists! (I like my Christian rock :) ) We can zoom in further to see clustering by genre:
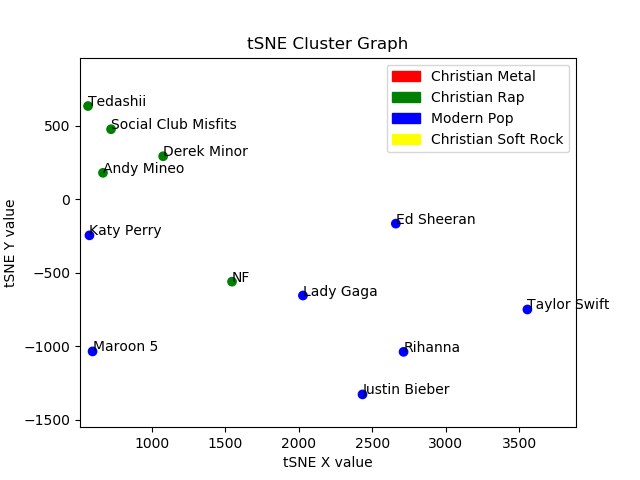
The segregated clustering that we see in this figure is support for my hypothesis that word choice in lyrics is correlated to that artist's genre. This complex graph was generated with this simple command:
python LyricFramework.py graph -c "Data/MusicCollection" --artists * -tsne
- Song
- title (str)
- lyrics (str)
- methods for analysis (vocabulary and word counts)
- CollectionBase - base class for objects that contain lyrics
- Album - contain Songs
- Artist - contain Albums
- Genre - contain Artists
- Collection - contain Genres
Before you can analyze lyrics, you need to have them downloaded into a Collection. Collections are the highest level object in this framework. They encapsulate Artists. Artists encapsule Album objects. Album objects encapsulate Songs. Collections, Artists, and Albums all inherit from CollectionBase. CollectionBase outlines what a collection of Songs look like. To download to a collection, all you need is an artist name and the genre of that artist. Then, the framework can download every album produced by that artist from AZlyrics.com. The process takes a long time, so I usually download overnight.
usage: LyricFramework.py download [-h] [-o OUTPUT]
                                                      [-a APPEND] [-i INPUT]
                                                      [-d DELAY]

optional arguments:
  -h, --help            show this help message and exit
  -o OUTPUT, --output OUTPUT
                        The file to store the downloaded lyric data
  -a APPEND, --append APPEND
                        The file to append the new downloaded data to
  -i INPUT, --input INPUT
                        The file that contains a list of artists to download
  -d DELAY, --delay DELAY
                        Delay of the downloader for each song
Artist lists are in this format:
Artist A - Genre of A
Artist B - Genre of B
...
After you write up a list of artists that you want to download, you can have the framework download the lyrics of those artists using this command:
python LyricFramework.py download -i [Artist list path] -o [Output filename for Collection] -d [Delay in seconds for downloading each song]
Make sure to set a delay of at least 8 seconds out of consideration for the servers that host AZlyrics.com. After the command is complete, the program should have scraped every lyric written by the artists on your list! Then you can move on to analysis.
The framework can rank a group of albums, artists, or genres by word frequencies. For example, I ranked all the artists in my Collection by the frequency of self-referencing pronoun usage. So the more an artist uses the wordset ["I", "me", "my", "us"], the higher on the list they will be. Here are my results:
0: Ledger - 0.06
1: Skillet - 0.05
2: Fireflight - 0.05
3: Adele - 0.05
4: Hillsong United - 0.05
5: Ed Sheeran - 0.05
6: Disciple - 0.05
7: Aaron Cole - 0.05
8: Tenth Avenue North - 0.04
9: Letter Black - 0.04
10: Ashes Remain - 0.04
11: Decyfer Down - 0.04
12: Wolves At The Gate - 0.04
13: Rihanna - 0.04
14: Lauren Daigle - 0.04
15: NF - 0.04
16: Chris Tomlin - 0.04
17: Red - 0.04
18: David Crowder Band - 0.04
19: Justin Bieber - 0.04
20: Nine Lashes - 0.04
21: Madonna - 0.04
22: Casting Crowns - 0.04
23: Lady Gaga - 0.04
24: Thousand Foot Krutch - 0.04
25: Maroon 5 - 0.04
26: We As Human - 0.04
27: Memphis May Fire - 0.04
28: Social Club Misfits - 0.03
29: Lecrae - 0.03
30: KB - 0.03
31: Andy Mineo - 0.03
32: Lacey Sturm - 0.03
33: Tobymac - 0.03
34: Katy Perry - 0.03
35: Derek Minor - 0.03
36: Flyleaf - 0.03
37: Trip Lee - 0.03
38: Demon Hunter - 0.03
39: Taylor Swift - 0.03
40: Newsboys - 0.03
41: Tedashii - 0.03
42: Matthew West - 0.03
43: For King & Country - 0.03
44: Pillar - 0.03
45: Flame - 0.02
According to the data, the artist "Ledger" has a wordset frequency of 6%. That means that 6% of the words she writes for lyrics are in the wordset that I specified! This suggests that her songs deal with the individual much more than an artist like "Flame" who has only 2% of his vocabulary containing those pronouns. We can use these statistics to make inferences about the subject matter of these artists.
Clear visualization of data is something I love, so of course I had to add it to this program! It currently supports:
- Scatterplot cluster graphs
- Scatterplot 2-dimensional wordset graphs
You can visualize the similarities and differences between albums/artists/genres using cluster graphs.
usage: MusicTypes - Abstract Construction.py graph [-h] [-c COLLECTION]
                                                   [-b ALBUMS [ALBUMS ...]]
                                                   [-a ARTISTS [ARTISTS ...]]
                                                   [-g GENRES [GENRES ...]]
                                                   [-pca] [-tsne] [-scatter]
                                                   [-x X [X ...]]
                                                   [-y Y [Y ...]]

optional arguments:
  -h, --help            show this help message and exit
  -c COLLECTION, --collection COLLECTION
                        Collection to be an input
  -b ALBUMS [ALBUMS ...], --albums ALBUMS [ALBUMS ...]
                        Album names in collection to be specified as inputs
  -a ARTISTS [ARTISTS ...], --artists ARTISTS [ARTISTS ...]
                        Artist names in collection to be specified as inputs
  -g GENRES [GENRES ...], --genres GENRES [GENRES ...]
                        Genre names in collection to be specified as inputs
  -pca                  Use Principle Component Analysis to cluster points
  -tsne                 Use t-distributed Stochastic Neighbor Embedding to
                        cluster points
  -scatter              Make a scatterplot
  -x X [X ...]          X axis wordset
  -y Y [Y ...]          Y axis wordset
For example, this command to graph all the artists in my collection as points:
python LyricFramework.py graph -c "Data/MusicCollection" --artists * -tsne
This command creates this graph:
There is obviously a lot of data to look through! We can zoom in further to see clustering by genre:
The clustering that we see in this figure is support for my hypothesis that word choice in lyrics is correlated to that artist's genre.
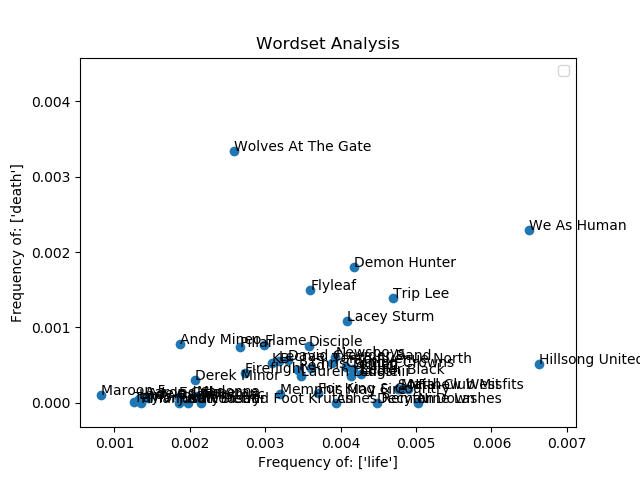
Another option is to graph albums/artists/genres by 2 wordset frequencies. One wordset determines the x-axis, and the other determines the y-axis.
python LyricFramework.py graph -c "Data/MusicCollection" --artists * -scatter -x life -y death
From this graph we can again infer some of the subject matter that inspires these artists.


