Source file stocks.csv last updated on 2016-06-24.
- Disclaimer
- About
- Gallery
- Exploration and Explanations
- Frequently Asked Questions
- Other Visualizations
- Sources
- Further Reading
Note that this stock market simulation assumes a portfolio that is invested in 100% US Stocks. While a lot of the results show that 100% Stocks can generate an impressive return, this is not an ideal portfolio.
A portfolio should be diversified with a good mix of US Stocks, International Stocks, and Bonds. This diversification helps to hedge against market swings, and will help the investor to optimize returns on their investment with lower risk than this visual demonstrates.
In addition to this, this curve only looks at one lump sum of initial investing. A typical investor will not have the capital to employ a single lump sum as a basis for a long-term investment, and will instead rely on dollar cost averaging, where cash is deposited across multiple years (which helps to smooth out the curve as well).
If you are interested in reviewing your asset allocation or auditing your portfolio, check out the Further Reading section below.
A lot of you know me from my comments and posts on Reddit's /r/personalfinance. I have also recently been spending a lot of time at /r/dataisbeautiful as well. This started off as my first dataviz project a while back. I downloaded some data based on Robert Shiller's work and went crazy with it. Now that I've finally settled in and gotten other projects completed, I picked this one back up and decided to finally drive it to completion.
"Warren [Buffet], it strikes me that if you did nothing else you never sell. That is, if you can grit your teeth through and just disregard short-term declines in the market or even long-term declines in the market, you will come out well. I mean you just stick all your money in stocks and go home and don’t look at your portfolio you’ll do far better than if you try to trade it." - Alan Greenspan
A lot of people on /r/personalfinance, usually green to the wonders of long-term investing, often question the security of the "buy and hold" strategy, or would rather try to time the market instead. This viz project is an attempt to do three things:
- Objectively explore past returns, so that all facets of long-term investing (past and present) are explored.
- Show that the "Invest Early and Invest Often" adage holds weight, and by how much.
- Observe what happens when a "buy and hold" strategy is implemented, and how well that performs.
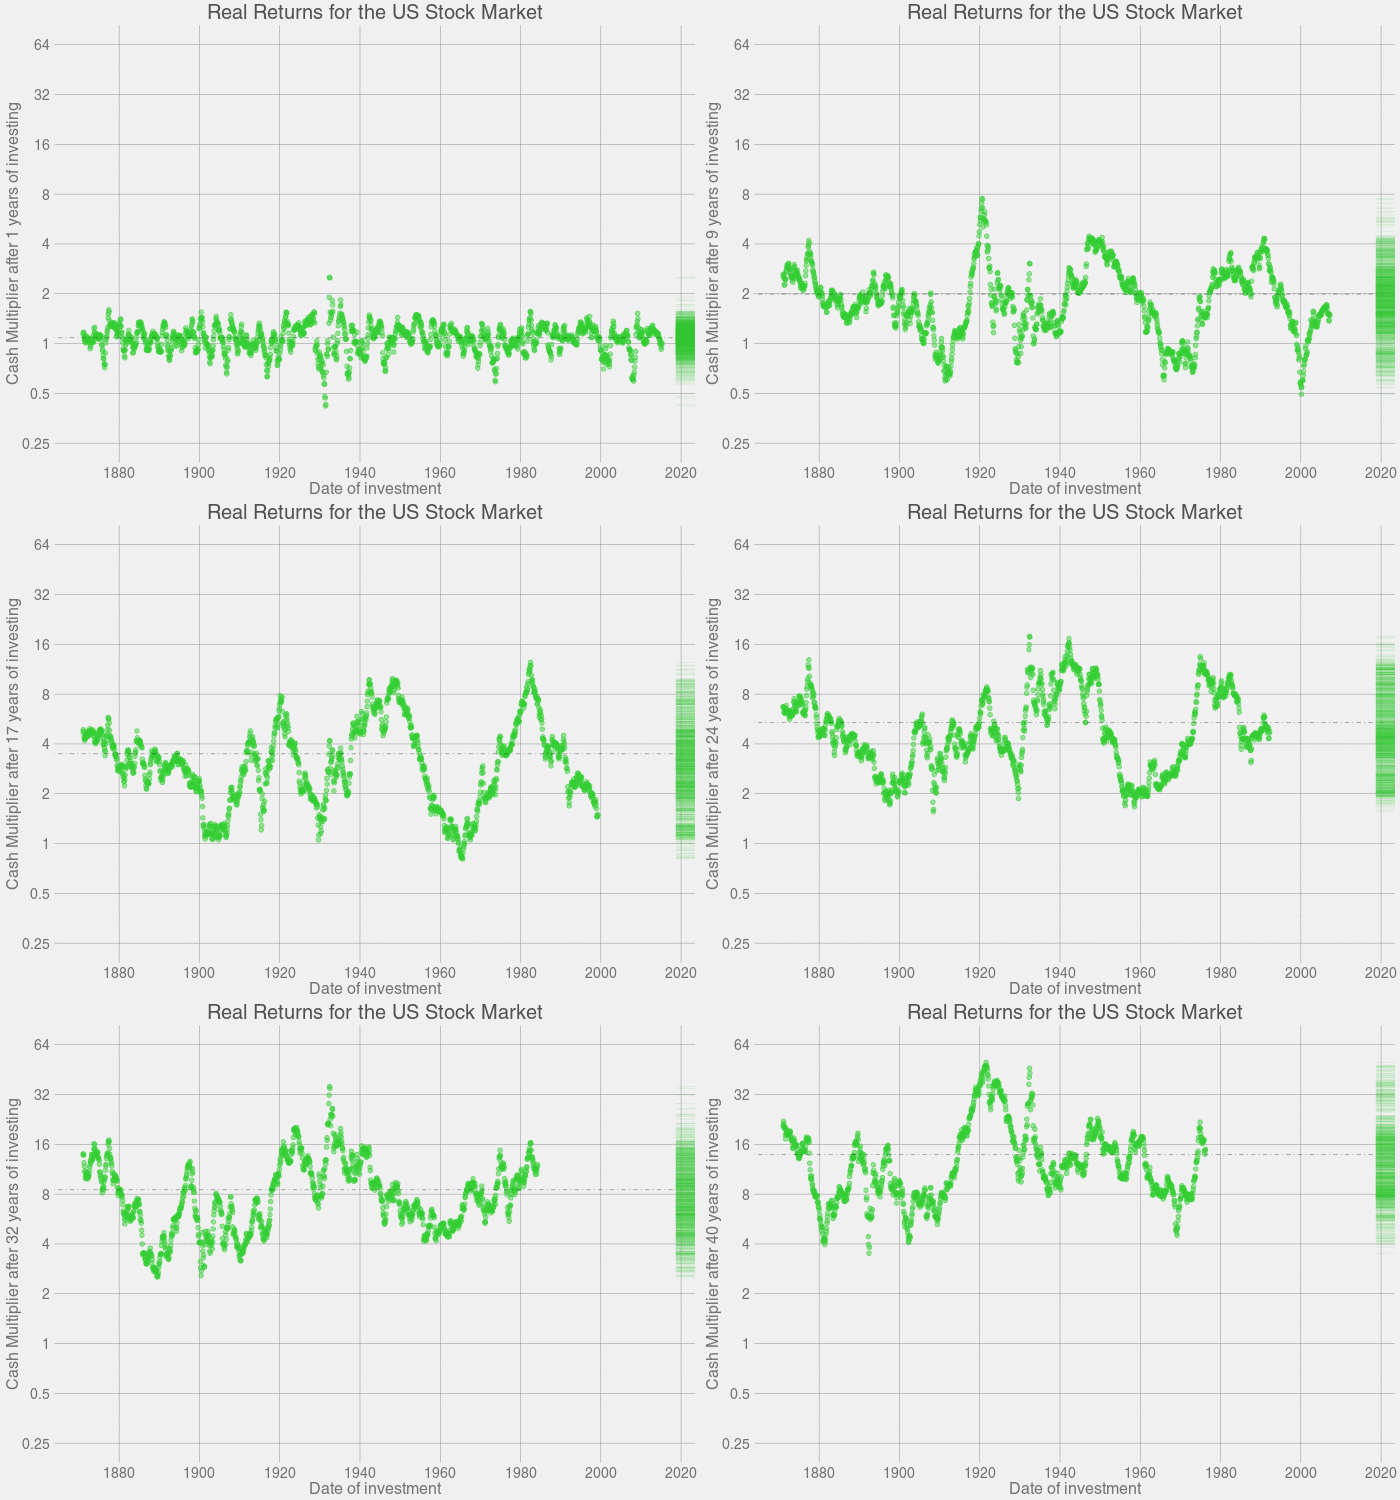
Final Plot with Average markings:
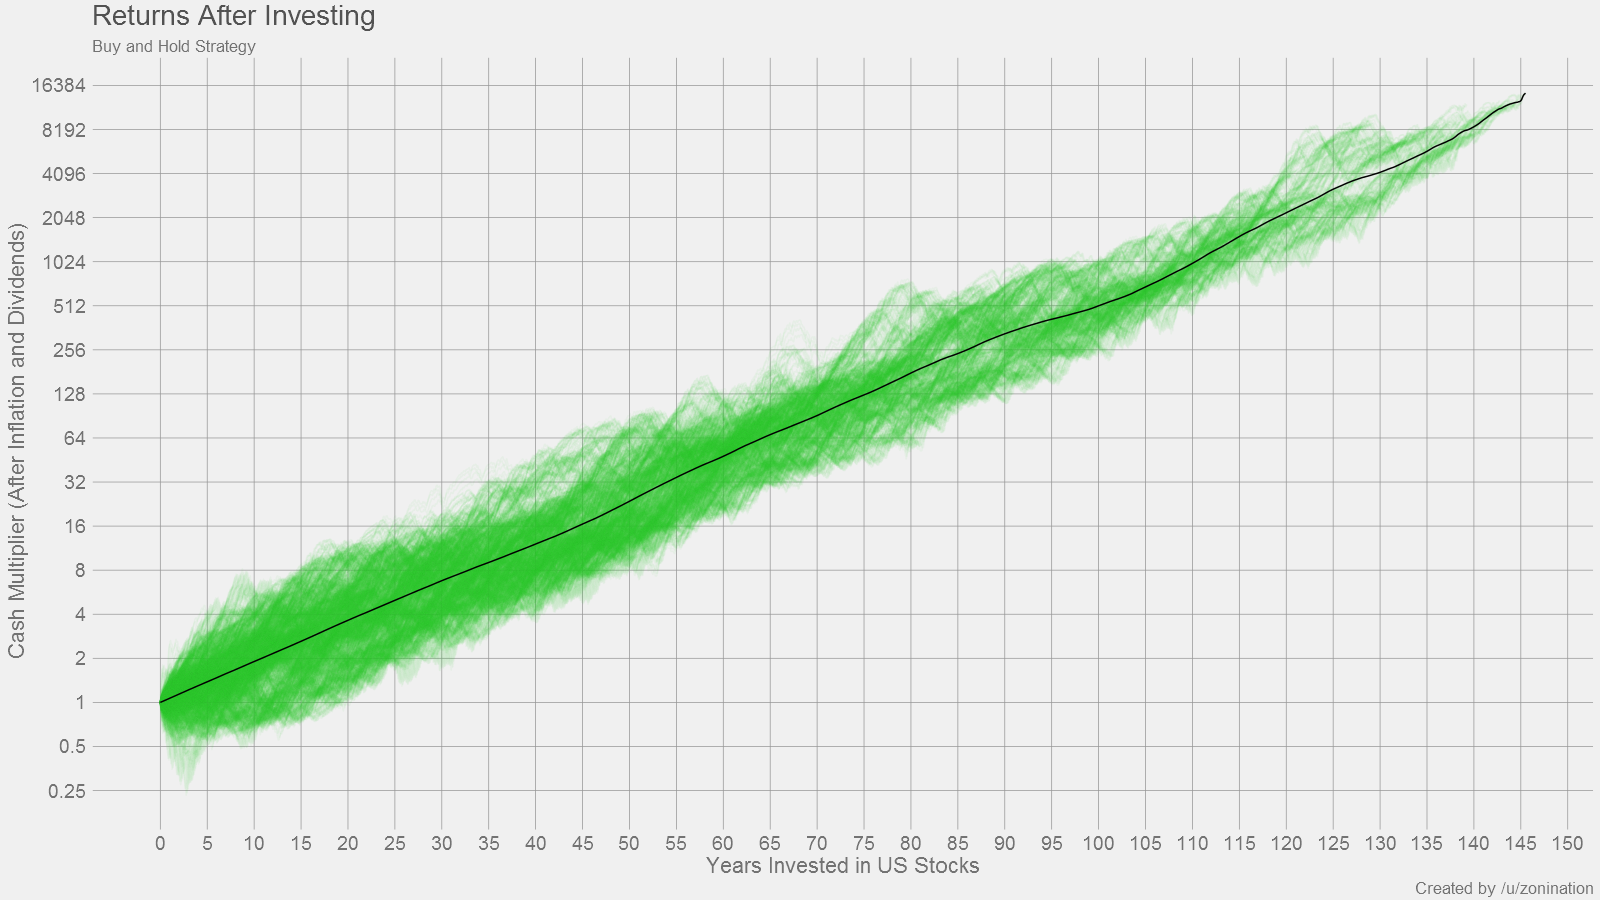
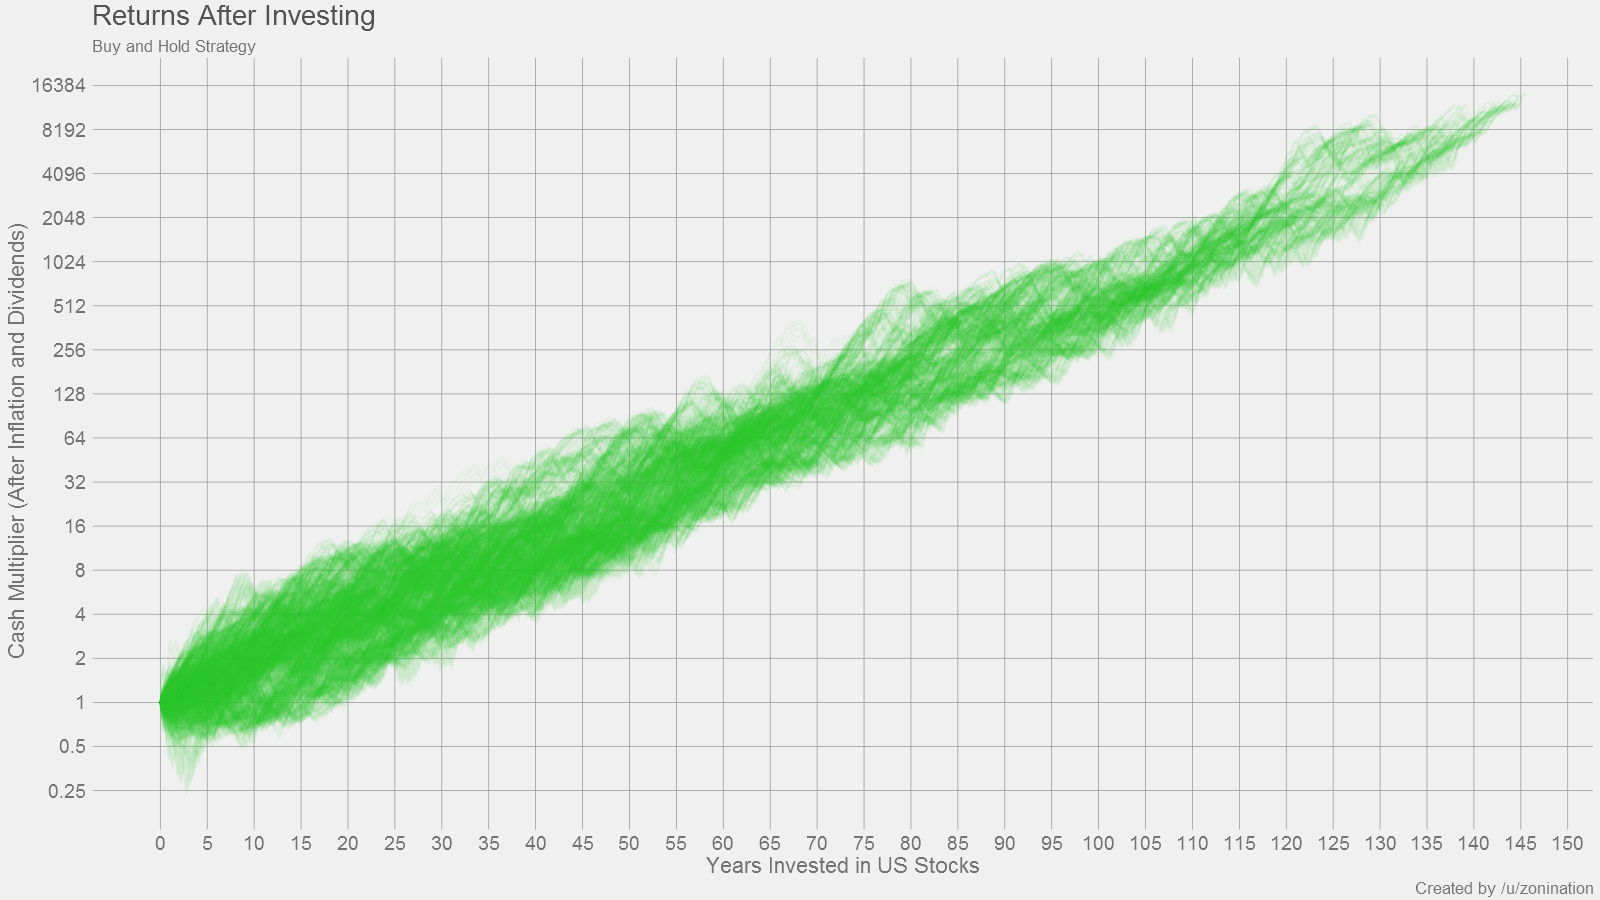
The plots above were generated based on past returns in the S&P500. So at Year 1, we take every point on the S&P500 curve, look at every point on the S&P500 that's one year ahead, add in dividends and subtract inflation, and record all points as a relative gain or loss for Year 1. Then we do the same thing for Year 2. Then Year 3. And so on, ad nauseum. The program took a couple hours to finish crunching all the numbers.
In short, for the plots above: If you invest for X years, you have a distribution of Y possible returns, based on previous history.
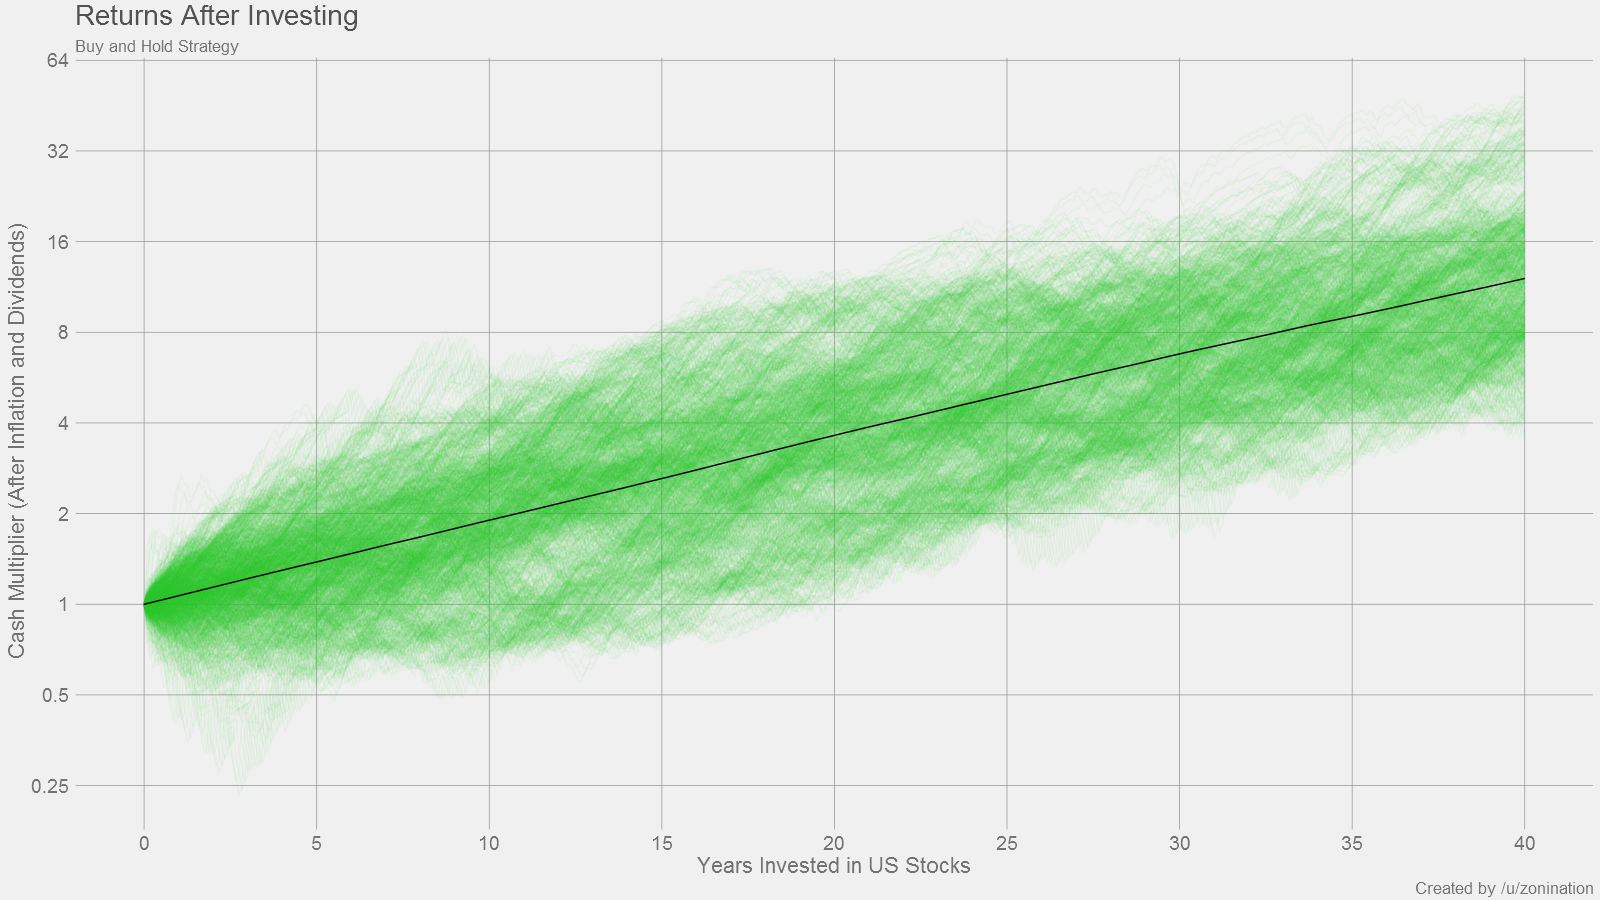
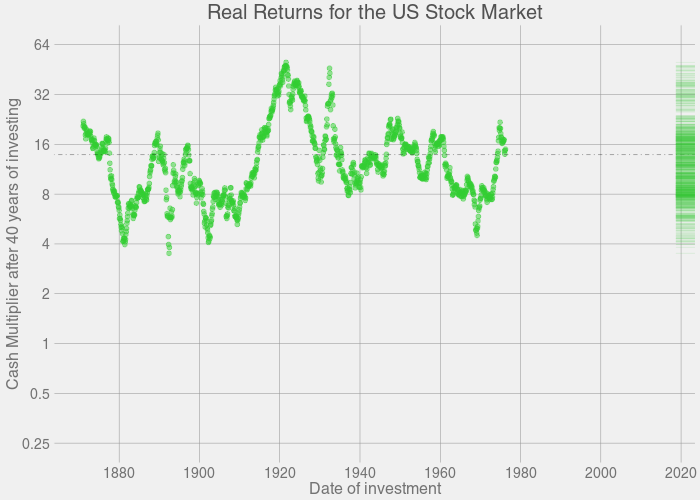
I can already hear the keyboards being tapped for the comments section: "Wait, Zoni! this is over the span of 145 years! Nobody is ever going to live to invest for that long." I know, so let's take a look at a more realistic span of investing. Let's say you start investing at the age of 20, and then retire at age 60, which gives you 40 years of investing. So after a quick subset(stocks,year<=40). Here's what that snapshot will look like:
Wait a minute. Zoom in. What's going on with those data points that are losing money over X years?
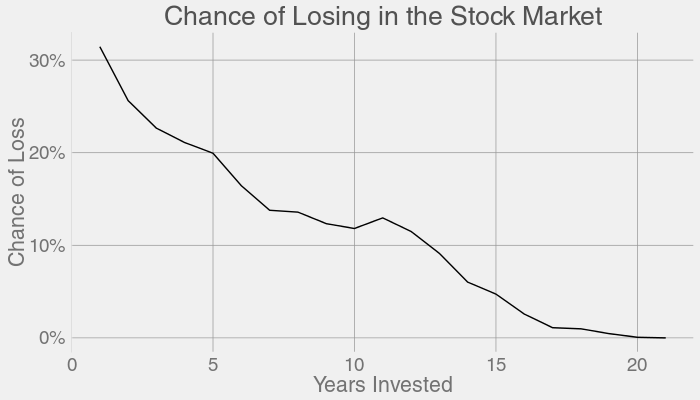
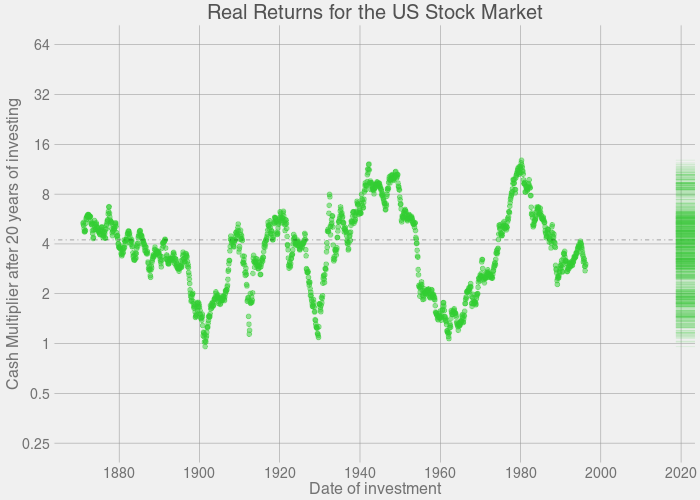
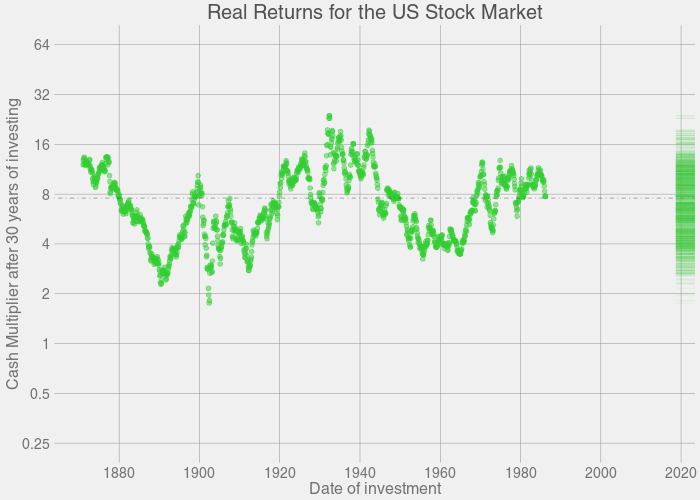
Keep in mind that this is a distribution of returns. After 1 year of investing, you might sell high or you might sell low. After 20 years, you're almost guaranteed to sell high. By 40 years, you're turning a major profit. So now what's our probability of losing cash for each possible year of investing? Code provided here
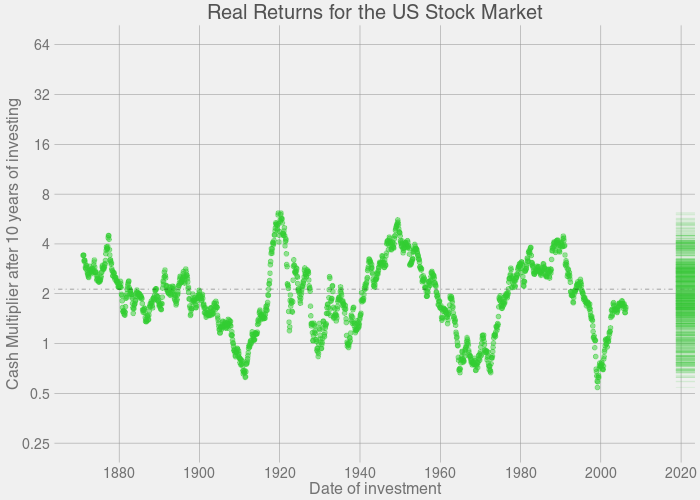
Some of the worst market downturns are also represented here, like the Great Depression, the 1970s recession, Black Monday, the Dot-Com Bubble, the 2008 Financial Crisis. But note how they completely recover to turn a profit after some more time in the market.
Here's the list of years you can invest, and still be down. Take note that some of these years cover the same eras:
- Down after 10 years (11.8% chance historically): 1908 1909 1910 1911 1912 1929 1930 1936 1937 1964 1965 1966 1967 1968 1969 1970 1971 1973 1973 1998 1999 2000 2001
- Down after 15 years (4.73% chance historically): 1905 1906 1907 1929 1964 1965 1966 1967 1968 1969
- Down after 20 years (0.0664% chance historically): 1901
- Down after 25 years (0% chance historically): none
(code :unique(subset(stocks,multip<1&year==20)$inv.year))
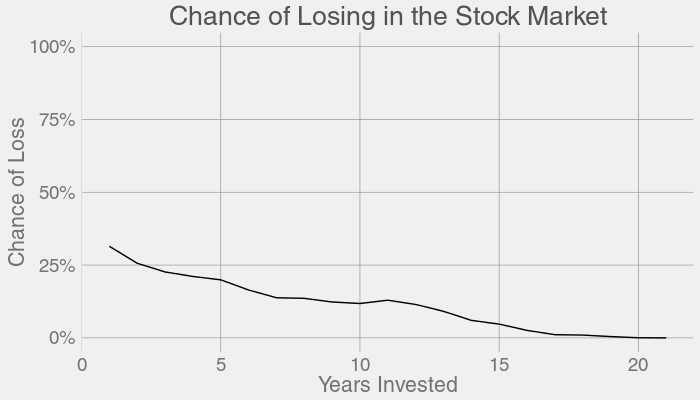
But that doesn't consider all the years that were average, or even the years that were extremely profitable for investors. Here's the same plot above, except with a 0% to 100% scale for better perspective:
Long story short, buy and hold. Invest for the long-term, and not the short-term. Don't try to time the market; even if you invested at market peaks, you'd still make out well.
What about Dollar Cost Averaging (DCA) instead of Lump Sum Investing (LSI)?
This one is going to be a little more difficult. I've included the original code and it's open-source, so if you want to play with the numbers, you can try to do this yourself. However, there are a couple points I'd like to keep in mind:
- You're working with a "cash multiplier" as the main result. You'd be trading in a unitless scale for a scale with units since you'll need to specify a base value. Perhaps the act of buying a single share of SP500 per year might help with keeping the scale nondimensional?
- There's inflation data in there, but at some point you're going to have to account for that if you're using dollars as a scale. How does one compare investing a dollar in 1902 vs. 2002?
- DCA will probably cause some scaling issues. You'll need to accurately tune your algorithm to reflect an equivalent investment under the LSI algorithm I provide.
My prediction is that DCA will "thin out" the plot and bring a lot more values closer to the average. This makes investing a bit safer, but at the cost of slower gains.
This portfolio is 100% stocks. What about Bonds? International Stocks? How about a three-fund portfolio?
Working with this kind of data would be my wet dream. If anyone has data on International Stocks, Bonds, Bills, Cash, Bitcoin, or other values you want similar plots of, in a similar format to the SP500 data, please send me a PM on Reddit.
One day, I hope to simulate a three-fund portfolio.
What if the market crashes right before retirement and the world ends up broke and the dollar crashes?
Okay, a few notes here:
- You can what-if until the cows come home, but you should also have what-if scenarios for the possibility of your hypothesis being wrong. Real risk is not based off of possibilities, it's based off of probability multiplied by the severity of the event.
- No, you're not absolutely sure it's going to happen. Stop drinking the kool-aid.
- Nobody is going to recommend a portfolio of 100% US Stocks right before retirement. That portfolio is going to be mostly bonds at that point.
- Sky-is-falling headlines are big money-makers for disreputable journalists, and often enough there is no disincentive for these writers to be incorrect.
This viz actually started off as an animation. Below is the original plot for the animation:
I'll step through a few freeze-frames of the plot above:
The code for these plots is shared in the altplots folder.
