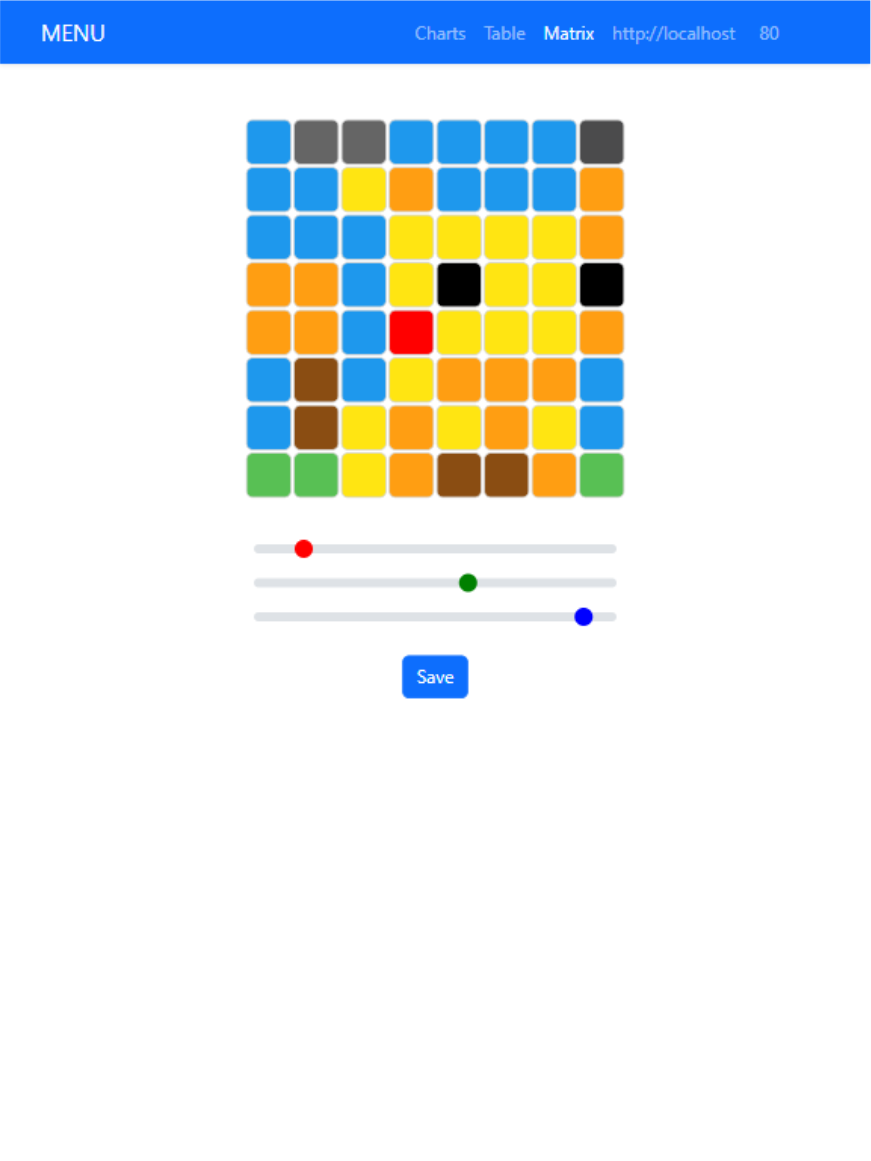
Warning! You should not use this code on production! This is only localhost example.
This project is to display sensors data real time and set LEDs from Rasperry Pi Sensehat kit with API.
It show data like:
- weather
- temperature
- pressure
- humidity
- orientation
- roll
- pitch
- yaw
- joystick
- timestamp
- direction
- action
It set color with RGB values each from 0 to 255 in point with coordinates X Y
Open index.html in browser or run Live Server. Then write ip and port in navbar.
(when you use mobile/tablet you need to collapse navbar to see this option). In navbar you can change displayed info to charts, tables or matrix to set LEDs.
Json from Raspberry Pi API to display data
[
  {
    "temperature": {
      "value": 0.65,
      "unit": "C"
    },
    "pressure": {
      "value": 988.25,
      "unit": "hPa"
    },
    "humidity": {
      "value": 12.27,
      "unit": "%"
    },
    "roll": {
      "value": -0.19,
      "unit": "deg"
    },
    "pitch": {
      "value": -0.19,
      "unit": "deg"
    },
    "yaw": {
      "value": -0.19,
      "unit": "deg"
    },
    "joystick": {
      "timestamp": 537,
      "direction": "up",
      "action": "pressed"
    }
  }
]
[
  {
    "x": 7,
    "y": 7,
    "r": 255,
    "g": 255,
    "b": 255,
  },
  {
    "x": 0,
    "y": 0,
    "r": 0,
    "g": 0,
    "b": 0,
  },
]


