This project was bootstrapped with Create React App.
Intro
From data to csv
Boundary data:
geojson (array) —>
smooth outline with array (library: https://github.com/RobinCK/smooth-polyline) —>
offset boundary with the array (library: https://github.com/w8r/polygon-offset) —>
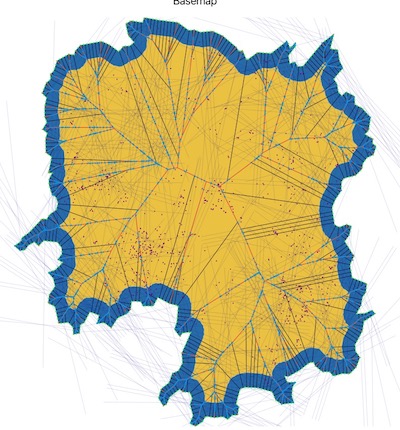
medial axis computation
Sites data:
Map dots to the map (作为参照) —> Given a segmentation, map dot density —> color range computes all segments —> color ranges
Code:
- react or not? Using lots of npm package;
⭐ problem of using an library: 1. Data input; 2. 等距两点 —> 画出最大内切圆 —> 内切圆点的集合 == medial axis
Step:
- Start from Zhejiang province, mapping Zhejiang boundary + dots (example: [http://ssz.fr/places/?eu#ac$//] (http://ssz.fr/places/?eu#ac$//)) .
✅ - Smooth outline + offset outline
✅ - Medial axis + segmentation
❌
(Problem: Can not segment the region correctly because there's too many branch; Can not find all intersection points, which may due to: findMinDistance issue, or path-intersection issue). - Mapping density —> color
✅ (Need to refine and aggregate them into a pure function)
Schedule for December:
- Finish the boundary segmentation function, sub-segment counting function and color projection function, by December 28th.
- Look into Medial Axis source code, and understand how [a point on medial axis] and [a point on the edge] matches.
- Junhan will help on segmentation computation, therefore, we can make sure to have an output whatever which region segmentation algorithm to use.
- Compare medial axis computation result with Junhan's maximum intersect circle.
- Guojun will look at "region with multiple center" implementation.
Schedule for Februrary:
- Fine tune sliding window algorithm for color mapping;
- Cope with sharp corners within the polygon for better segmentation;
- Prepare samples for human subject study, including: 3 samples for training; 4 complex boundary for matching task; one adjacent boundaries sample for demonstration.
Algorithm about
-
Data processign with Shapely and geoPandas in Python, also maptool online for adjacent boundary simplification.
-
Interpolate point on path evenly:

- test two weird vertical paths, get nearest points with paper successfully

- Done: Medial axis + segmentation

-
Count points: https://github.com/substack/point-in-polygon
-
Polygon clipping/ intersection, based on A new algorithm for computing bollean operations on polugons: https://github.com/mfogel/polygon-clipping/blob/master/paper.pdf Implementation: https://github.com/mfogel/polygon-clipping
-
Simplify boundary: https://mourner.github.io/simplify-js/
-
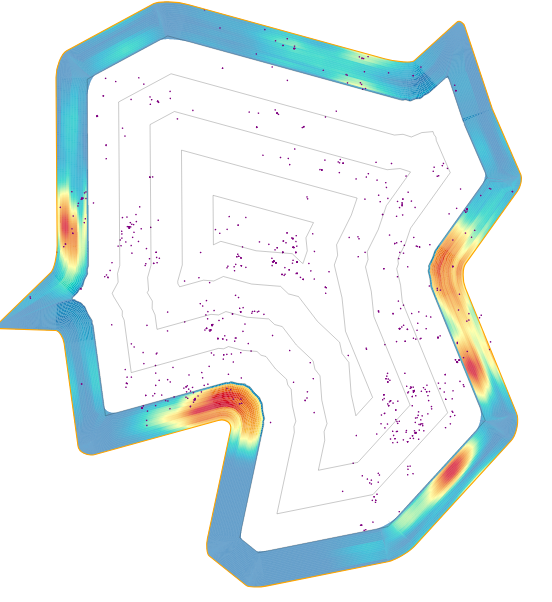
Encode density information to contour area of a arbitrary polygon
Simple shape example: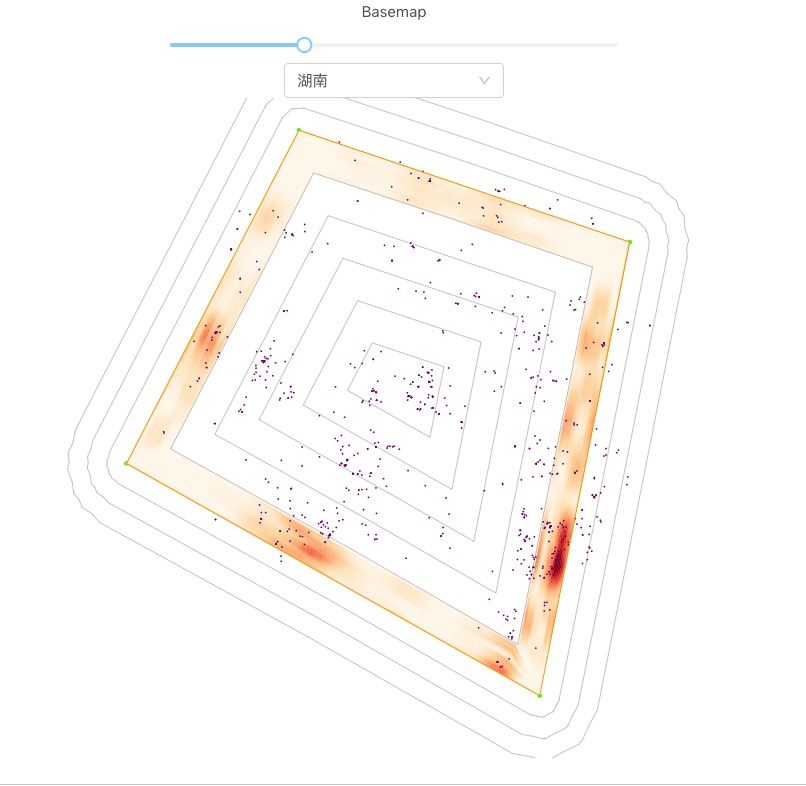
Complex shape example: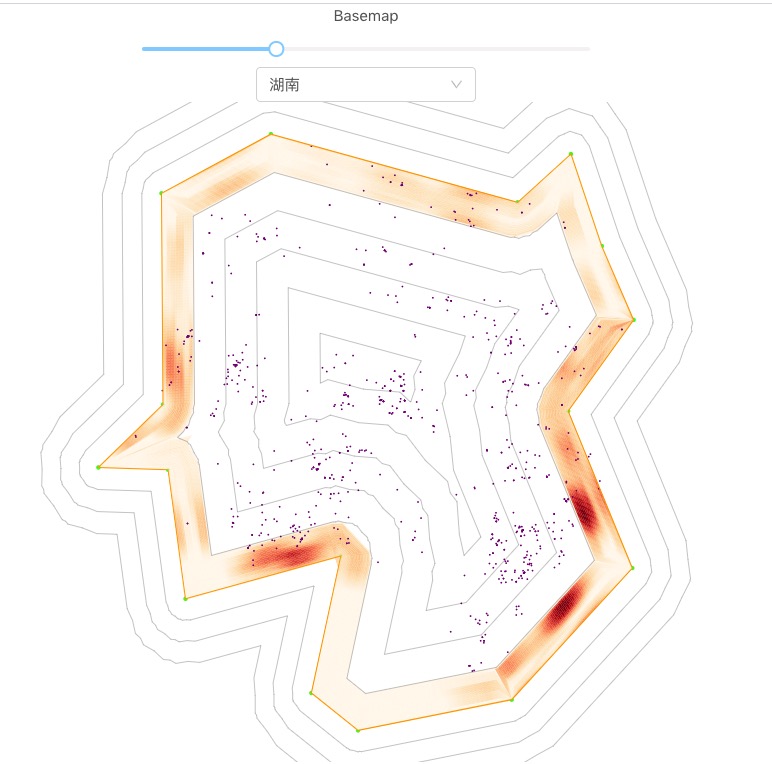
Enlarge color scope for :