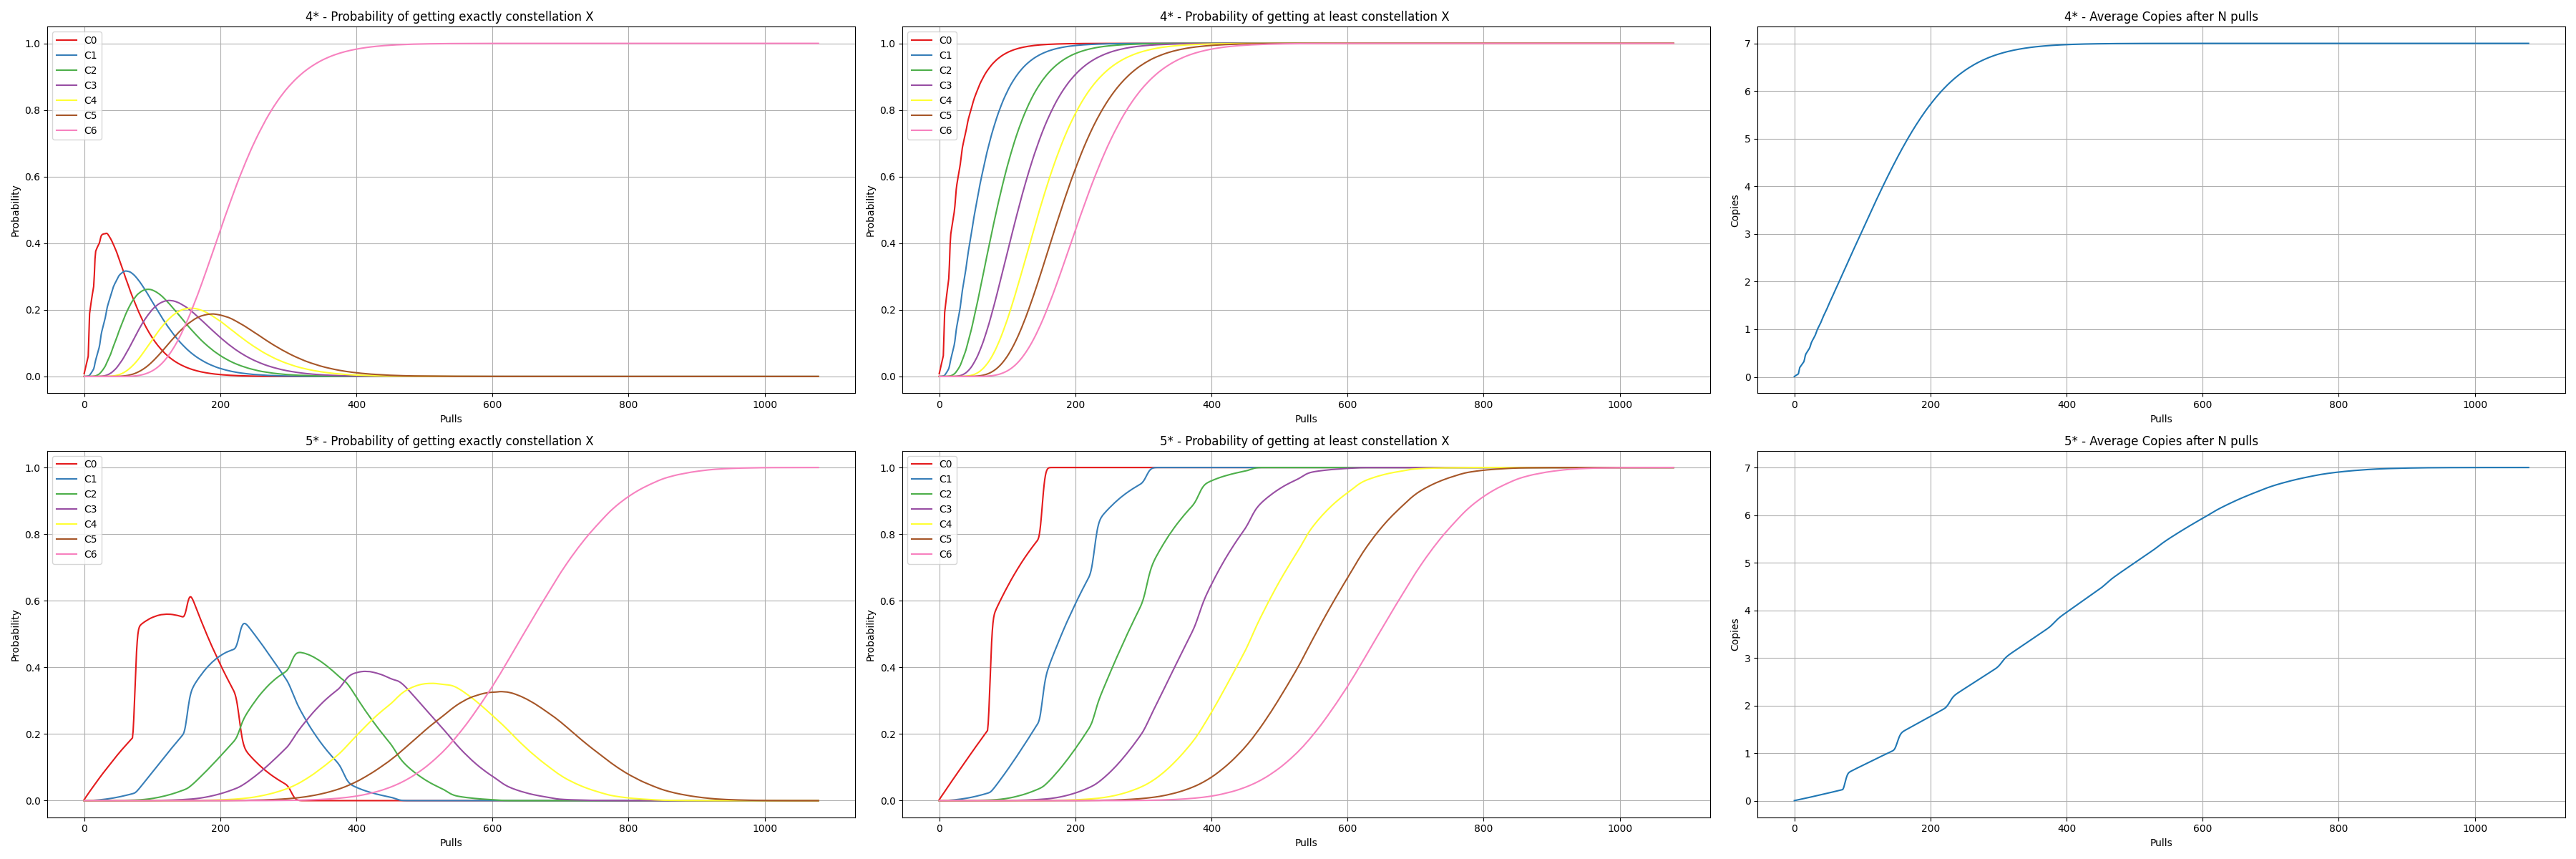
In this repo, we use a Monte Carlo Simulation in Numpy to estimate various statistics for Genshin Impact's Gatcha system. We calculate the probability of ending up at an exact constellation for one specific banner 4* or 5* after N pulls (1st column in plot) and also the probability of getting at least constellation X after N pulls (2nd column). The third column contains the average number of drawn copies for a specific character after N pulls. The simulation always assumes that we start from 0 pity without a guaranteed 50/50 win.
The individual rates are taken from Hoyolab. In particular, the average chance of getting a 5* character before entering soft-pity at pull 74 is always 0.051. Starting at pull 74, soft pity starts and linearly increases the chances of getting a 5* at each pull by 6% until we get a guaranteed 5* at 90 pulls. For 4* characters, a similar soft pity system starts at 9 pulls after not getting at least a single 4* or 5* and results in the well known guarantee for getting a 4* character every 10 pulls. For both 4* and 5* characters, the simulation also takes into account that at least every other character is guaranteed to be from the banner.
To run the simulation simply run:
python calculate_wish_stats.py
The script will output Tables containing both the probabilities of getting exactly constellation N and at least constellation N after a certain number of pulls into the results folder. For example, the probabilities of getting exactly constellation X for the banner 5* after N pulls are:
5* - Probability of getting exactly constellation X
| Pulls | C0 | C1 | C2 | C3 | C4 | C5 | C6 |
|---|---|---|---|---|---|---|---|
| 50 | 0.1372 | 0.0102 | 0.0005 | 0.0000 | 0.0000 | 0.0000 | 0.0000 |
| 100 | 0.5489 | 0.0822 | 0.0061 | 0.0004 | 0.0000 | 0.0000 | 0.0000 |
| 150 | 0.5657 | 0.2254 | 0.0342 | 0.0035 | 0.0003 | 0.0000 | 0.0000 |
| 200 | 0.4134 | 0.4335 | 0.1307 | 0.0200 | 0.0021 | 0.0002 | 0.0000 |
| 250 | 0.1236 | 0.5027 | 0.2922 | 0.0699 | 0.0103 | 0.0012 | 0.0001 |
| 300 | 0.0438 | 0.3569 | 0.3934 | 0.1627 | 0.0367 | 0.0058 | 0.0008 |
| 350 | 0.0000 | 0.1706 | 0.4161 | 0.2915 | 0.0977 | 0.0205 | 0.0037 |
| 400 | 0.0000 | 0.0408 | 0.3142 | 0.3835 | 0.1924 | 0.0558 | 0.0133 |
| 450 | 0.0000 | 0.0110 | 0.1738 | 0.3676 | 0.2881 | 0.1199 | 0.0396 |
| 500 | 0.0000 | 0.0000 | 0.0653 | 0.2806 | 0.3503 | 0.2074 | 0.0964 |
| 550 | 0.0000 | 0.0000 | 0.0134 | 0.1640 | 0.3377 | 0.2885 | 0.1964 |
| 600 | 0.0000 | 0.0000 | 0.0028 | 0.0746 | 0.2574 | 0.3252 | 0.3399 |
| 650 | 0.0000 | 0.0000 | 0.0000 | 0.0236 | 0.1588 | 0.3061 | 0.5116 |
| 700 | 0.0000 | 0.0000 | 0.0000 | 0.0044 | 0.0774 | 0.2380 | 0.6802 |
| 750 | 0.0000 | 0.0000 | 0.0000 | 0.0008 | 0.0302 | 0.1528 | 0.8163 |
| 800 | 0.0000 | 0.0000 | 0.0000 | 0.0000 | 0.0084 | 0.0801 | 0.9115 |
| 850 | 0.0000 | 0.0000 | 0.0000 | 0.0000 | 0.0015 | 0.0338 | 0.9647 |
| 900 | 0.0000 | 0.0000 | 0.0000 | 0.0000 | 0.0002 | 0.0116 | 0.9881 |
| 950 | 0.0000 | 0.0000 | 0.0000 | 0.0000 | 0.0000 | 0.0029 | 0.9971 |
| 1000 | 0.0000 | 0.0000 | 0.0000 | 0.0000 | 0.0000 | 0.0005 | 0.9995 |
| 1050 | 0.0000 | 0.0000 | 0.0000 | 0.0000 | 0.0000 | 0.0001 | 0.9999 |
| 1080 | 0.0000 | 0.0000 | 0.0000 | 0.0000 | 0.0000 | 0.0000 | 1.0000 |
The results are also summarized in a plot and saved to 'results/simulation_results.png':
By default, we simulate 1.5 million trials of 1080 pulls. Running the script with default arguments has a peak memory consumption larger than 20GB. To reduce this, you can simply run the simulation with less trials.
python calculate_wish_stats.py --trials N --chain_length M
The project dependencies are given in 'requirements.txt'. To install them from the included file, simply use:
pip install -r requirements.txt
