This project uses docker, airflow, redshift, S3 and python pandas library.
The goal of this project is to calculate the correlation matrix between covid-related twitter activity and the number of covid related statistics (number of cases, deaths and recoveries).
Data source were identified from search on Kaggle and via google. Two dataset were necessary for the aforementioned analysis: 1) Dataset related to twitter activity 2) Time series Covid-19 statistics for each country. More information on the datasets can be seen this section
In the example provided, the DAG calculates the correlation matrix for the month of october 2020 and stores the correlation matrix in S3 as a CSV file.
While the twitter dataset starts from 22nd March but the covid stats are available from January. This is not important in our case since we would be evaluating the correlation for october but it is important to consider it when calculating the correlation for those months.
Country code in the twitter data is not always there. There are many cases in while geo location for the tweet is not available. In addition, the language is also undefined in some cases.
We will filter out the entries with NULL as geolocation since we can not be sure where that tweet is from.
- Covid twitter data: https://github.com/thepanacealab/covid19_twitter
- Country code: https://datahub.io/core/country-list
- Covid data per country: https://github.com/datasets/covid-19/blob/master/data/countries-aggregated.csv
This is a twitter chatter dataset containing roughly 4 million tweets a day. Since we use the subset of data for october this means well over 100 million rows for this subset of data.
Files: <date>_clean-dataset.tsv.gz
| Variable | Variable Name | Type | Description |
|---|---|---|---|
| Tweet ID | tweet_id | Numeric | ID assigned to the tweet |
| Date | date | date (yyyy-mm-dd) | Date of the tweet |
| Time | time | time (hh:mm:ss) | Time of the tweet in 24h format |
| Language | lang | char(2) | 2-Character Language code |
| Country code | country_code | char(2) | 2-Character Country code |
Data Snippet
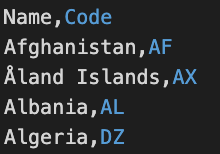
File: country_code.csv
| Variable | Variable Name | Type | Description |
|---|---|---|---|
| Country Name | Name | String | Full Country Name |
| Country Code | Code | char(2) | 2-Character Country Code |
Data Snippet
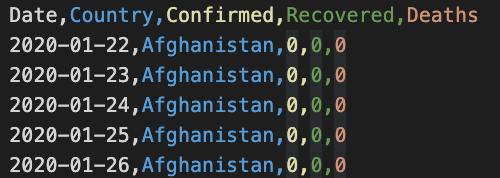
File: countries-aggregated.csv
| Variable | Variable Name | Type | Description |
|---|---|---|---|
| Date | Date | date (yyyy-mm-dd) | Date |
| Country Name | Country | String | Full Country Name |
| Confirmed Cases | Confirmed | Numeric | Total number of confirmed cases for the country |
| Recovered Cases | Recovered | Numeric | Total number of recovered cases for the country |
| Number of Deaths | Deaths | Numeric | Total number of deaths for the country |
Data Snippet
Data consistency is not an issue in this case, since the data is not being written in transactions to the database. We are concentration on performing Analytics on the available data. So we could use
In this project we are going with a relational data model and a star schema. Even though in our case we would just have one dimension table (countries) along with the fact table (covid_reactions). I went with the star schema because then other dimension tables such as information about the tweets and the users can be added, if those datasets are made available. This can help in greating expanding the analytics that can be performed without requiring significant changes to the model or the pipeline.
The fact table covid_reactions combines the covid related statistics of each country with the number of tweets for each day. The dimension table (countries) includes the country names and corresponding country codes as defined in the previous section. The two tables can be joined using the Country name.
In the covid statistics dataset, stats for each country are presented as an aggregate number until each date. So we would need to convert this data into daily number of cases before combining with twitter data. That's because without daily statistics, the correlation would not mean anything. So we have to preprocess the covid statistics dataset before joining and loading it into the covid_reactions table in redshift.
The data dictionary for this table (covid_reactions) is presented below:
| Variable | Variable Name | Type | Description |
|---|---|---|---|
| Date | date | date (yyyy-mm-dd) | Date |
| Country Name | country | String | Full Country Name |
| Confirmed Cases | confirmed | Numeric | Total number of daily confirmed cases for the country |
| Recovered Cases | recovered | Numeric | Total number of daily recovered cases for the country |
| Number of Deaths | deaths | Numeric | Total number of daily deaths for the country |
| Number of Tweets | number_of_tweets | Numeric | Number fo covid related tweets with geolocation tag of the country |
So the steps to transform the data into the tables mentioned above would require
- Staging the covid and twitter data
- Loading the country code data
- Preprocessing the covid stats to transform them from aggregate to daily statistics
- Combining the daily covid statistics with number of tweets geotagged for each country
- Calculating the correlation matrix
The ETL pipeline DAG and description of each task in the DAG is presented in the next step.
- Install and setup apache airflow using docker-compose yaml file provided in the repository:
docker-compose up - Create and start a redshift cluster
- Use the table creation SQL statements (in
airflow/capstone_create_tables.sql) directly in redshift after creating the redshift cluster. - In airflow you will need to create three connections:
- A Postgres connection for your redshift cluster named:
redshift - An S3 connection named:
S3_conn - An AWS connection with your AWS credentials named:
aws_credentials
- A Postgres connection for your redshift cluster named:
- Change the S3 bucket name in
airflow/dags/capstone_dag.py - Download the data in to the local
datadirectory using./download.sh - Copy the data to your S3 bucket (replace the name for the S3 bucket):
export BUCKET_NAME=<your_bucket_name>
aws s3 cp data/ s3://${BUCKET_NAME}/tweets/ --recursive
aws s3 cp docs/countries-aggregated.csv s3://${BUCKET_NAME}/cases/
aws s3 cp docs/country_code.csv s3://${BUCKET_NAME}/countries/
Here's the airflow DAG for this job. This analytics task requires a simple schema with a single fact table covid_cases and a single dimension table countries. Other dimension tables can be added to expand on the information from twitter if that dataset was made available.
This section contains the description of different tasks in the DAG. The schemas for the tables referred subsequently are available in airflow/capstone_create_tables.sql.
Inserts data into the staging_covid_cases table in redshift based on the data from countries-aggregated.csv from S3.
Inserts data into the countries table in redshift based on the country code data from country_code.csv from S3.
Inserts data into the staging_tweets table in redshift based on the gziped tsv data from {BUCKET_NAME}/tweets/*.tsv.gz from S3.
This operator fetches data from the staging_covid_cases and then data is cleaned up by filtering out the data for October (for which we have the twitter data). The aggregate numbers for confirmed cases, recovered cases and deaths and then converted into daily numbers instead by using pandas' Dataframe.diff(). This data is then inserted into the covid_cases table in redshift
Data is inserted into the covid_reactions fact table in redshift by performing a join between the covid_cases, countries and staging_tweets data.
Current data quality checks simply check if there are records in the covid_reactions and countries redshift table.
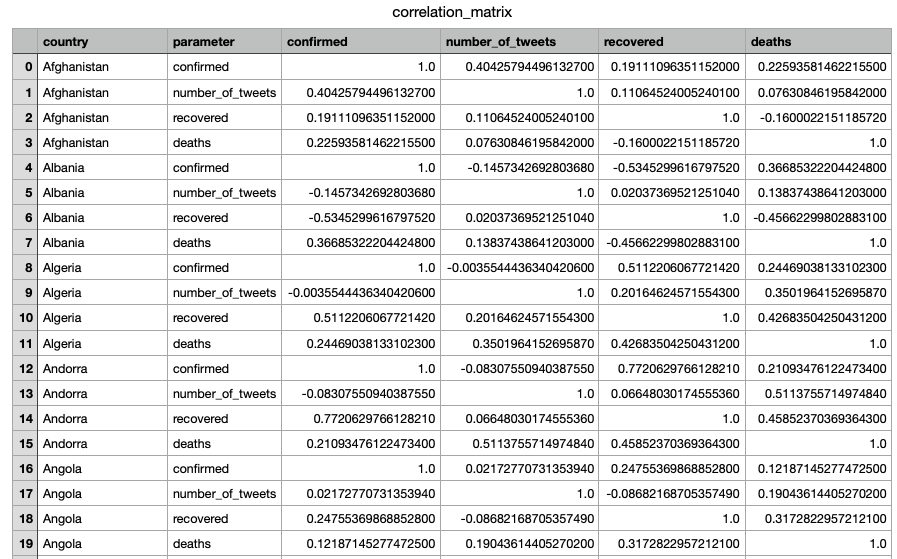
Calculates pearson pairwise correlation between the daily number of tweets from a country and the number of daily cases, deaths and recoveries. This correlation matrix is then stored into S3. Here's a snippet of what the correlation matrix looks like.
- One of the limitations of this analysis is that a lot of tweets do not include country information. So the correlation matrix should be taken with the grain of salt.
- Having more data about the users to whom the tweets belonged or the content of the tweets could help us enhance the analysis further.
In this cases instead of using python with pandas, distributed data processing framework like Apache Spark should be used for correlation matrix calculation.
Templates from airflow can be used to process the daily data and update the correlation matrix accordingly
This would mean much more load on the database and thus would require us to provision more CPU and memory. With a large user base, a distributed database would be required to handle the workload.


