New York City is one of the most populous cities in the country if not the world. A consequence of its population size is its attractiveness to rideshare and chauffeuring technology companies like Uber and Via. Consequently, as reported in January 2017 by the New York Times, yellow cabs have been outnumbered more than 4:1 by black cars in the city and revenue has dropped significantly.
Much of the reason for this desertion in the customer base is the value of convenience. The process of hailing a cab could take ~8 minutes, where as hiring a car from one’s phone takes 2-5 minutes of wait time.
To determine the value of attempting to achieve a perfect taxi system where hailing is never time consuming, we ran a comparison between the profitability of two different strategies for distributing cabs seeking customers throughout Manhattan. One acted as a control and the other implemented a slightly optimized distribution strategy. We found the optimal settings for each model and then ran them with varying initial distributions of cabs to find the average revenue they generated for a day.
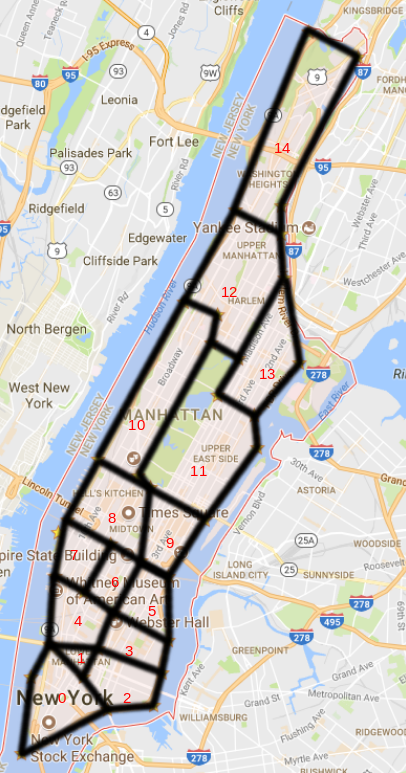
Our models implemented Markov matrices to determine the flow of cabs between 15 distinct areas of Manhattan (Fig. 1) over an entire day. Each zone was instantiated with an initial quantity of cabs dictated by a corresponding input to the model. During each ten minute time interval, a certain percentage of the cabs seeking fares moved from their current area to another area to search for customers. This percentage was based on a numerical input between 0 and 1 called “willingness”. Of these willing drivers, the control model evenly distributed them among nearby areas. In the experimental model, taxis were distributed according to the number of expected customers in each nearby area in the next time interval. Additionally, an amount of taxis in each area, according to data we obtained, would locate a fare. These cabs were removed from the system and placed in a queue, to return when they were expected to arrive at their destinations.
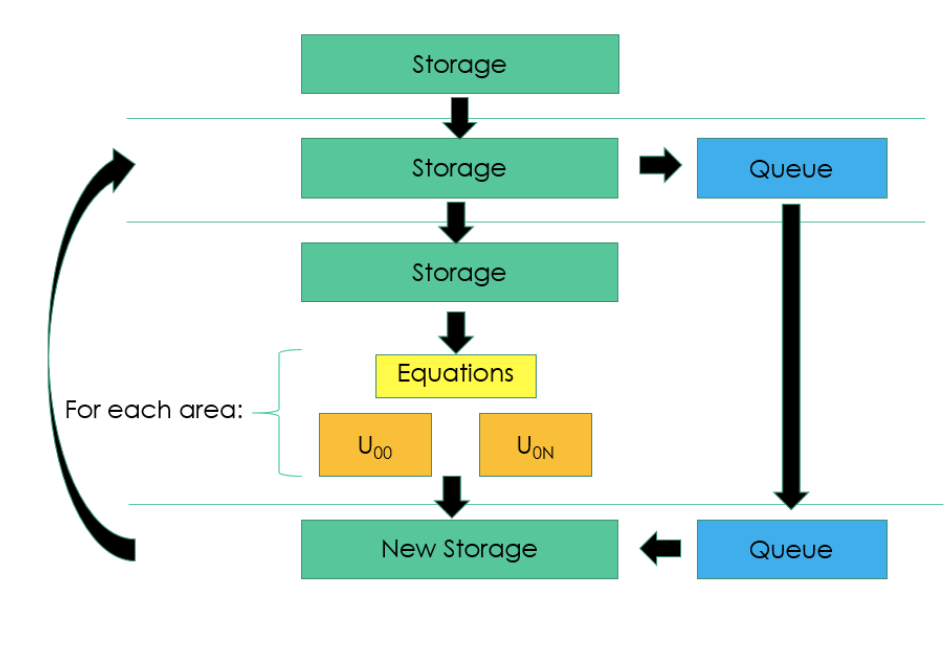
- Input willingness and initial cab quantities into storage matrix
- Calculate the number of cabs obtaining fares (UT) based on the number of cabs in an area (UA) and the expected number of customers (PT) in the given time interval
- Remove UT from the storage matrix and place them into a queue. The remaining cabs (I) are said to be idle.
- Find how many cabs are remaining in an area (U00) based on the willingness factor (w)
- The number of cabs going to another area (U0N) is different for each model: 5a. The Control has cabs equally distributed between a number of areas (L) 5b. The Experimental uses a ratio of the number of expected customers in an area (Pt+1) divided by the total number expected in all nearby areas (At+1)
- The distribution of cabs for the next time interval is applied to the storage matrix. The cabs expected to reach their destinations are removed from the queue and added to the storage matrix
- Repeat 2-6, another 143 times
if UA > PT, UT = PT; else UT = UA
I = UA - UT
U00 = I(1 - w)
Control: U0N = Iw / L
Experimental: U0N = Pt+1/At+1 * IW
Taxi and Limousine Commission Taxi Trip Data: http://www.nyc.gov/html/tlc/html/about/trip_record_data.shtml
Research supported by the Engineering Summer Math Institute, an NSF funded program under the Cornell University Engineering Success Program (CUES), award DUE #1317501. Thank you for the opportunity and guidance you have provided us this summer. Director: Cindy Mosqueda, Diversity Programs in Engineering, Cornell University
Cornell Faculty Research Mentors: Dr. Elizabeth Wesson, Center for Applied Mathematics Matt Hin, Center for Applied Mathematics