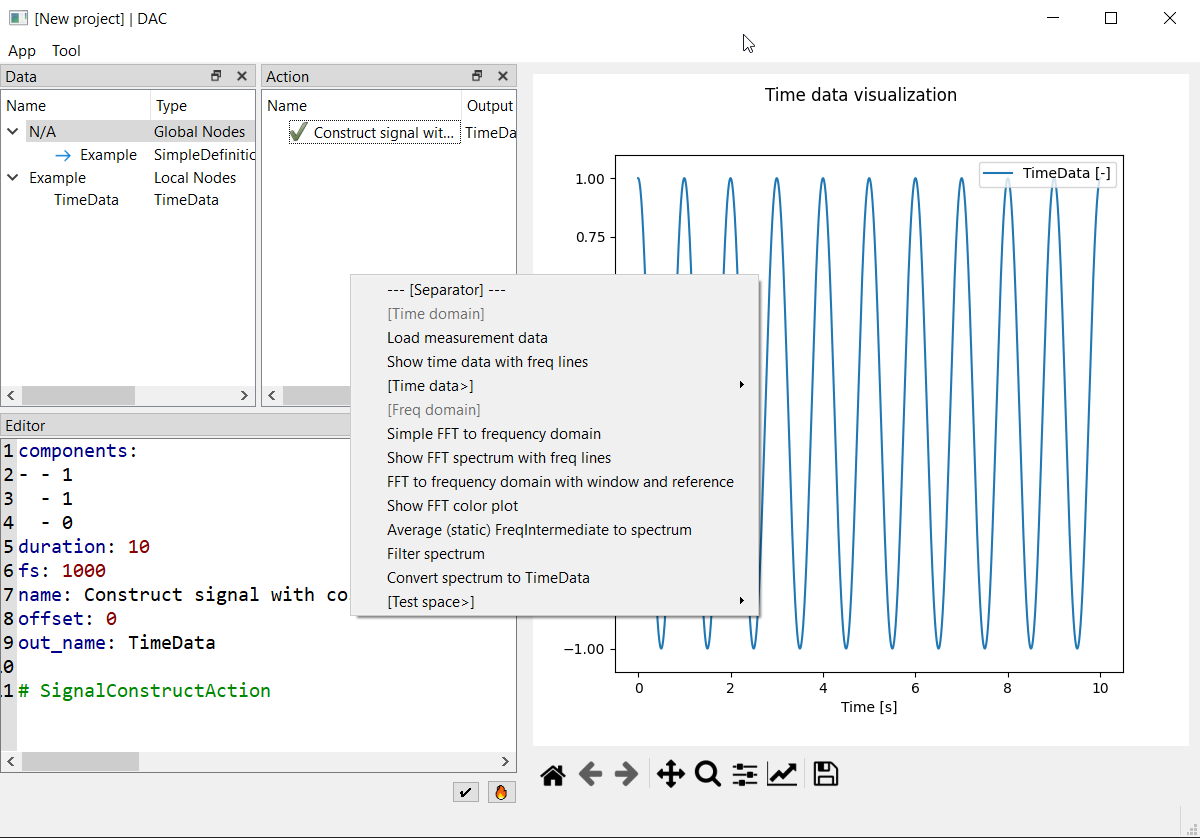
DAC provides a minimal frame for (measurement) data analysis if you want to:
- Visualize data, process and interact
- Customize your analysis
- Save the analysis and load back
- Enable multiple analysis of same processing (like batch analysis)
- Link different analysis
Example of DAC user interface as shown below:
The processing is essentially "function call to data (objects or parameters)".
The actions to data can be processing (non-interactive and time consuming, with outputs) or visualing (interactive, no output).
Predefined click-able Jupyter notebook
For multiple measurements / analyses under different conditions, the processing can be very similar, with a few parameters changed.
To enable same processing and share "variable names" among different conditions, context is used.
Quick tasks (on action node)
For parameter input, sometimes we need to interact with output of previous action and set, or we're inputting something long (e.g. a file path).
"Quick tasks" helps to fill the parameters with interactions.
Quick actions (on data node)
To explore data, actions can be created and accept the data as input. However, it costs several steps, and sometimes we want just exploring freely.
"Quick actions" creates actions virtually (not adding to project) who function to selected data nodes with default parameters. If delicate parameter tuning is required, then create a normal action.
Besides the minimal frame, this repo also provides usable modules for common measurement data analyis.
For each module (contains a bunch of analysis methods of same topic), data types and the processing/visualization methods need defined.
(scripting: use the classes directly)
A YAML file is used to control which actions are available at what context, it helps:
- Separate different analysis, keep related actions
- Use the order to guide analyzing sequence
- Easily adapt or reuse actions
