此教程专注于刚入门的小白, 且博客拥有时效性, 发布于2019年3月份, 可能后面的读者会发现一些问题, 欢迎底下评论出现的问题,我将尽可能更新解决方案。
我开始也在如何安装libsvm上出现了很多问题, 而网上的解决方案大都有一些问题,且发布时间比较早, 方案已经过时,于是我把经历的坑总结起来,供大家学习
我的matlab版本为2016a, win10系统, 安装的是最新版的libsvm, version3.2.3
http://www.csie.ntu.edu.tw/~cjlin/libsvm/
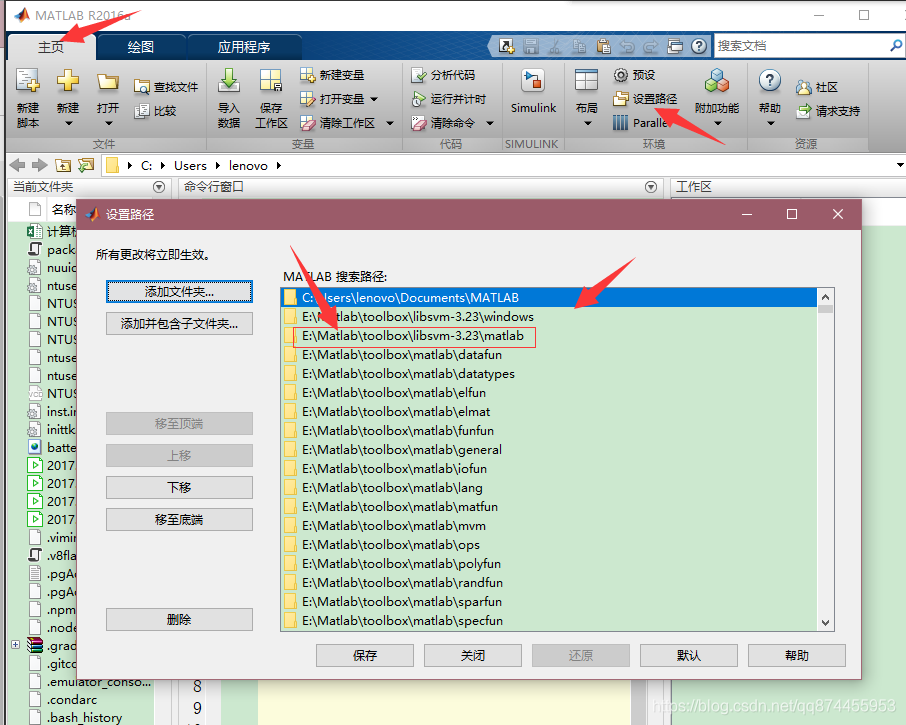
若不知道路径在哪, 可以点击设置路径来找到
注意matlab和windows这两个文件夹都要加入 否则将会出错
mex -setup
- 1
若已经安装c++编译环境则会出现下面的情况, (我已经安装过VS 2017了) 若提示没有c++编译环境则需要自己安装环境了,
直接点击用c++编译
打开当前目录下的make.m文件
将其中所的CFLAGS替换为COMPFLAGS(替换运用CTRL+F即可),替换后执行make则可以编译成功。(这里我已经改完了, 一般没改的话 都是CFLAGS) 这里也就是以前教程忽略的一点,没有这一步将出现编译失败
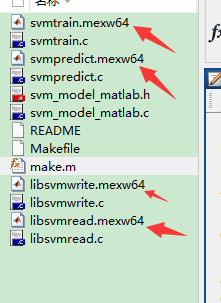
编译完之后可以得到多出的这四个后缀为mexw64文件, 这说明我们已经完成安装了
首先给出实例地址 方便下载 https://github.com/wangjiwu/BreastTissue_classify_matlab
这里给出了101个数据, 每一个数据都有9个特征和一个分类标签
clear all
clc
- 1
- 2
load BreastTissue_data.mat
- 1
- 随机产生训练集和测试集
n = randperm(size(matrix,1));
- 1
- 训练集——80个样本
train_matrix = matrix(n(1:80),:);
train_label = label(n(1:80),:);
- 1
- 2
- 测试集——26个样本
test_matrix = matrix(n(81:end),:);
test_label = label(n(81:end),:);
- 1
- 2
%% III. 数据归一化
[Train_matrix,PS] = mapminmax(train_matrix');
Train_matrix = Train_matrix';
Test_matrix = mapminmax('apply',test_matrix',PS);
Test_matrix = Test_matrix';
- 1
- 2
- 3
- 4
- 5
- 6
这里使用的是交叉验证的方法 选出等距的多种c和g训练找到最合适的c和g,如果训练时间较长可以直接输入参数,跳过这一步
cmd = ' -t 2 -c 42.2243 -g 2.639'
- 1
若参数不知道具体的代表意思可参考此博客
https://blog.csdn.net/mrfortitude/article/details/59558037
[c,g] = meshgrid(-10:0.2:10,-10:0.2:10);
[m,n] = size(c);
cg = zeros(m,n);
eps = 10^(-4);
v = 5;
bestc = 1;
bestg = 0.1;
bestacc = 0;
for i = 1:m
    for j = 1:n
        cmd = ['-v ',num2str(v),' -t 2',' -c ',num2str(2^c(i,j)),' -g ',num2str(2^g(i,j))];
        cg(i,j) = svmtrain(train_label,Train_matrix,cmd);
        if cg(i,j) > bestacc
            bestacc = cg(i,j);
            bestc = 2^c(i,j);
            bestg = 2^g(i,j);
        end
        if abs( cg(i,j)-bestacc )<=eps && bestc > 2^c(i,j)
            bestacc = cg(i,j);
            bestc = 2^c(i,j);
            bestg = 2^g(i,j);
        end
    end
end
cmd = [' -t 2',' -c ',num2str(bestc),' -g ',num2str(bestg)];
- 1
- 2
- 3
- 4
- 5
- 6
- 7
- 8
- 9
- 10
- 11
- 12
- 13
- 14
- 15
- 16
- 17
- 18
- 19
- 20
- 21
- 22
- 23
- 24
- 25
创建/训练SVM模型
model = svmtrain(train_label,Train_matrix,cmd);
- 1
注意一定要 传入3个参数而不是两个, 且 测试lable 是m1的矩阵, 测试矩阵是mn的矩阵 m为样本个数, n为特征个数
[predict_label_1,accuracy_1,prob_estimates] = svmpredict(train_label,Train_matrix,model);
[predict_label_2,accuracy_2,prob_estimates2] = svmpredict(test_label,Test_matrix,model);
result_1 = [train_label predict_label_1];
result_2 = [test_label predict_label_2];
- 1
- 2
- 3
- 4
figure
plot(1:length(test_label),test_label,'r-*')
hold on
plot(1:length(test_label),predict_label_2,'b:o')
grid on
legend('真实类别','预测类别')
xlabel('测试集样本编号')
ylabel('测试集样本类别')
string = {'测试集SVM预测结果对比(RBF核函数)';
          ['accuracy = ' num2str(accuracy_2(1)) '%']};
title(string)
- 1
- 2
- 3
- 4
- 5
- 6
- 7
- 8
- 9
- 10
- 11
</div>


