🛍️🌐 Predicting Delivery Times Using A Real, Commercial Brazilian E-Commerce Dataset 🇧🇷💰
==============================
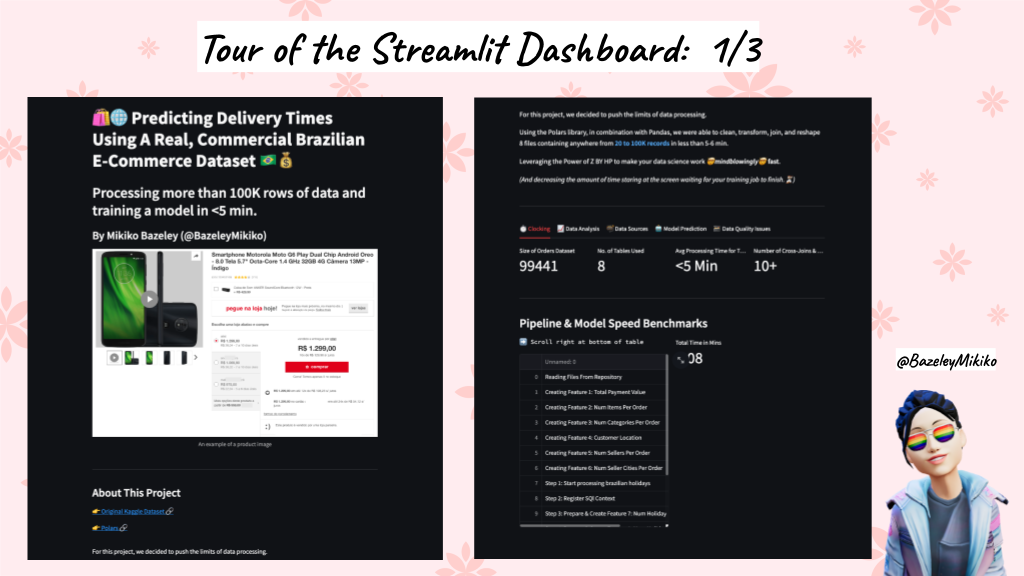
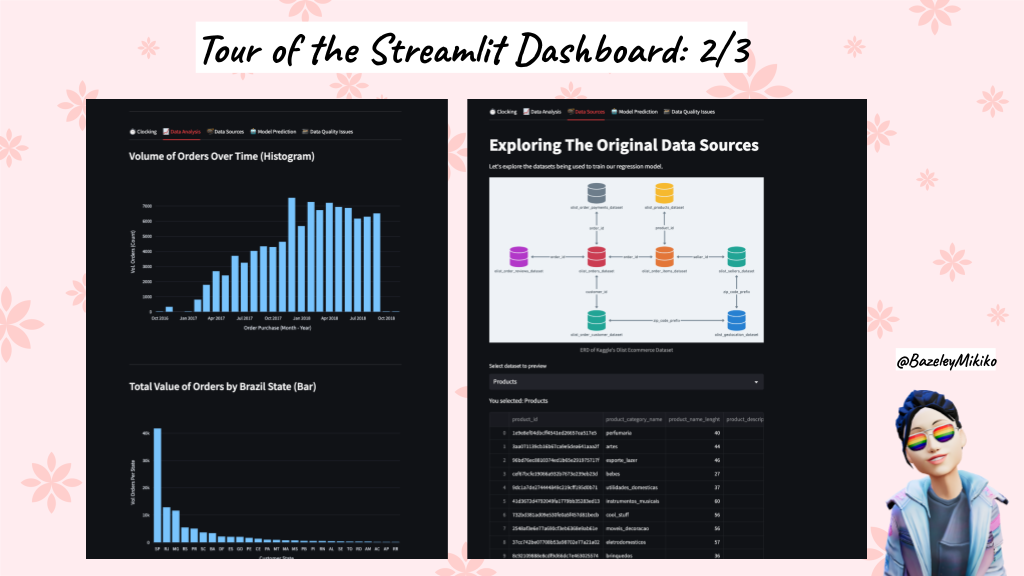
In this project, we develop a regression model to predict how long it'll take for an order to be delivered for using the Olist Ecommerce Dataset available on Kaggle.
Summary
For this project, we decided to push the limits of data processing.
Using the Polars library, in combination with Pandas, we were able to clean, transform, join, and reshape 8 files containing anywhere from [20 to 100K records] in less than 5-6 min.
Leveraging the Power of Z BY HP to make your data science work 🤯mindblowingly🤯 fast.
(And decreasing the amount of time staring at the screen waiting for your training job to finish.⏳)
Instructions
- Clone this Git repository using the following command:
git clone https://github.com/MMBazel/Kaggle-Brazilian-Ecommerce-Prediction.git - Using the terminal or command prompt,
cdintoKaggle-Brazilian-Ecommerce-Prediction - Check if you have Python installed on your machine by typing
python --versionin your terminal or command prompt window. If Python is not installed, download and install Python from the official website. - Create a virtual environment for the project using the following command:
python -m venv <YOUR_ENV_NAME>
- Activate the virtual environment using the following command:
- On Windows:
- If you're using command line:
<YOUR_ENV_NAME>\Scripts\activate.bat - If you're using PowerShell:
<YOUR_ENV_NAME>\Scripts\Activate.ps1
- If you're using command line:
- On Linux/Mac: source
<YOUR_ENV_NAME>/bin/activate
- On Windows:
- Install the required packages using pip by running the following command:
pip install -r requirements.txt
- Manually (or programatically) unzip the different data sources in
/data/raw/and/data/backup/. - Make sure you're in the root folder. In your terminal run the command:
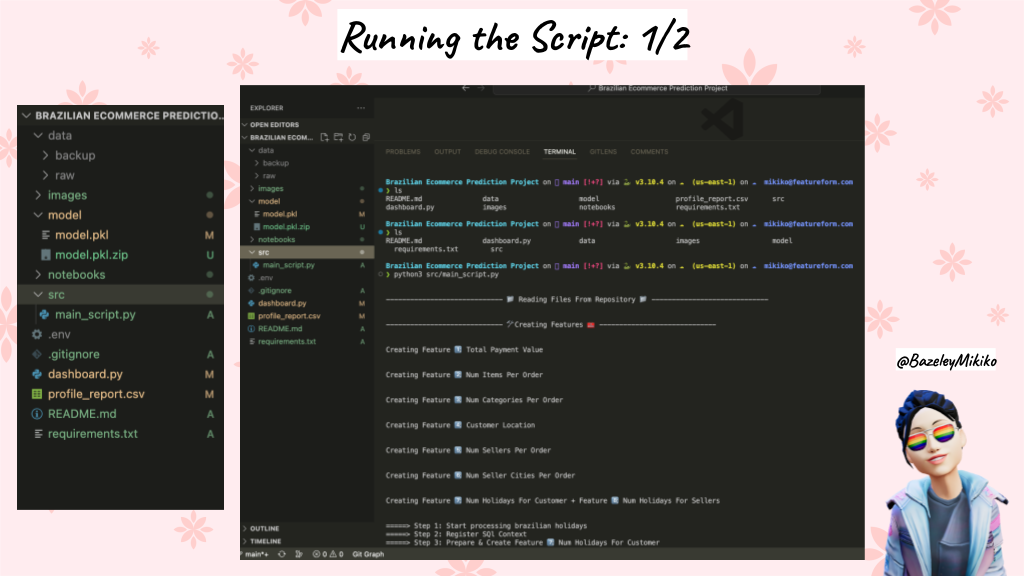
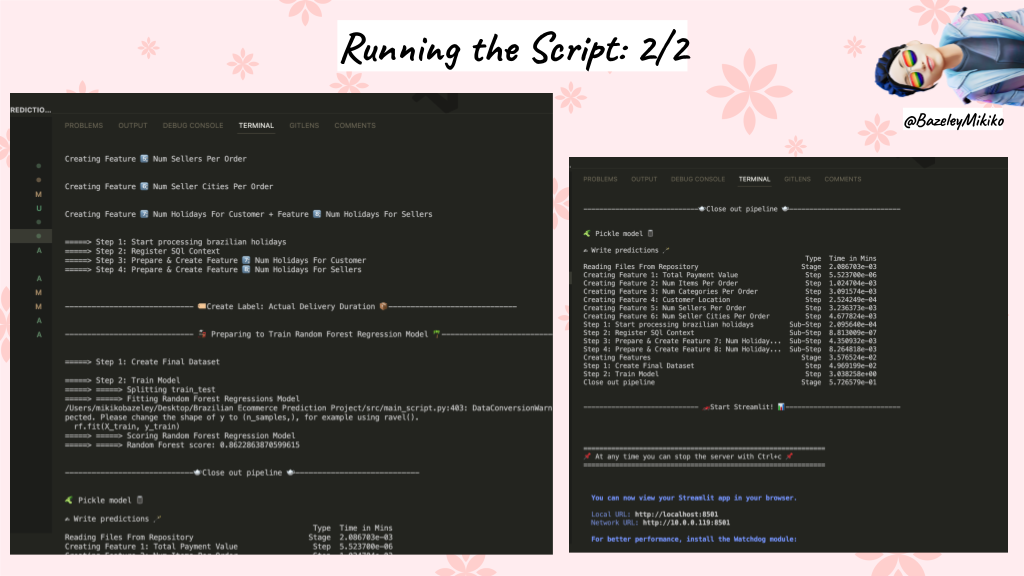
python3 src/main_script.py
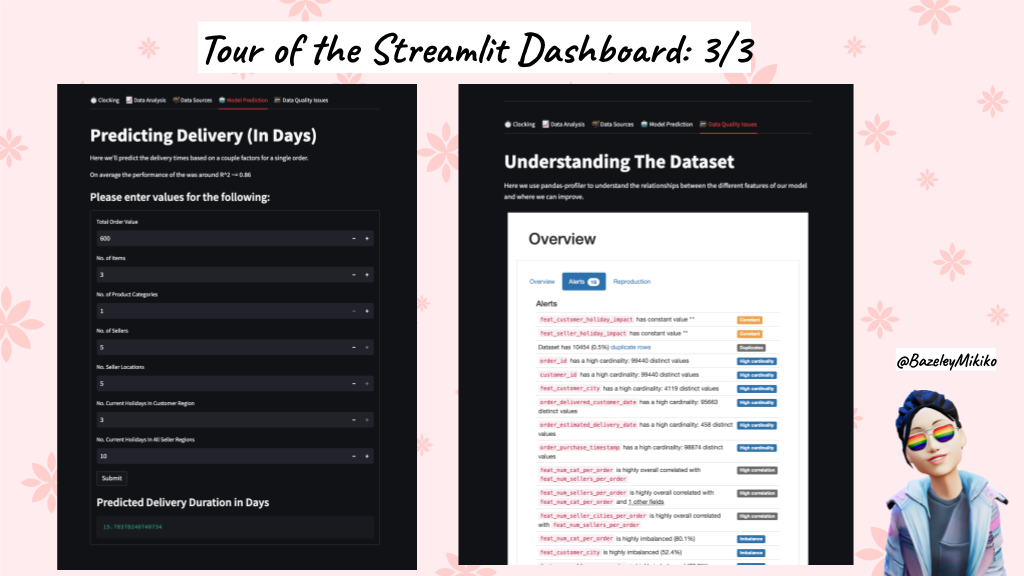
- If the program has run successfully, a streamlit dashboard should open in a browser window.
- When you're finished, hit
Ctrl+Cto exit streamlit.
Project Organization
├── README.md          <- The top-level README for developers using this project.
├── data
│   ├── raw       <- Data needed for the pipeline. Make sure everything has been unzipped.
│   └── backup            <- Backup files for the Streamlit dashboard. Makesure they're unzipped.
│
├── models             <- Trained and serialized models, model predictions, or model summaries
│
├── notebooks          <- Jupyter notebooks. Naming convention is a number (for ordering),
│                         the creator's initials, and a short `-` delimited description, e.g.
│                         `1.0-jqp-initial-data-exploration`.
│
├── requirements.txt   <- The requirements file for reproducing the analysis environment, e.g.
│                         generated with `pip freeze > requirements.txt`
│
├── src                <- Source code for use in this project.
│   │
│   └── main_script.py  <- The only script that needs to be run with `python3 src/main_script.py`.
│                          Make sure you're in the right folder.
├── dashboard.py          <- Script for the Streamlit dashboard.
Running The Script
📹 Video 📹
- 👉 Watch my screenshare of the Streamlit dashboard running here:
YOUTOUBE VIDEO HERE: Brazilian Ecommerce: Running The Script - Part 1 - 👉 Watch my screenshare of the Streamlit dashboard running here:
YOUTOUBE VIDEO HERE: Brazilian Ecommerce: Running The Script - Part 2
Screenshots
Playing With The Dashboard
📹 Video 📹
- 👉 Watch my screenshare of the Streamlit dashboard running here:
YOUTOUBE VIDEO HERE: Dashboard - Tour of Brazilian Ecommerce Prediction Streamlit Dashboard
