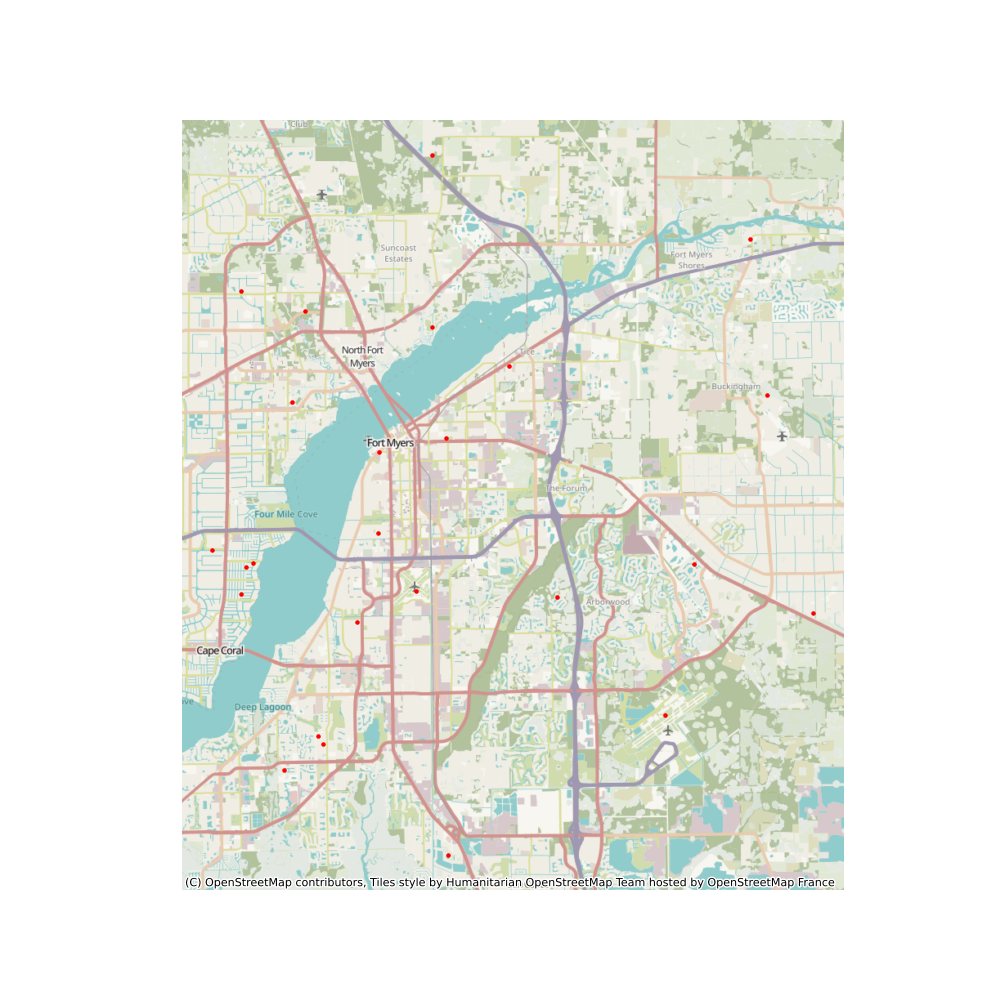
This Python script is designed for handling and analyzing tide and precipitation data. It includes functions to read data, clip it to specific dates, check data quality, perform seasonal analysis, and plot results. The script operates on CSV data files and produces a variety of plots and cleaned data files.
Prerequisites Python Version: Ensure Python 3.x is installed. Required Libraries: pandas, matplotlib, seaborn, geopandas, contextily, scipy, and numpy. Anaconda: An Anaconda environment with the required libraries can be used for an easier setup.
Usage Instructions
- Data Files: Ensure you have the CSV files for both tide and precipitation data as expected by the read_tide_data and read_precip_data functions. The files should be named and placed according to the paths specified in the script or adjusted accordingly in the script.
- Running the Script: The script is designed to be run as a standalone Python program: python ABE651 FinalProject.py
- Input Parameters: The script is currently set up to read specific file paths hardcoded into the script. If you have different files or paths, modify the paths in the script accordingly.
- Outputs: You will need to create a directory called Figures. Plots: Plots are saved in a directory called Figures. Ensure this directory exists or modify the script to create it if necessary. Data Files: Cleaned data files are written back to CSV files specified within the script. Adjust paths and filenames as necessary.
Specialized Code => The script uses geopandas for handling geographical data and plotting maps. Ensure geopandas and its dependencies are installed. => contextily is used to add basemaps to geographical plots. It requires an internet connection to fetch tiles.
Code Structure
- Functions: Each type of operation (e.g., data reading, data clipping, plotting) is encapsulated in functions. This modular design makes the code reusable and maintainable.
- Data Quality Checks: Functions are provided to handle various data quality issues, such as missing values, erroneous values, and outliers.
- Plotting: Separate functions are used for different types of plots, including time series plots, histograms, and scatter plots. This is done using matplotlib and seaborn.
Special Notes Before running the script, adjust file paths and directories according to your local environment. The script assumes data in specific formats. If your data differs, you may need to modify the corresponding data handling functions
