This project involves analyzing a company's total sales across various branches using Power BI.
Report

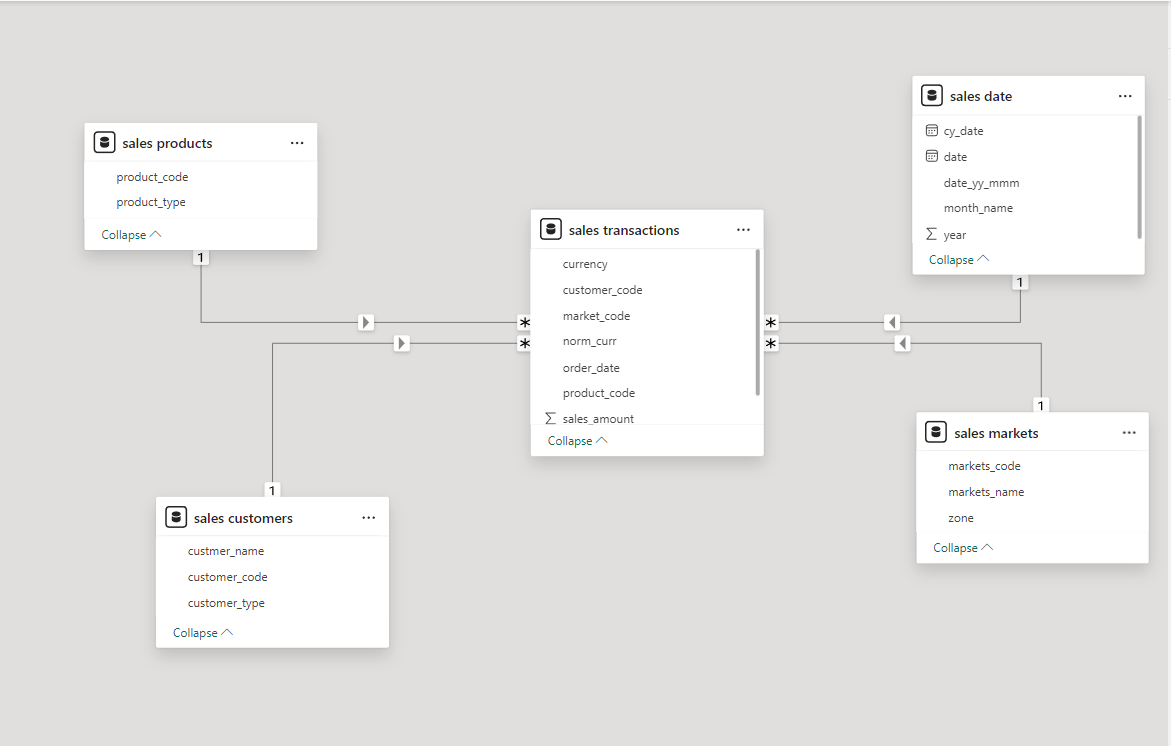
The data is structured using a Star Schema model.
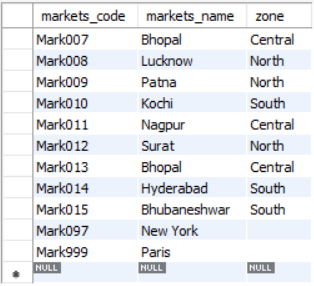
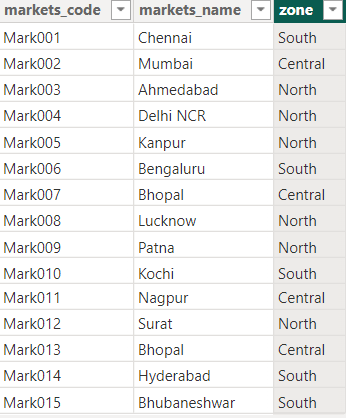
- Removed Non-India Entries: Excluded transactions without a region specified, as they were outside India. The focus is solely on transactions within India, where the company operates.
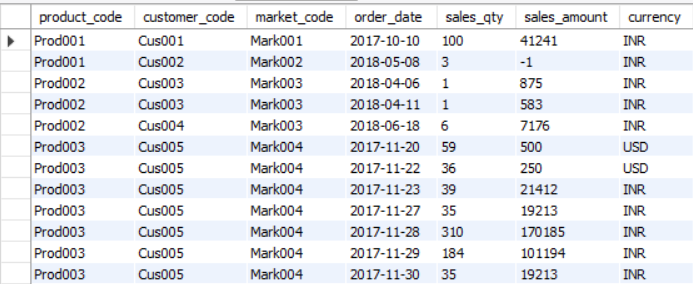
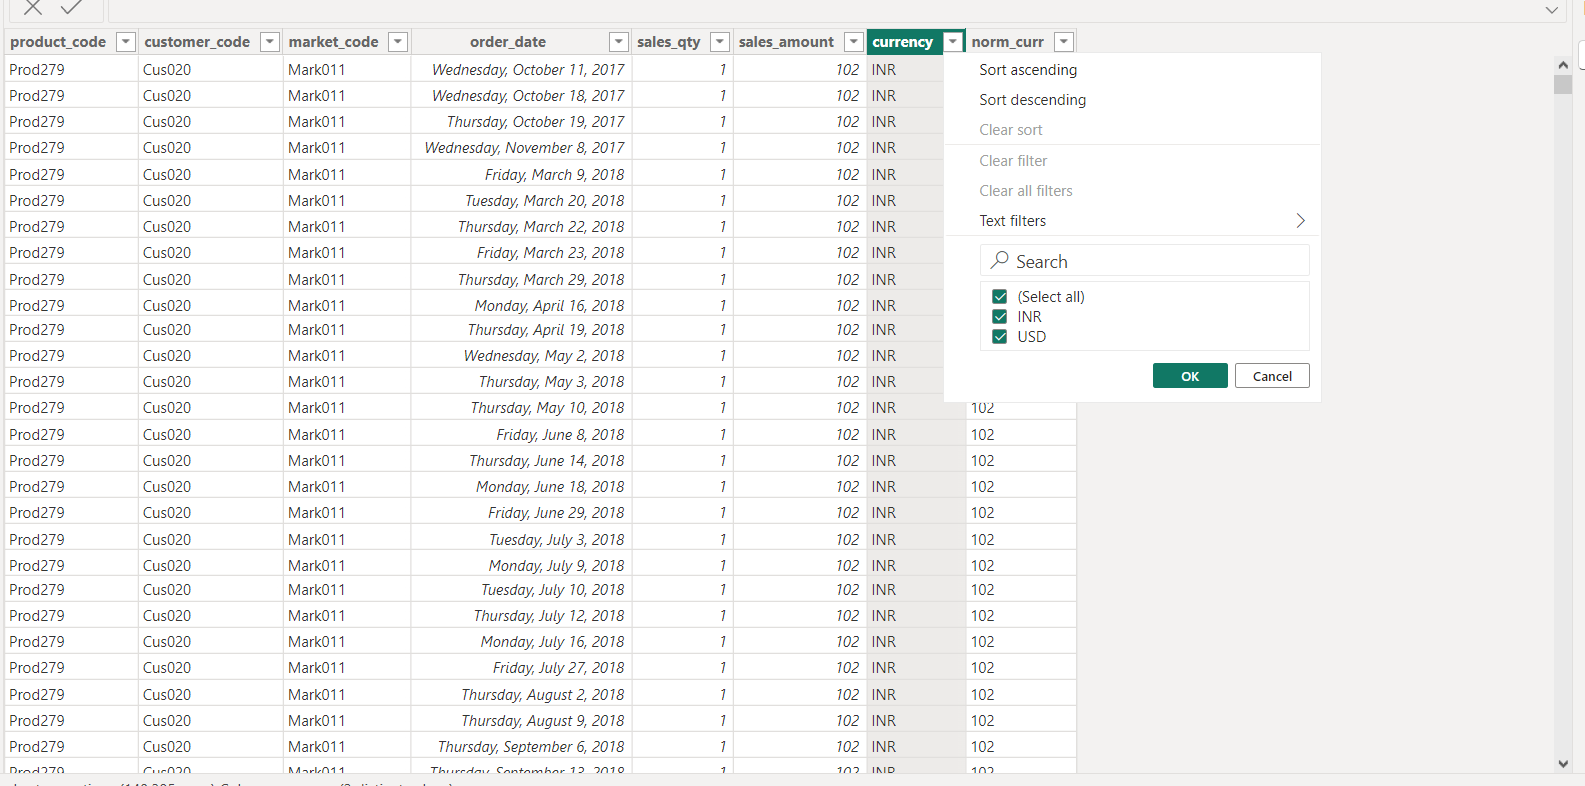
- Removed Invalid Entries: Excluded transactions with a sales amount of zero or negative. Added a new column
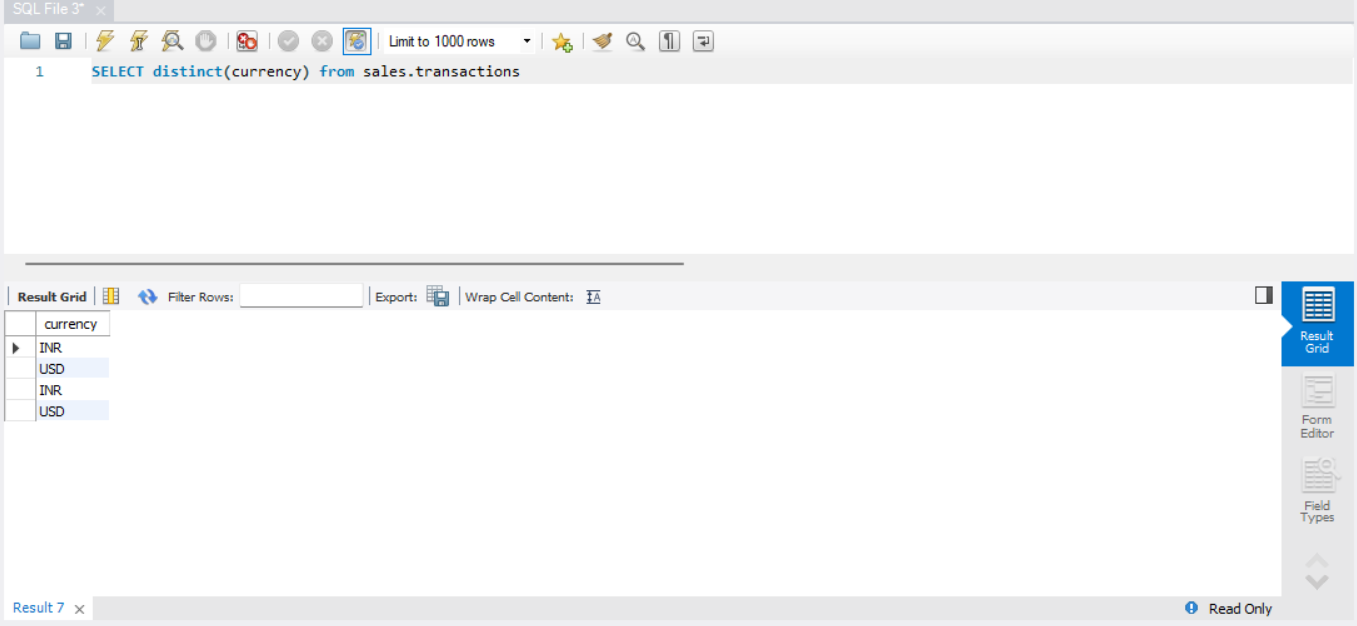
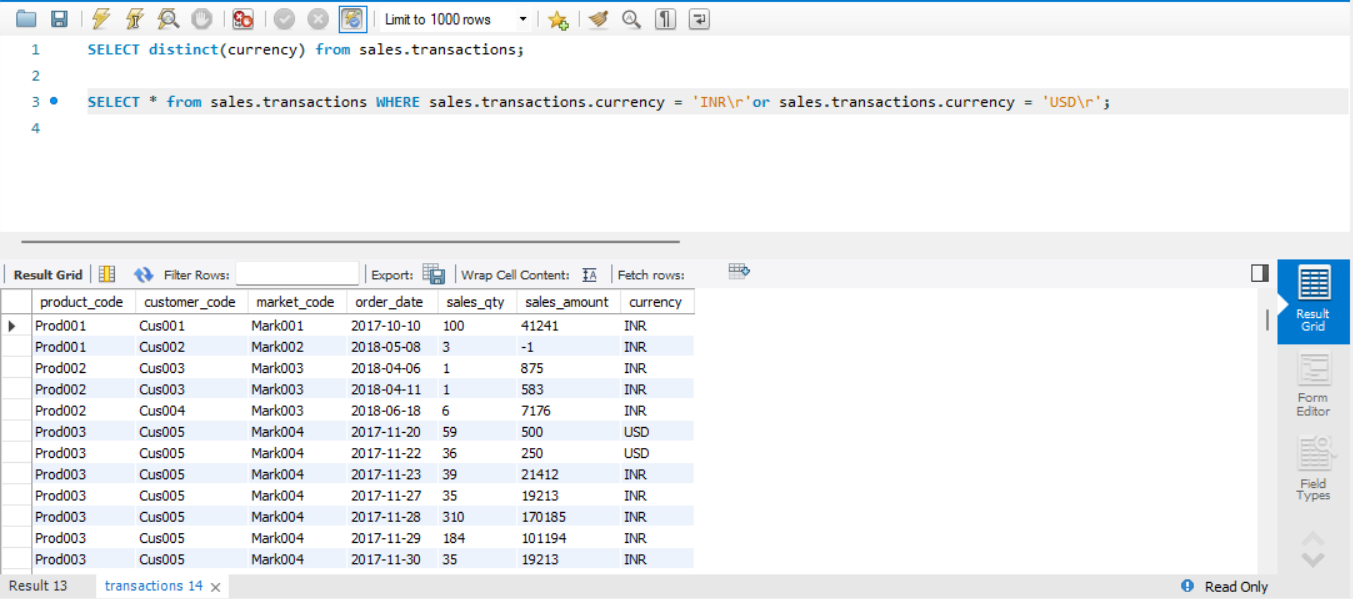
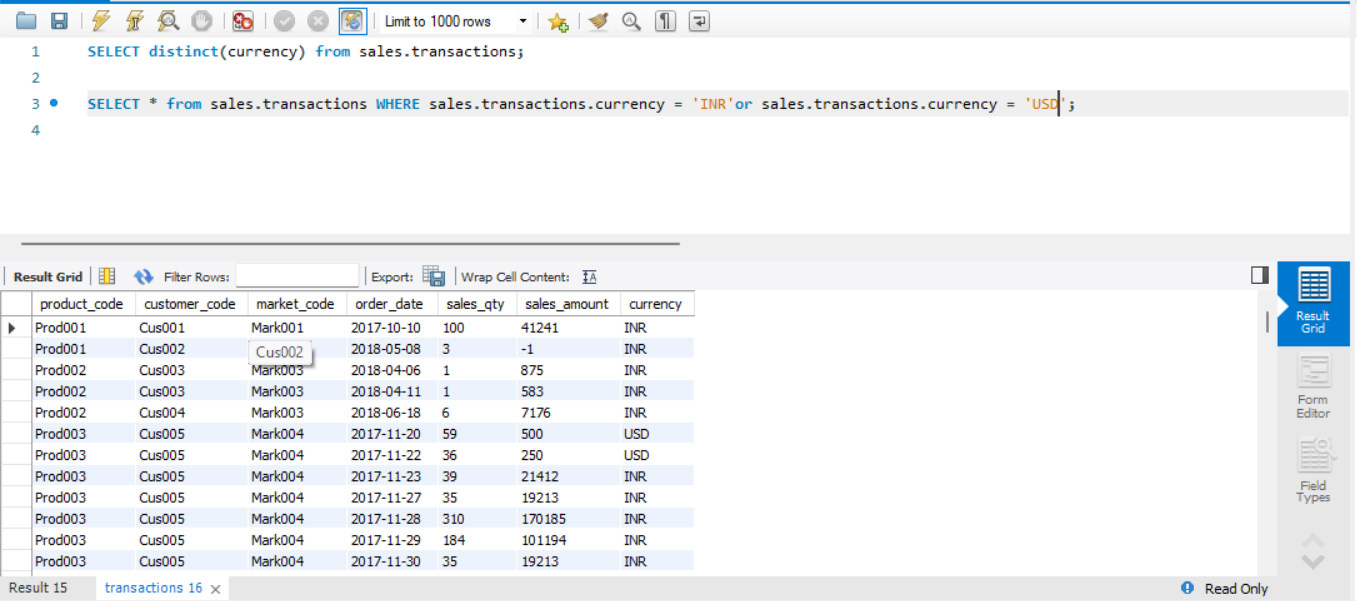
norm_curr, converting all USD amounts to INR for consistency (1 USD = 83 INR). - Handled Currency Duplicates: Addressed data duplication due to inconsistent currency types (
INR,INR/r,USD,USD/r). Kept the rows withINR/randUSD/ras they had more reliable data and removed the duplicates (INRandUSD).
- Data Modeling
- Power BI
- Data Transformation and Cleaning
- Exploratory Data Analysis
This project is based on a coding challenge from the Codebasics YouTube channel's Sales Insights Power BI project. Special thanks to Codebasics for the guidance and resources.
