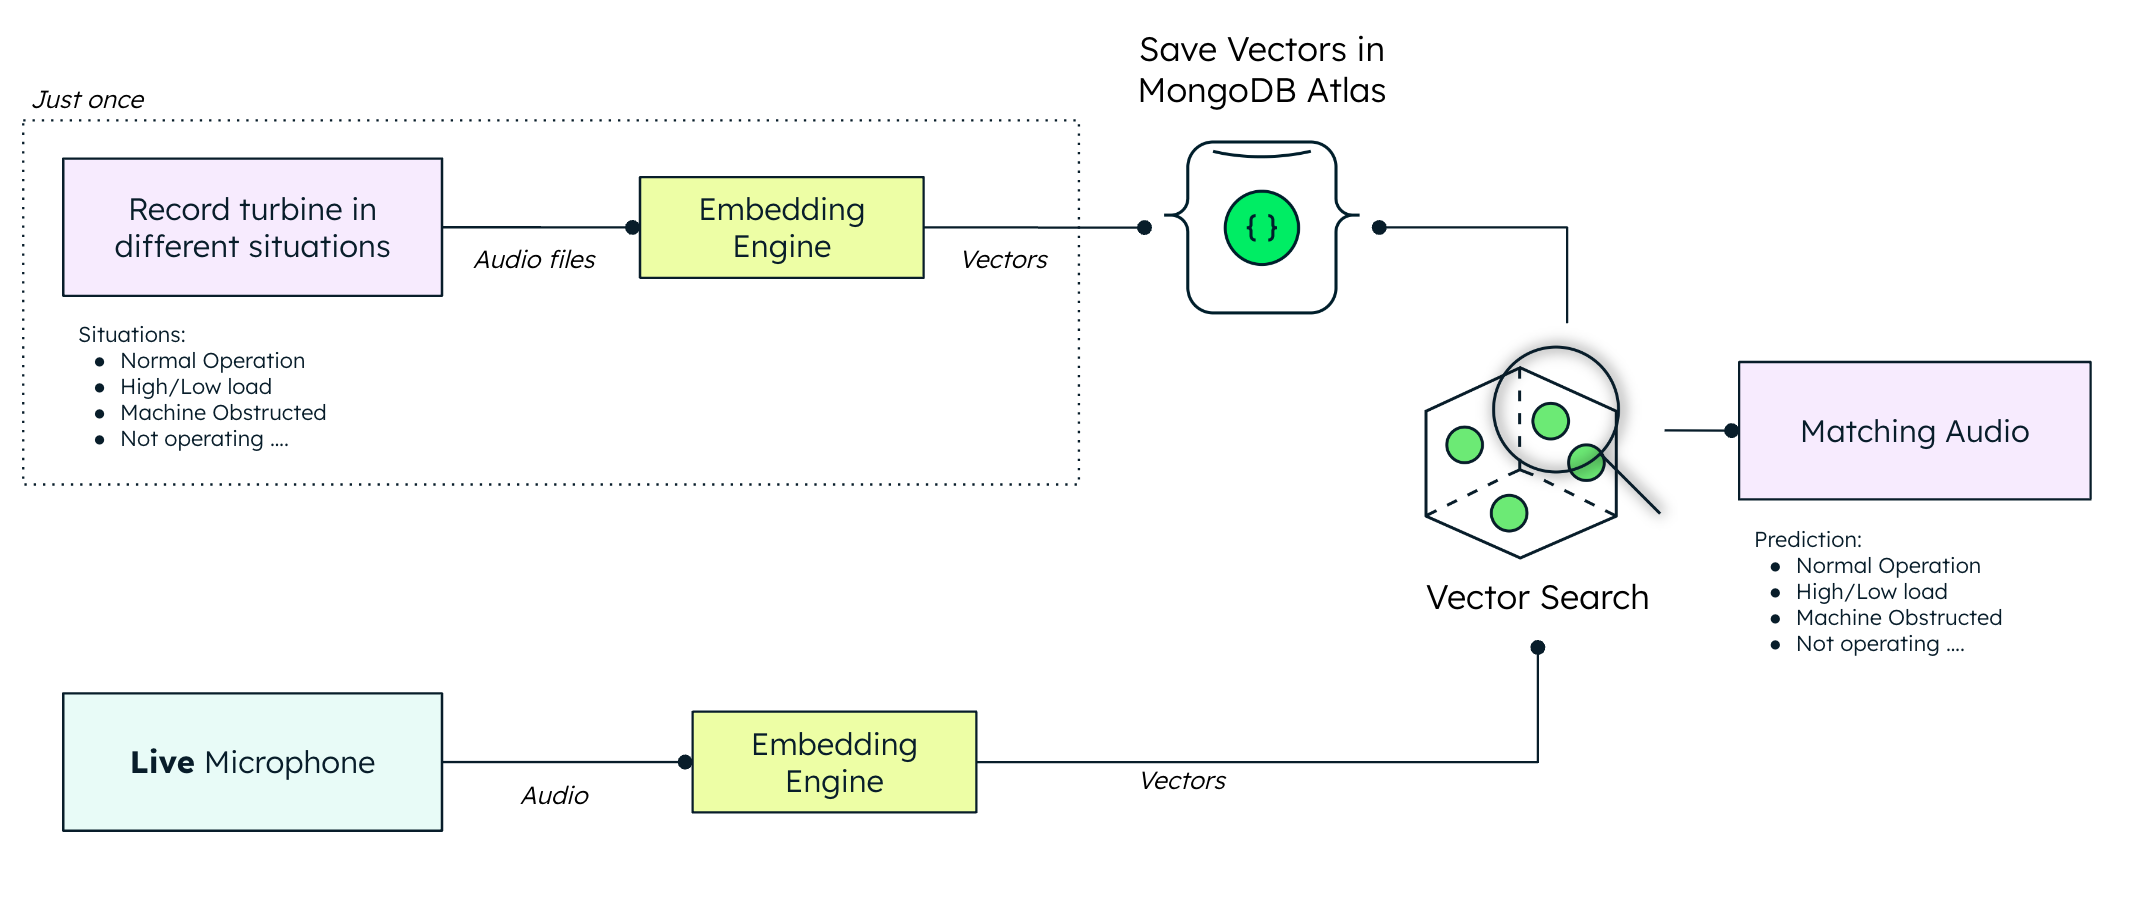
A tongue-in-cheek demonstration of MongoDB's Vector Search capabilities for anomaly detection through sound input, using a basic handheld fan as our makeshift wind turbine. This demo enables real-time diagnosis by analyzing the emitted audio, allowing us to diagnose its condition—whether it's operating normally, stopped, or experiencing any issues.
- Install Node.js
- Tested with Node.js v20.8.0
Create a file called .env in the main directory alongside the add_audio.py file and add your atlas connection string, in the following format:
MONGO_CONNECTION_STRING="mongodb+srv://connectionstringfromatlas"
Then copy this file in to the nodeUI directory too.
Install the required python modules.
pip install pyaudio
pip install numpy
pip install pymongo
pip install librosa
pip install panns_inference
pip install torch
pip install python-dotenv
pip install certifi
Run python add_audio.py
Select the audio input by typing the relevant number and then press enter. Record each sound in sequence.
Tip
We recommend using an external microphone and placing it very close to the fan or audio source.
Go to MongoDB Atlas and create an Atlas Search Index in the audio database sounds collection and using the content of searchindex.json
{
    "mappings": {
      "dynamic": true,
      "fields": {
        "emb": {
          "dimensions": 2048,
          "similarity": "cosine",
          "type": "knnVector"
        }
      }
    }
  }
Run python live_query.py and place your microphone next to the fan.
Switch to a new console and cd to the 'nodeUI' directory.
Run npm install
Run node nodeui.js
Use a browser to open the link http://localhost:3000/
In Atlas, go to charts and click the down arrow next to Add Dashboard then click import dashboard.
Select the file Sounds.charts and click next.
Click on the pencil icon and ensure the database and collection match audio and results.
Click 'Save', and the 'Save'.
Click the new dashboard 'Sounds' to see analytics on the sounds that are being detected by the microphone.
