Analysis of public data of river organic pollution in South Korea.
This is a quick Exploratory Data Analysis (EDA) of a public dataset of Biochemical Oxygen Demand (BOD) measurements from 7 spots somewhere in South Korea in the period form 1992 to 2016 :) The aim of this analysis is to find the missing values to assess the reliabiltiy of the measurements, the distribution of the BOD values at different sites and finally the major trends over time.
The following datasets used in the analysis are:
-
river_metadata.csv This is a metadata about the measurements' spots. This dataset consist of 4 columns:
river_idwhich is obviously the river IDriver_namethis on isn't obvious at all and wouldn't even read out on my computer :(norththe 'N' coordinate of the site in the formate (degree.minute.seconds)eastthe 'E' coordinate of the site in the formate (degree.minute.seconds)
-
bod.csv This is the measurements (BOD) from the period from 1992 to 2016. This dataset consist of 7 columns and 300 rows. Eache represnet a single BOD measurement each month for 25 years at a particular site.
-
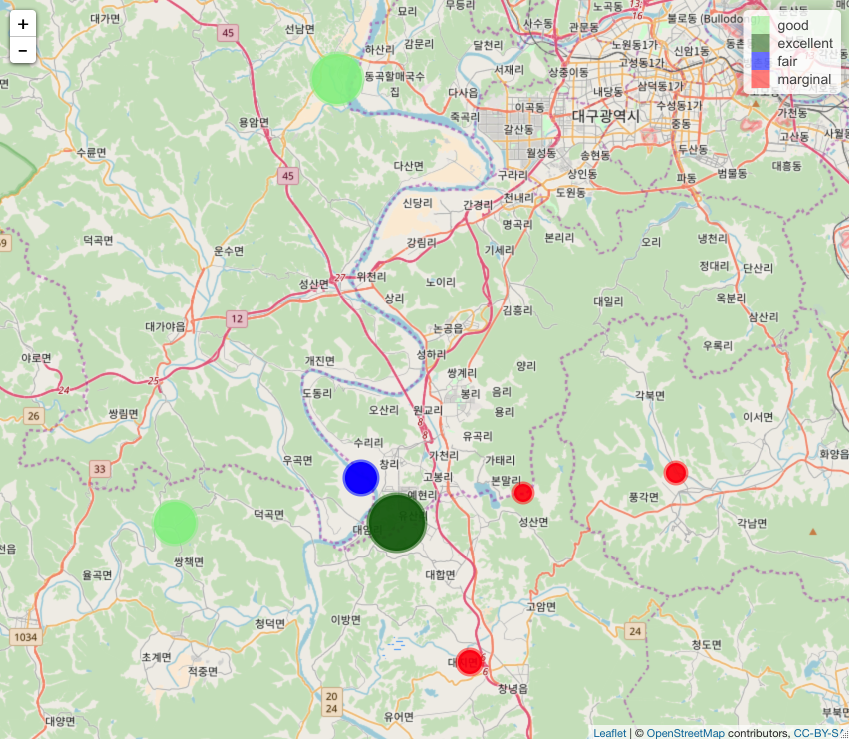
score.csv This is some score and a category - that I don't understand :P
river_idthe same river IDs mentioned abovescoresome number!categorya category based on the number much like an elementary school grade category (excellent, good, fair)
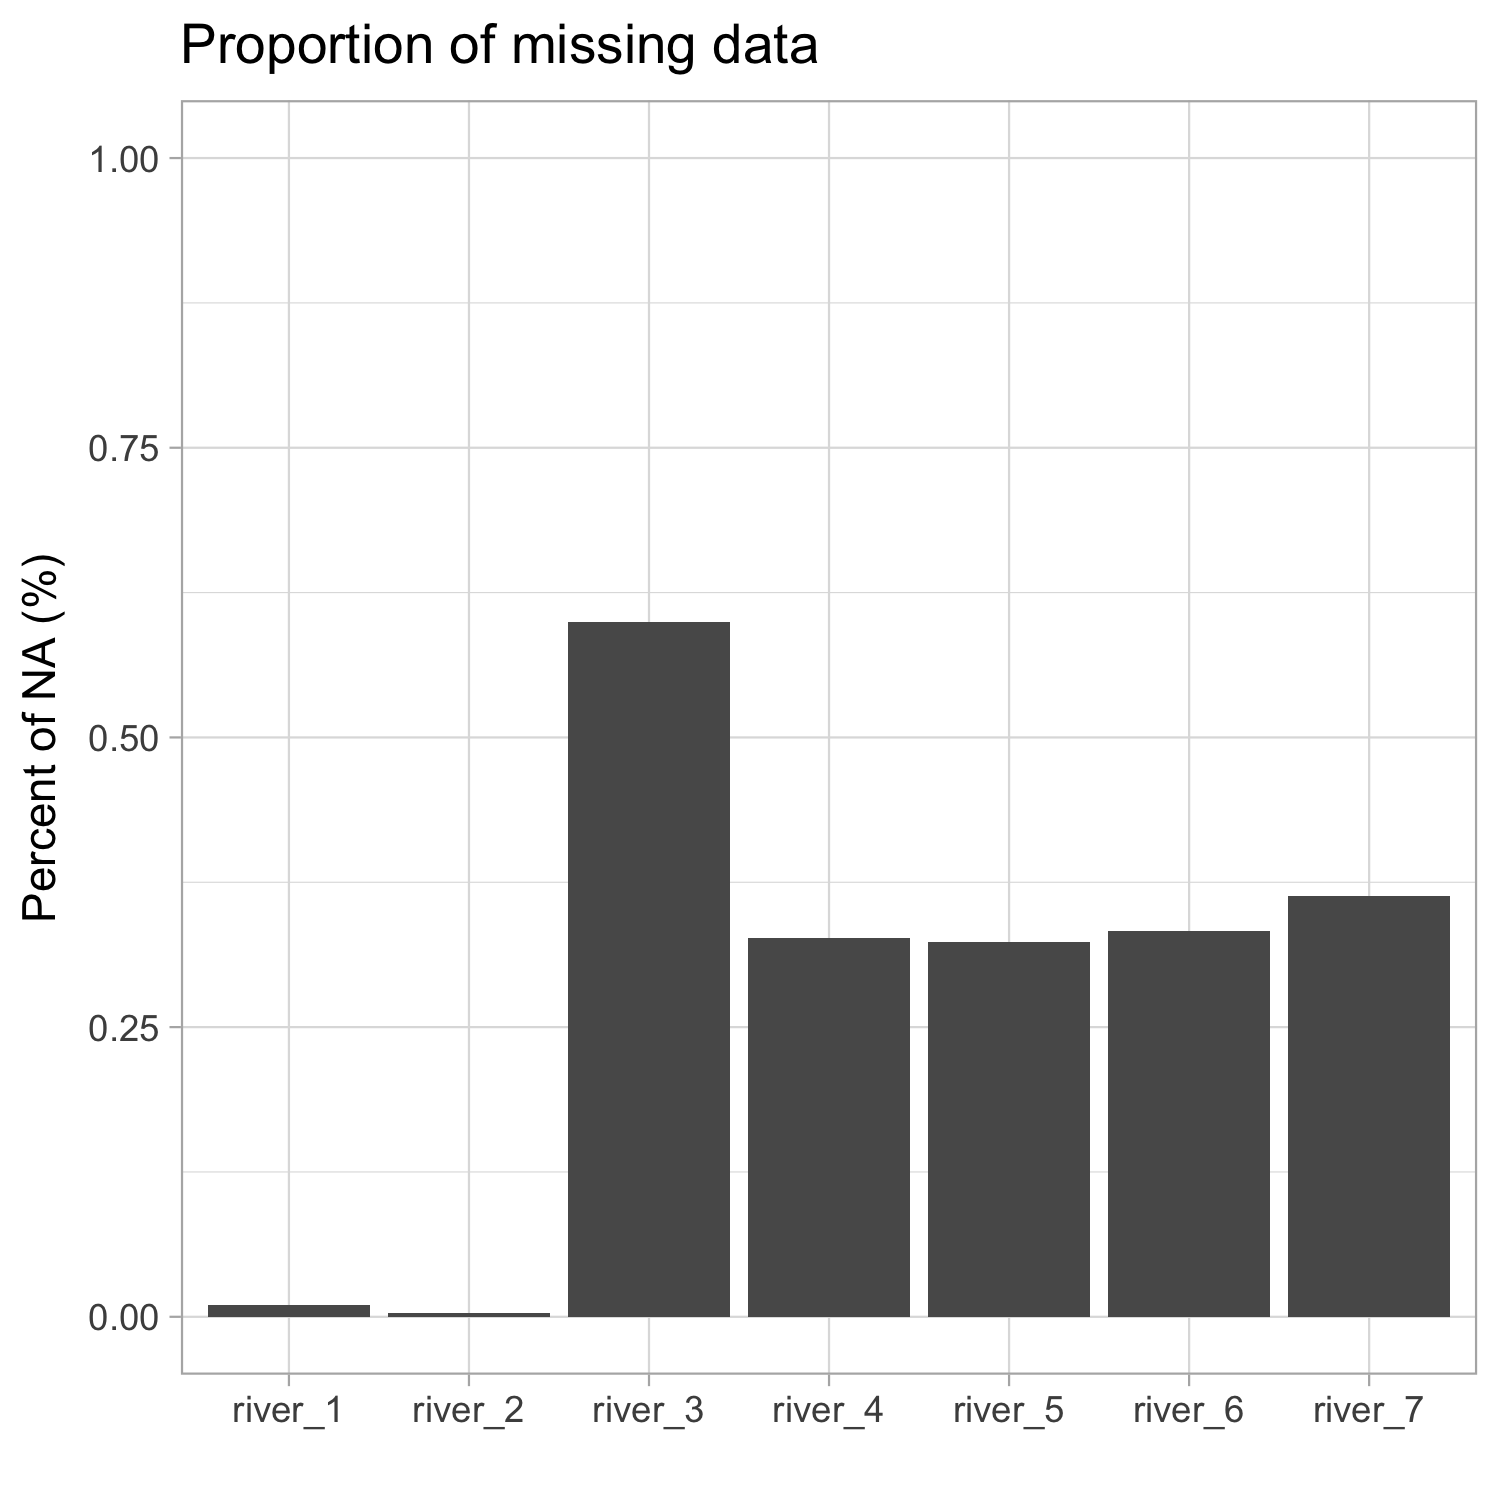
- Proportion of missing data
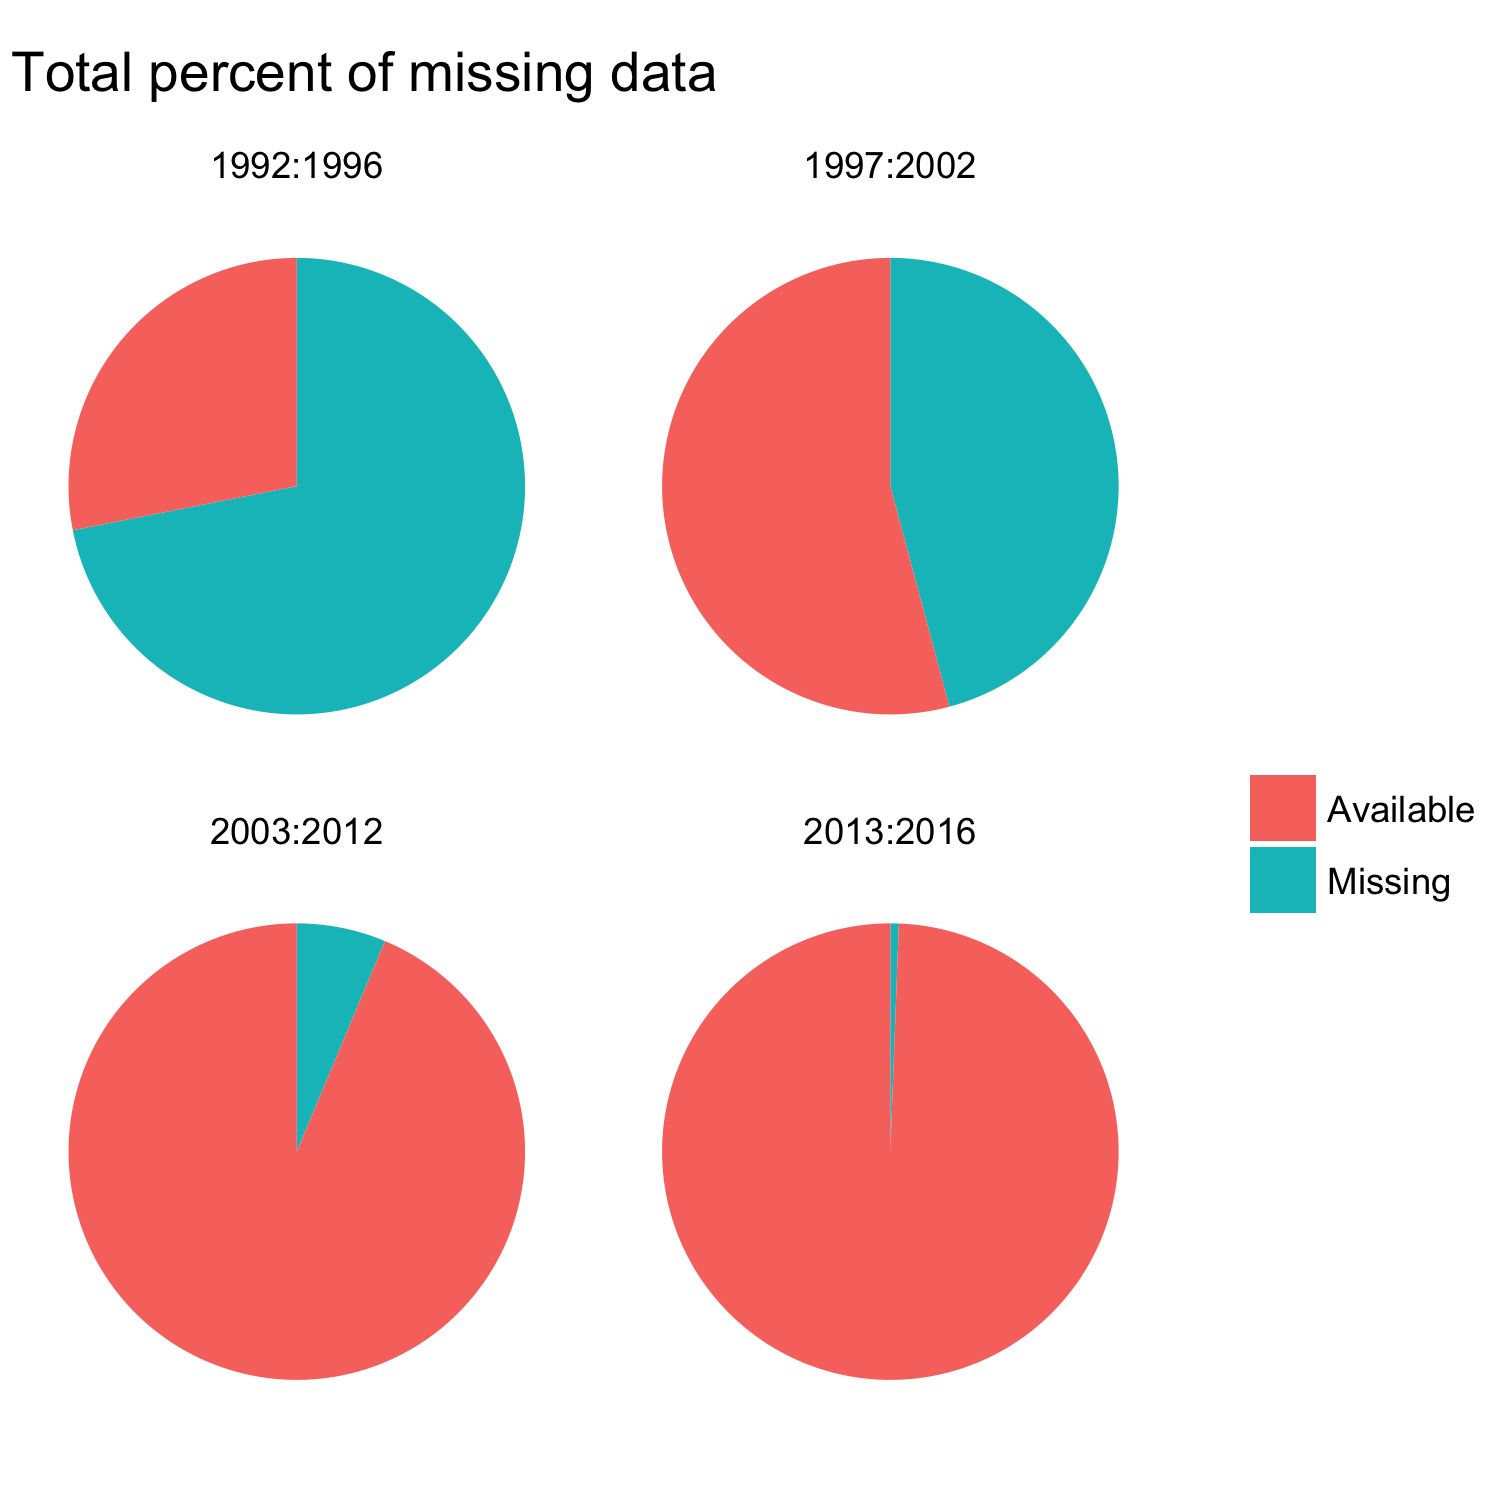
- Total percent of missing data


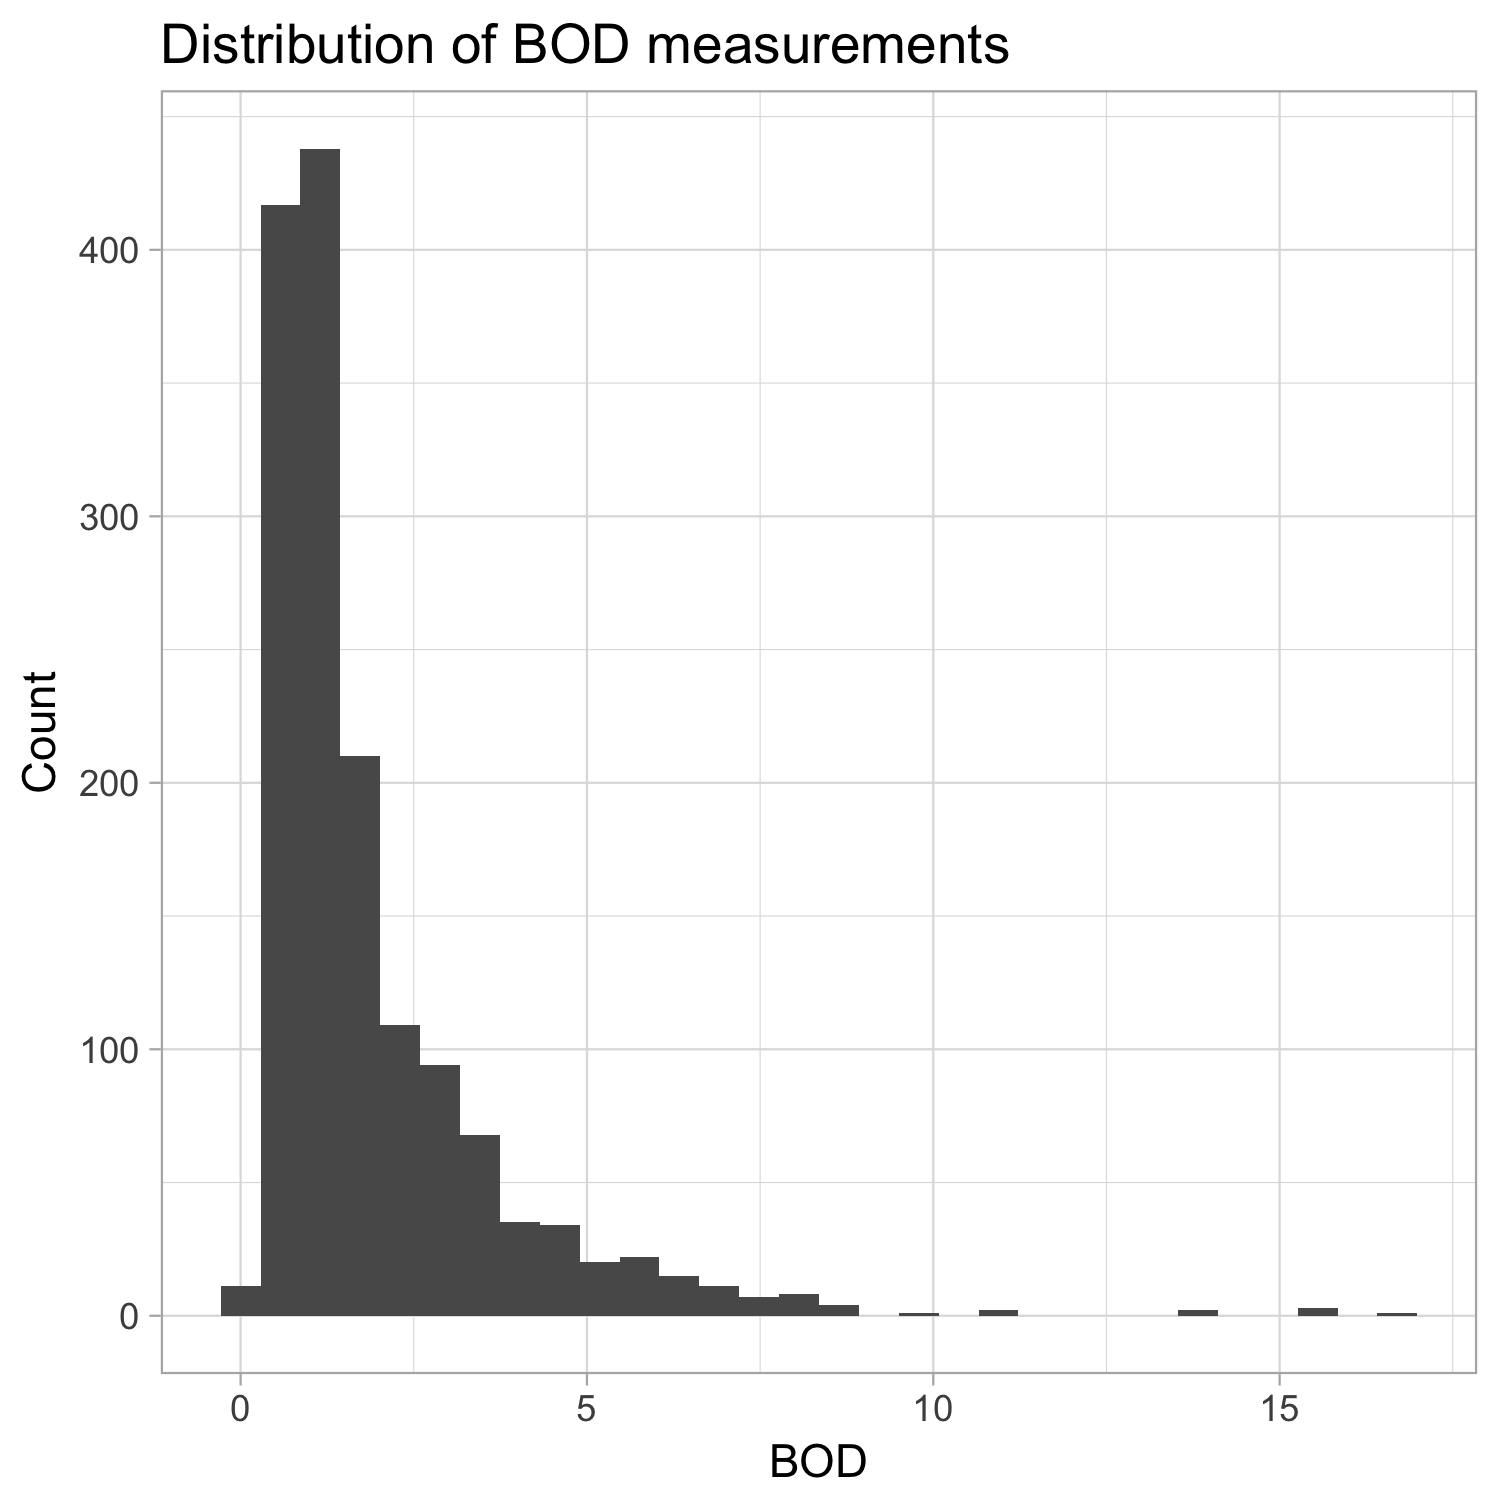
- Distribution of BOD measurements
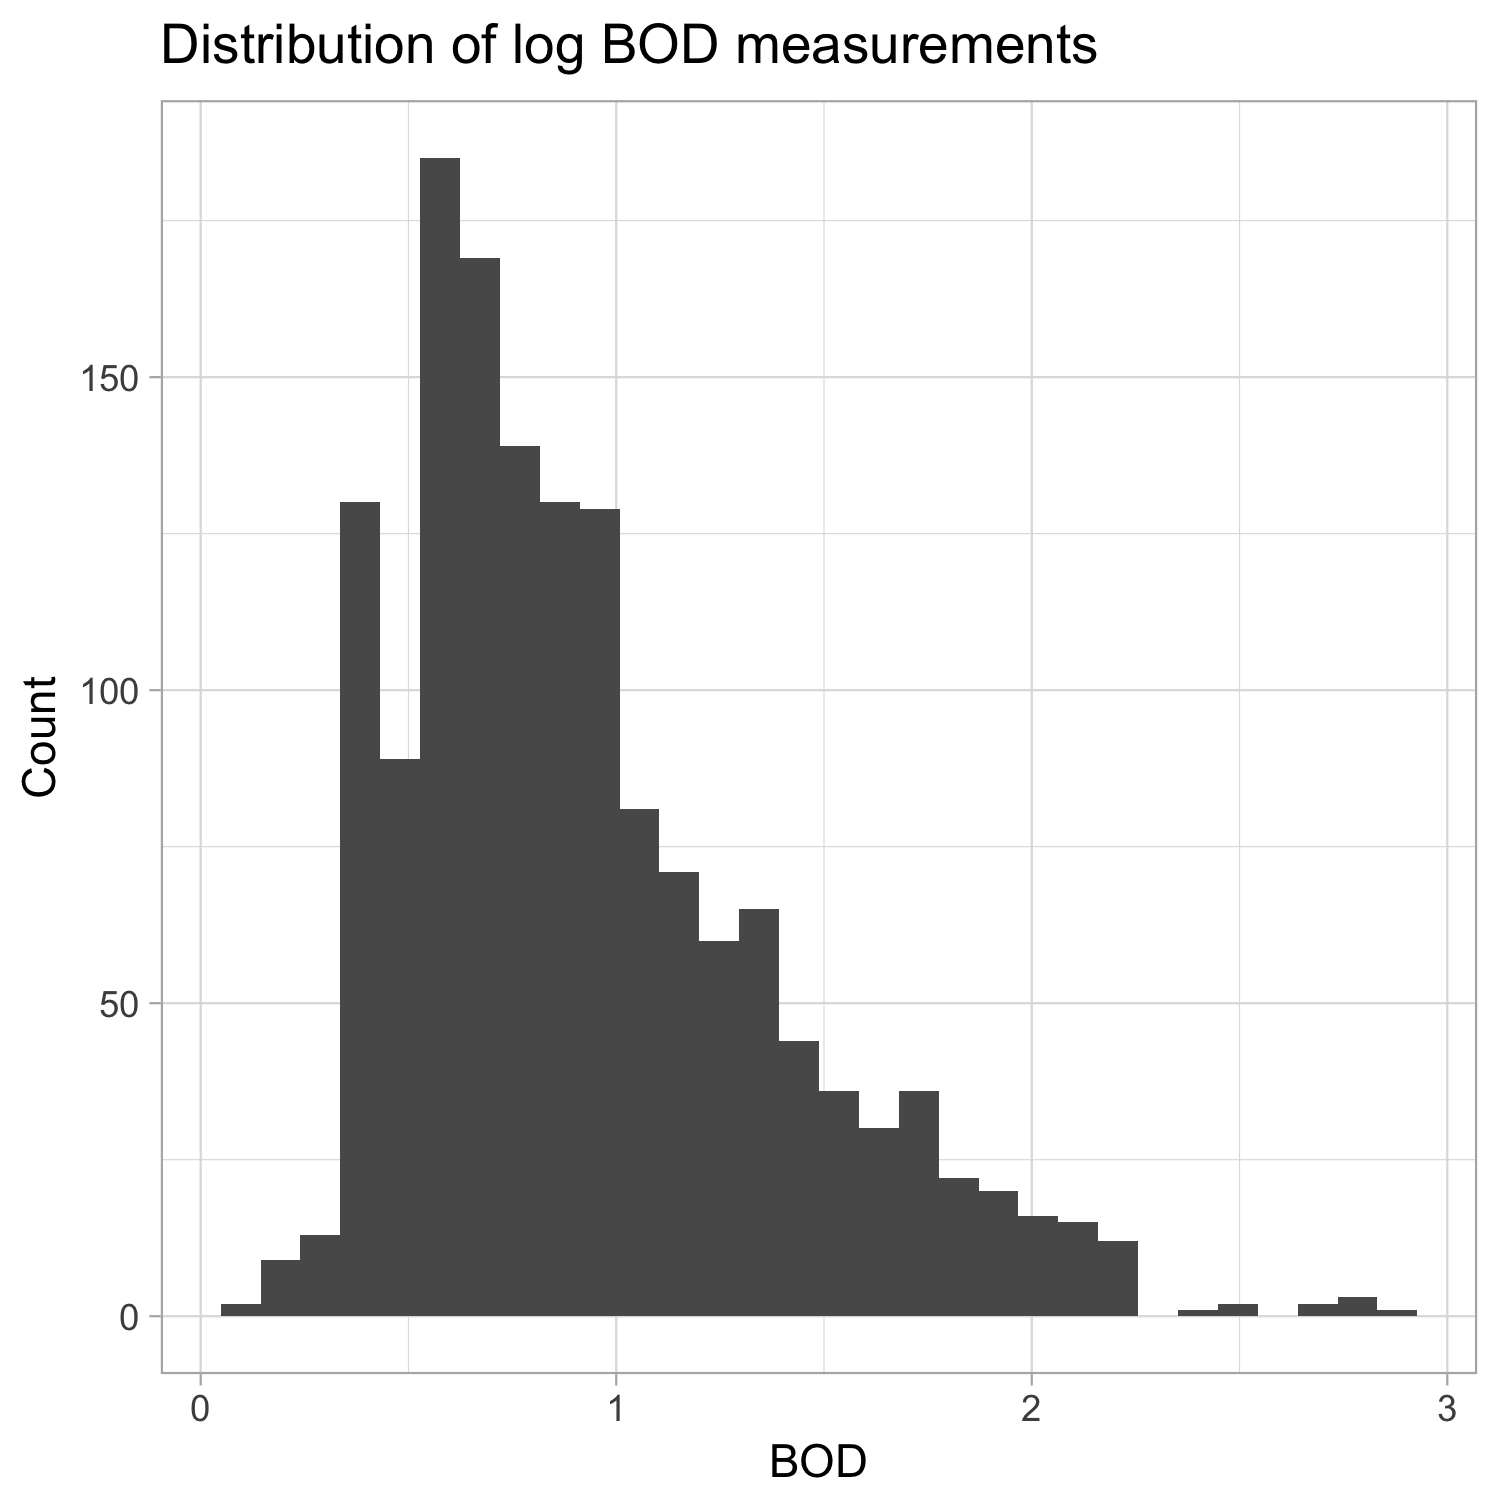
- Distribution of log BOD measurements
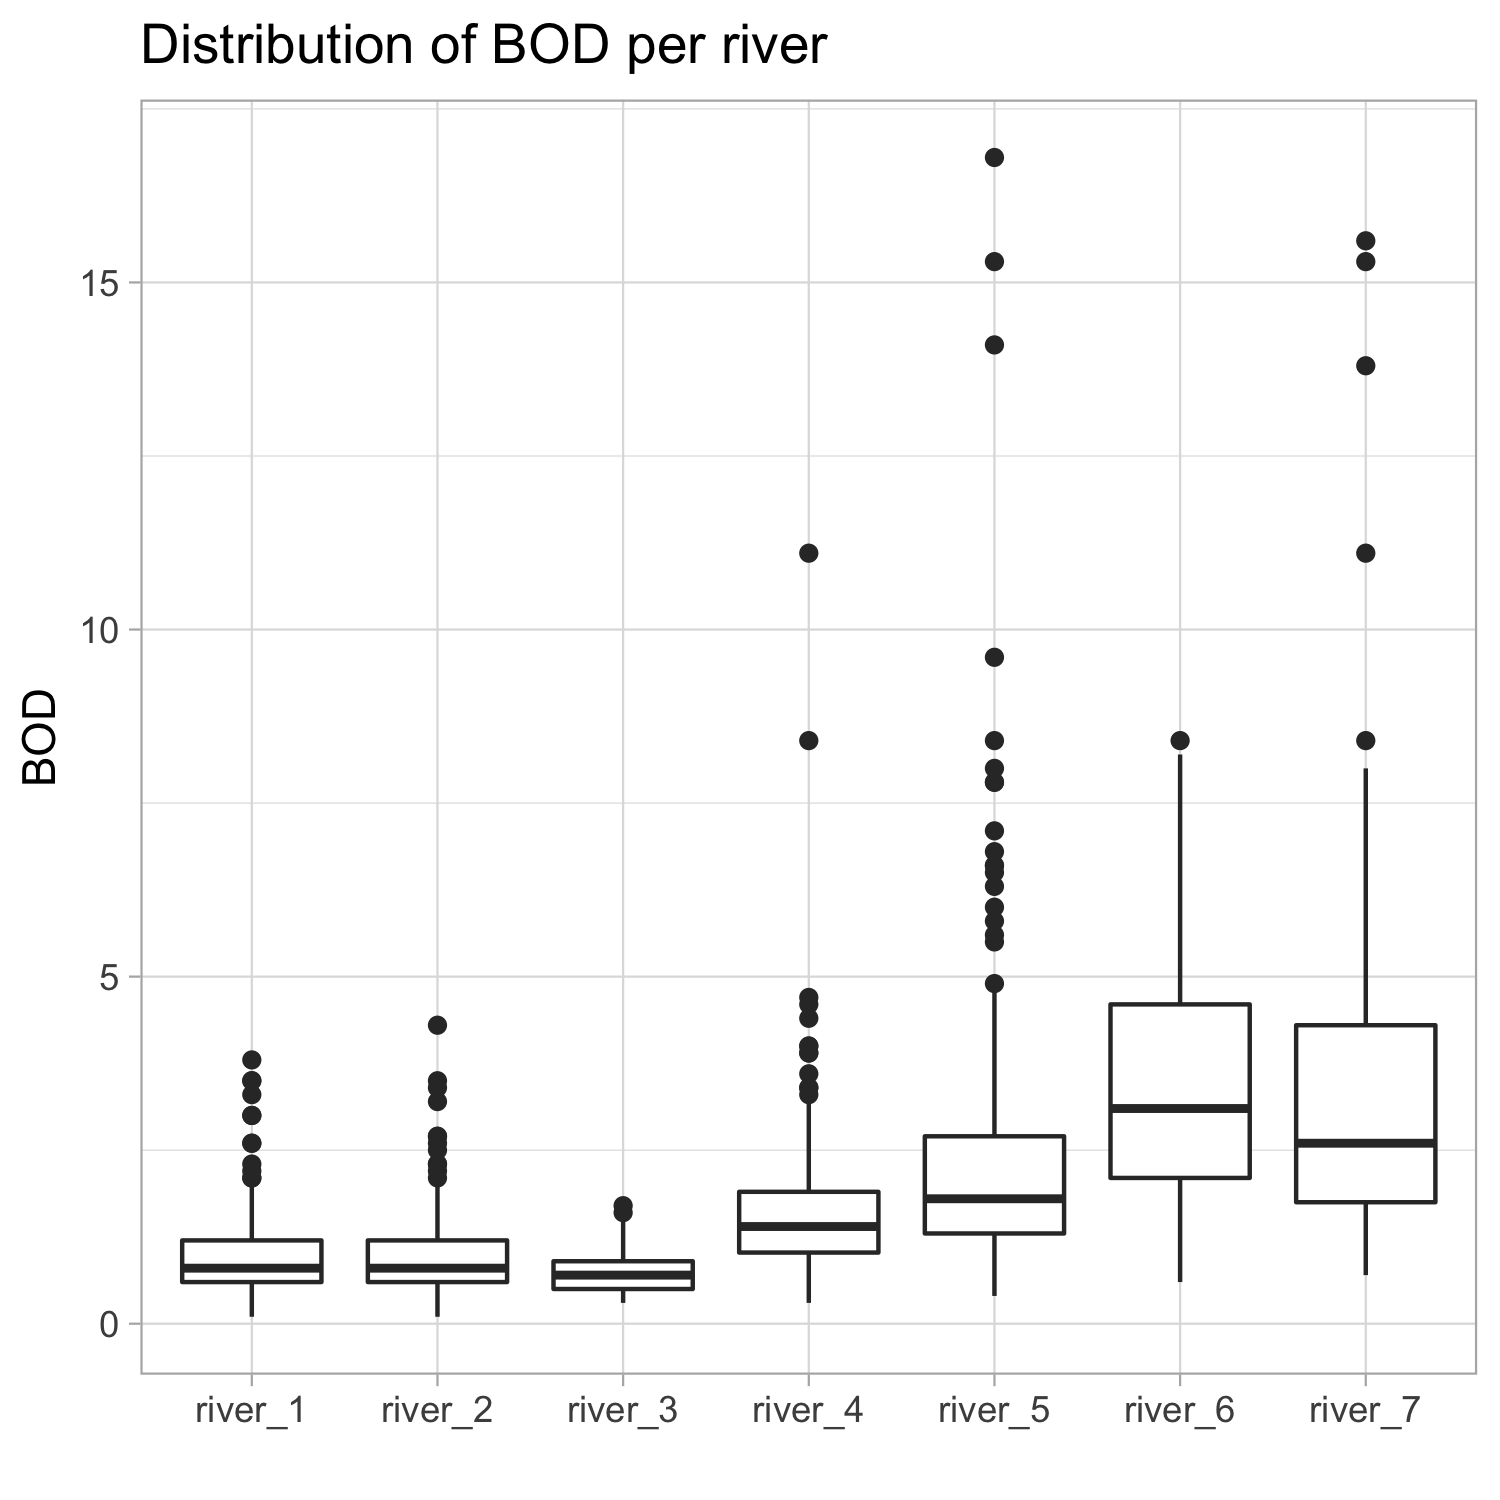
- Distribution of BOD per river
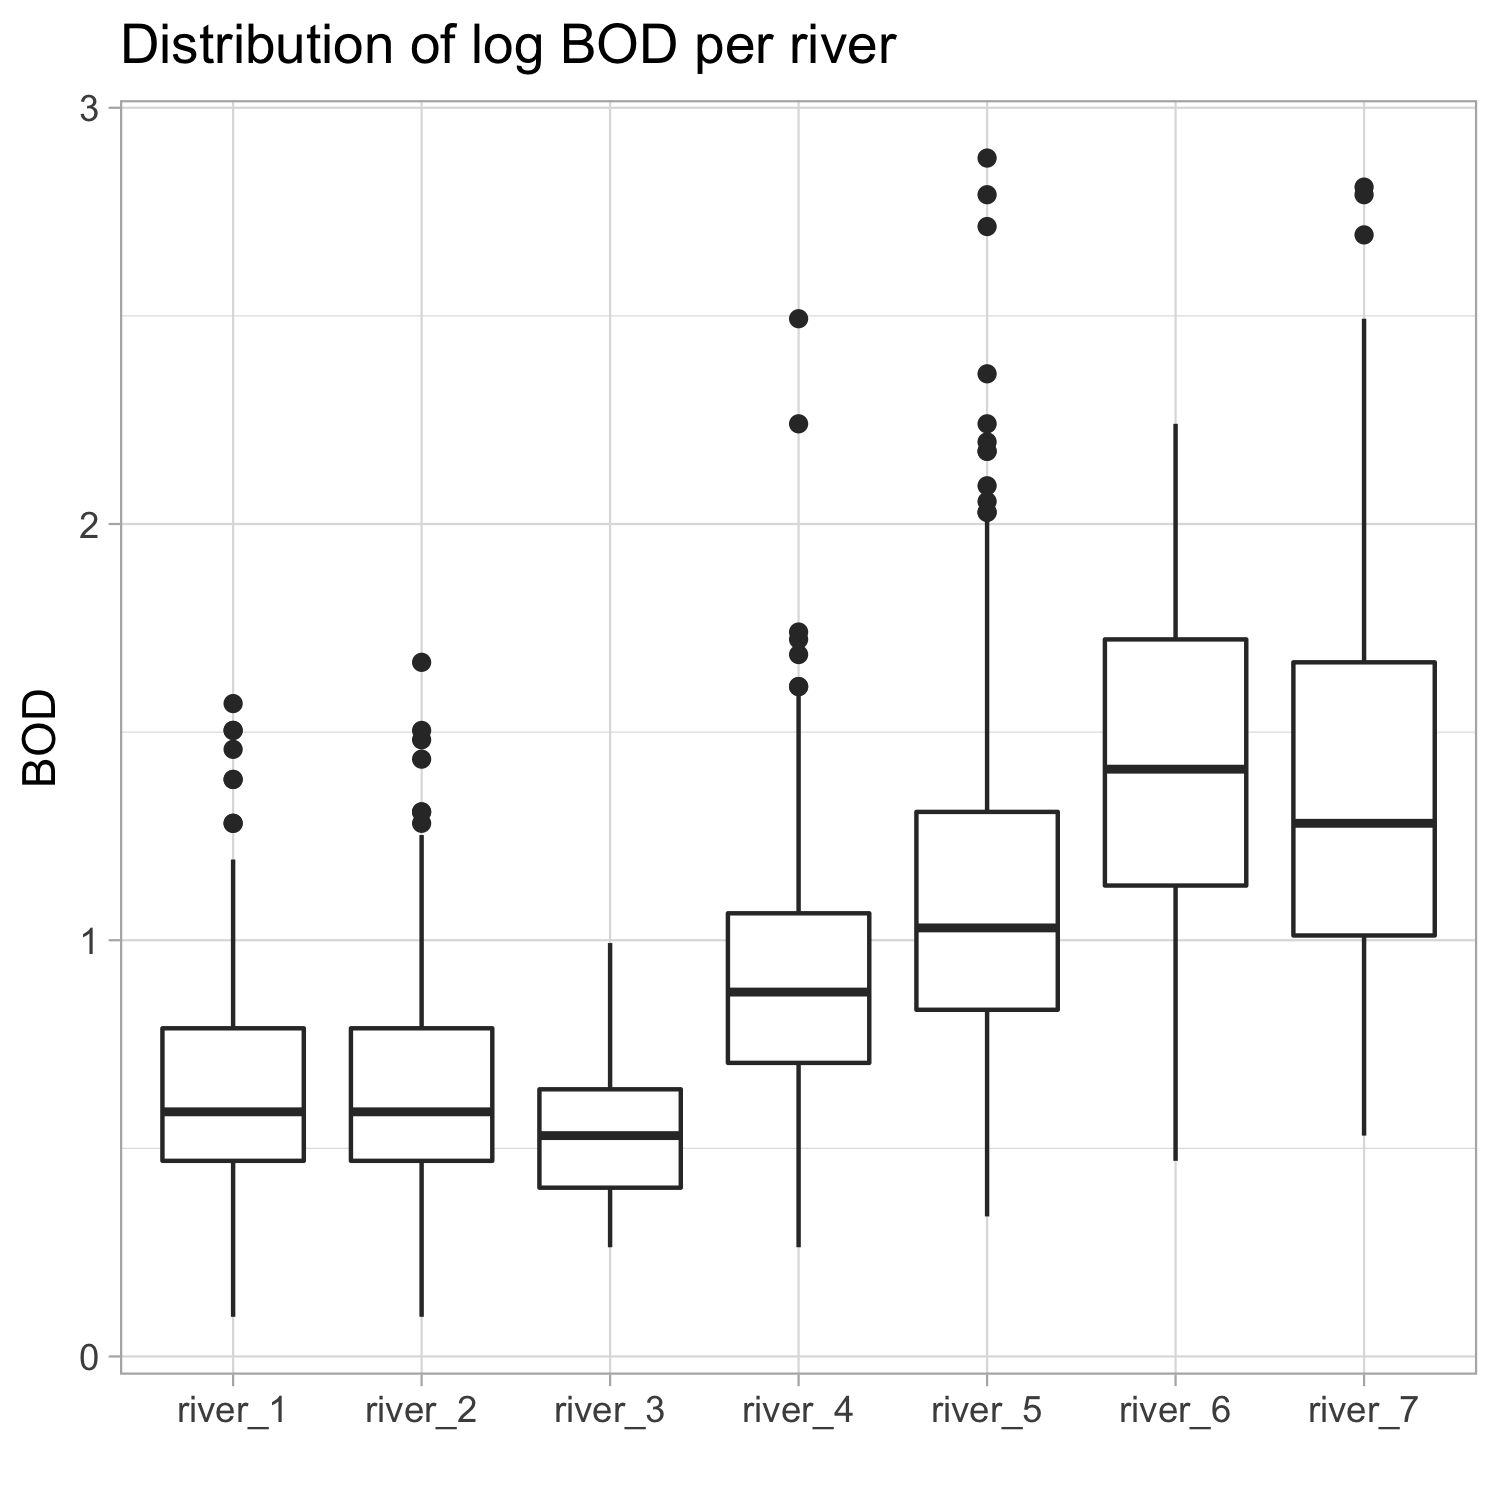
- Distribution of log BOD per river
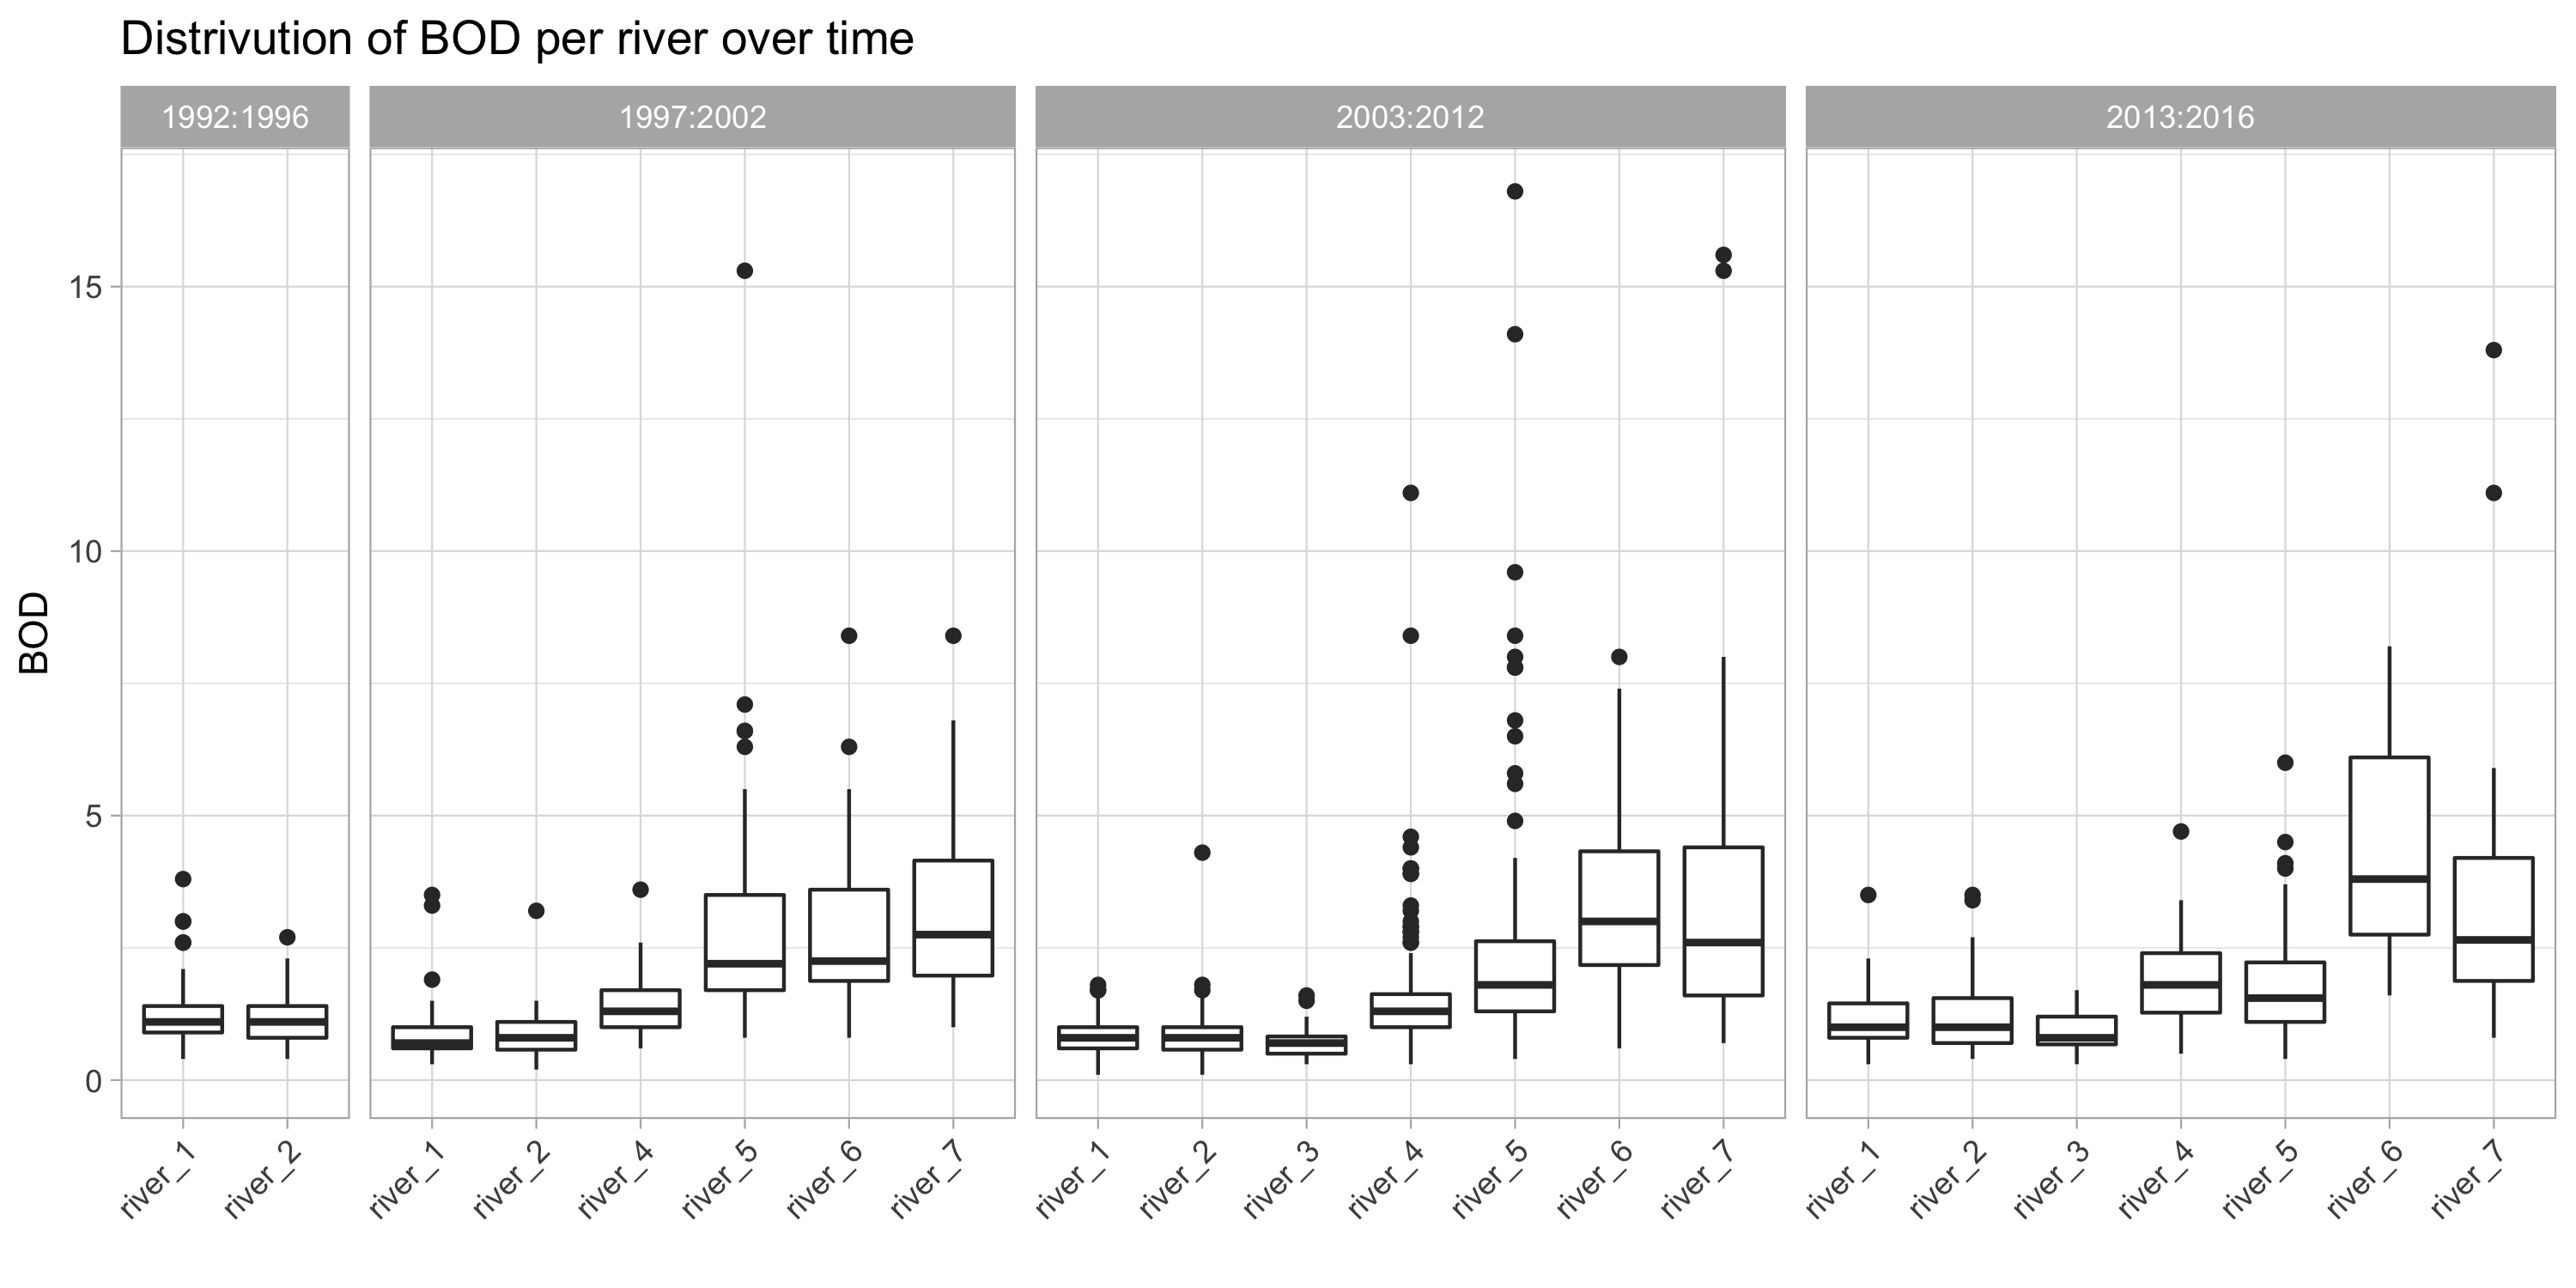
- Distribution of BOD per river over time


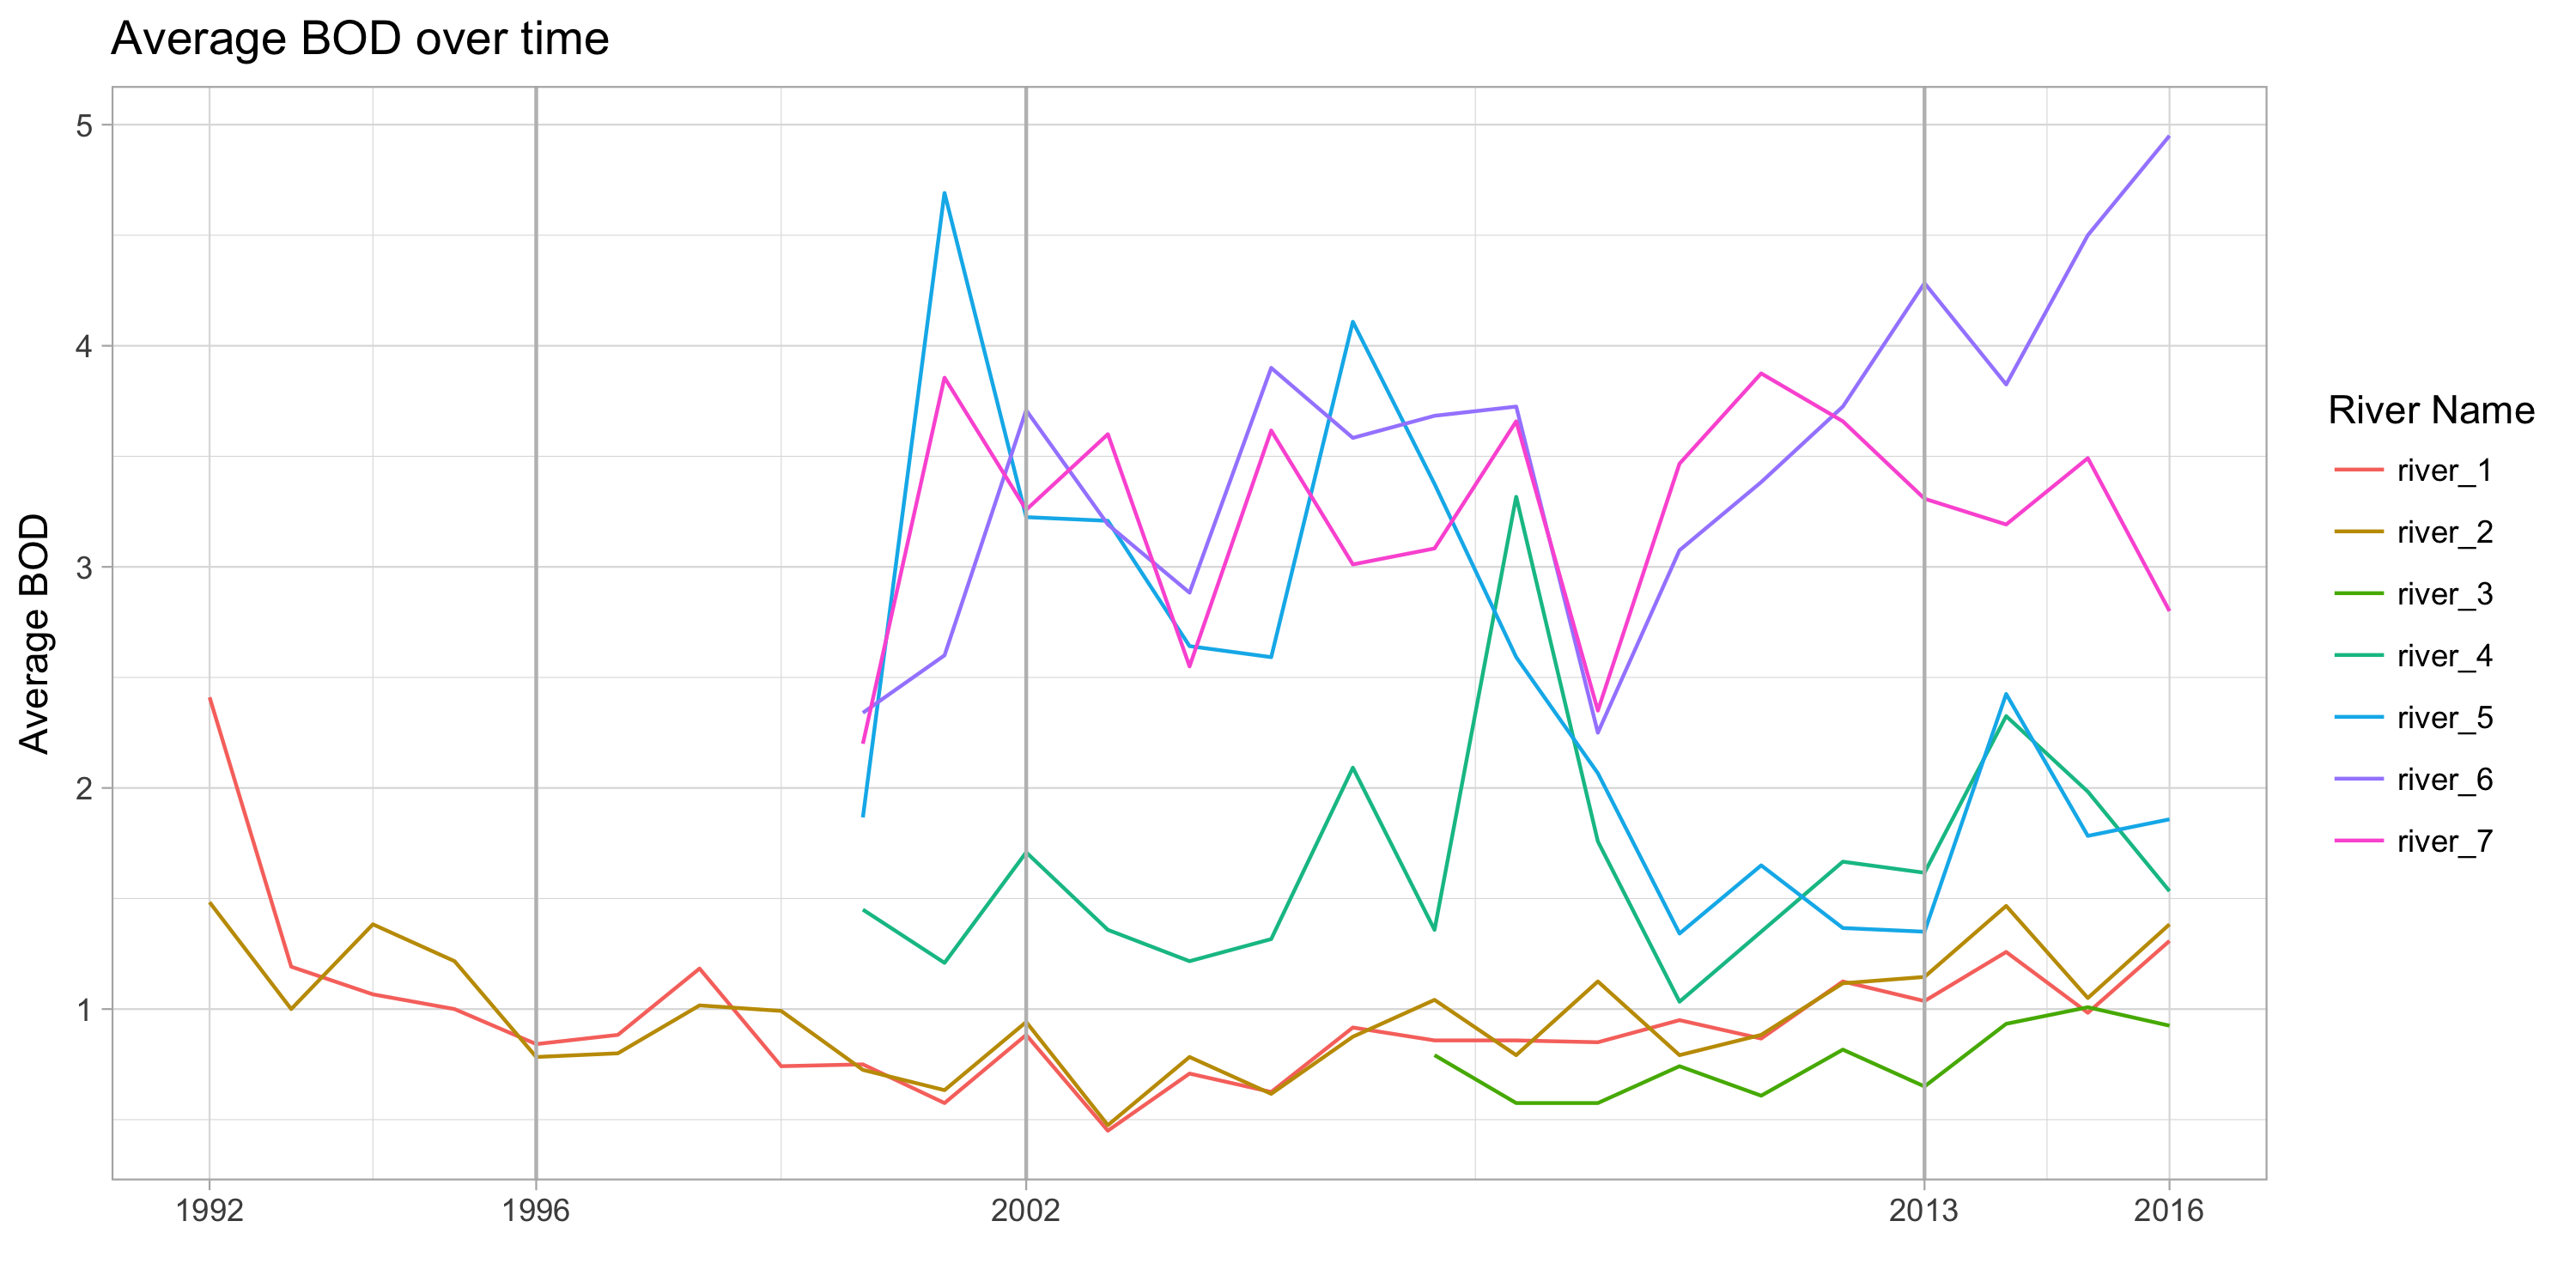
- Average BOD over time
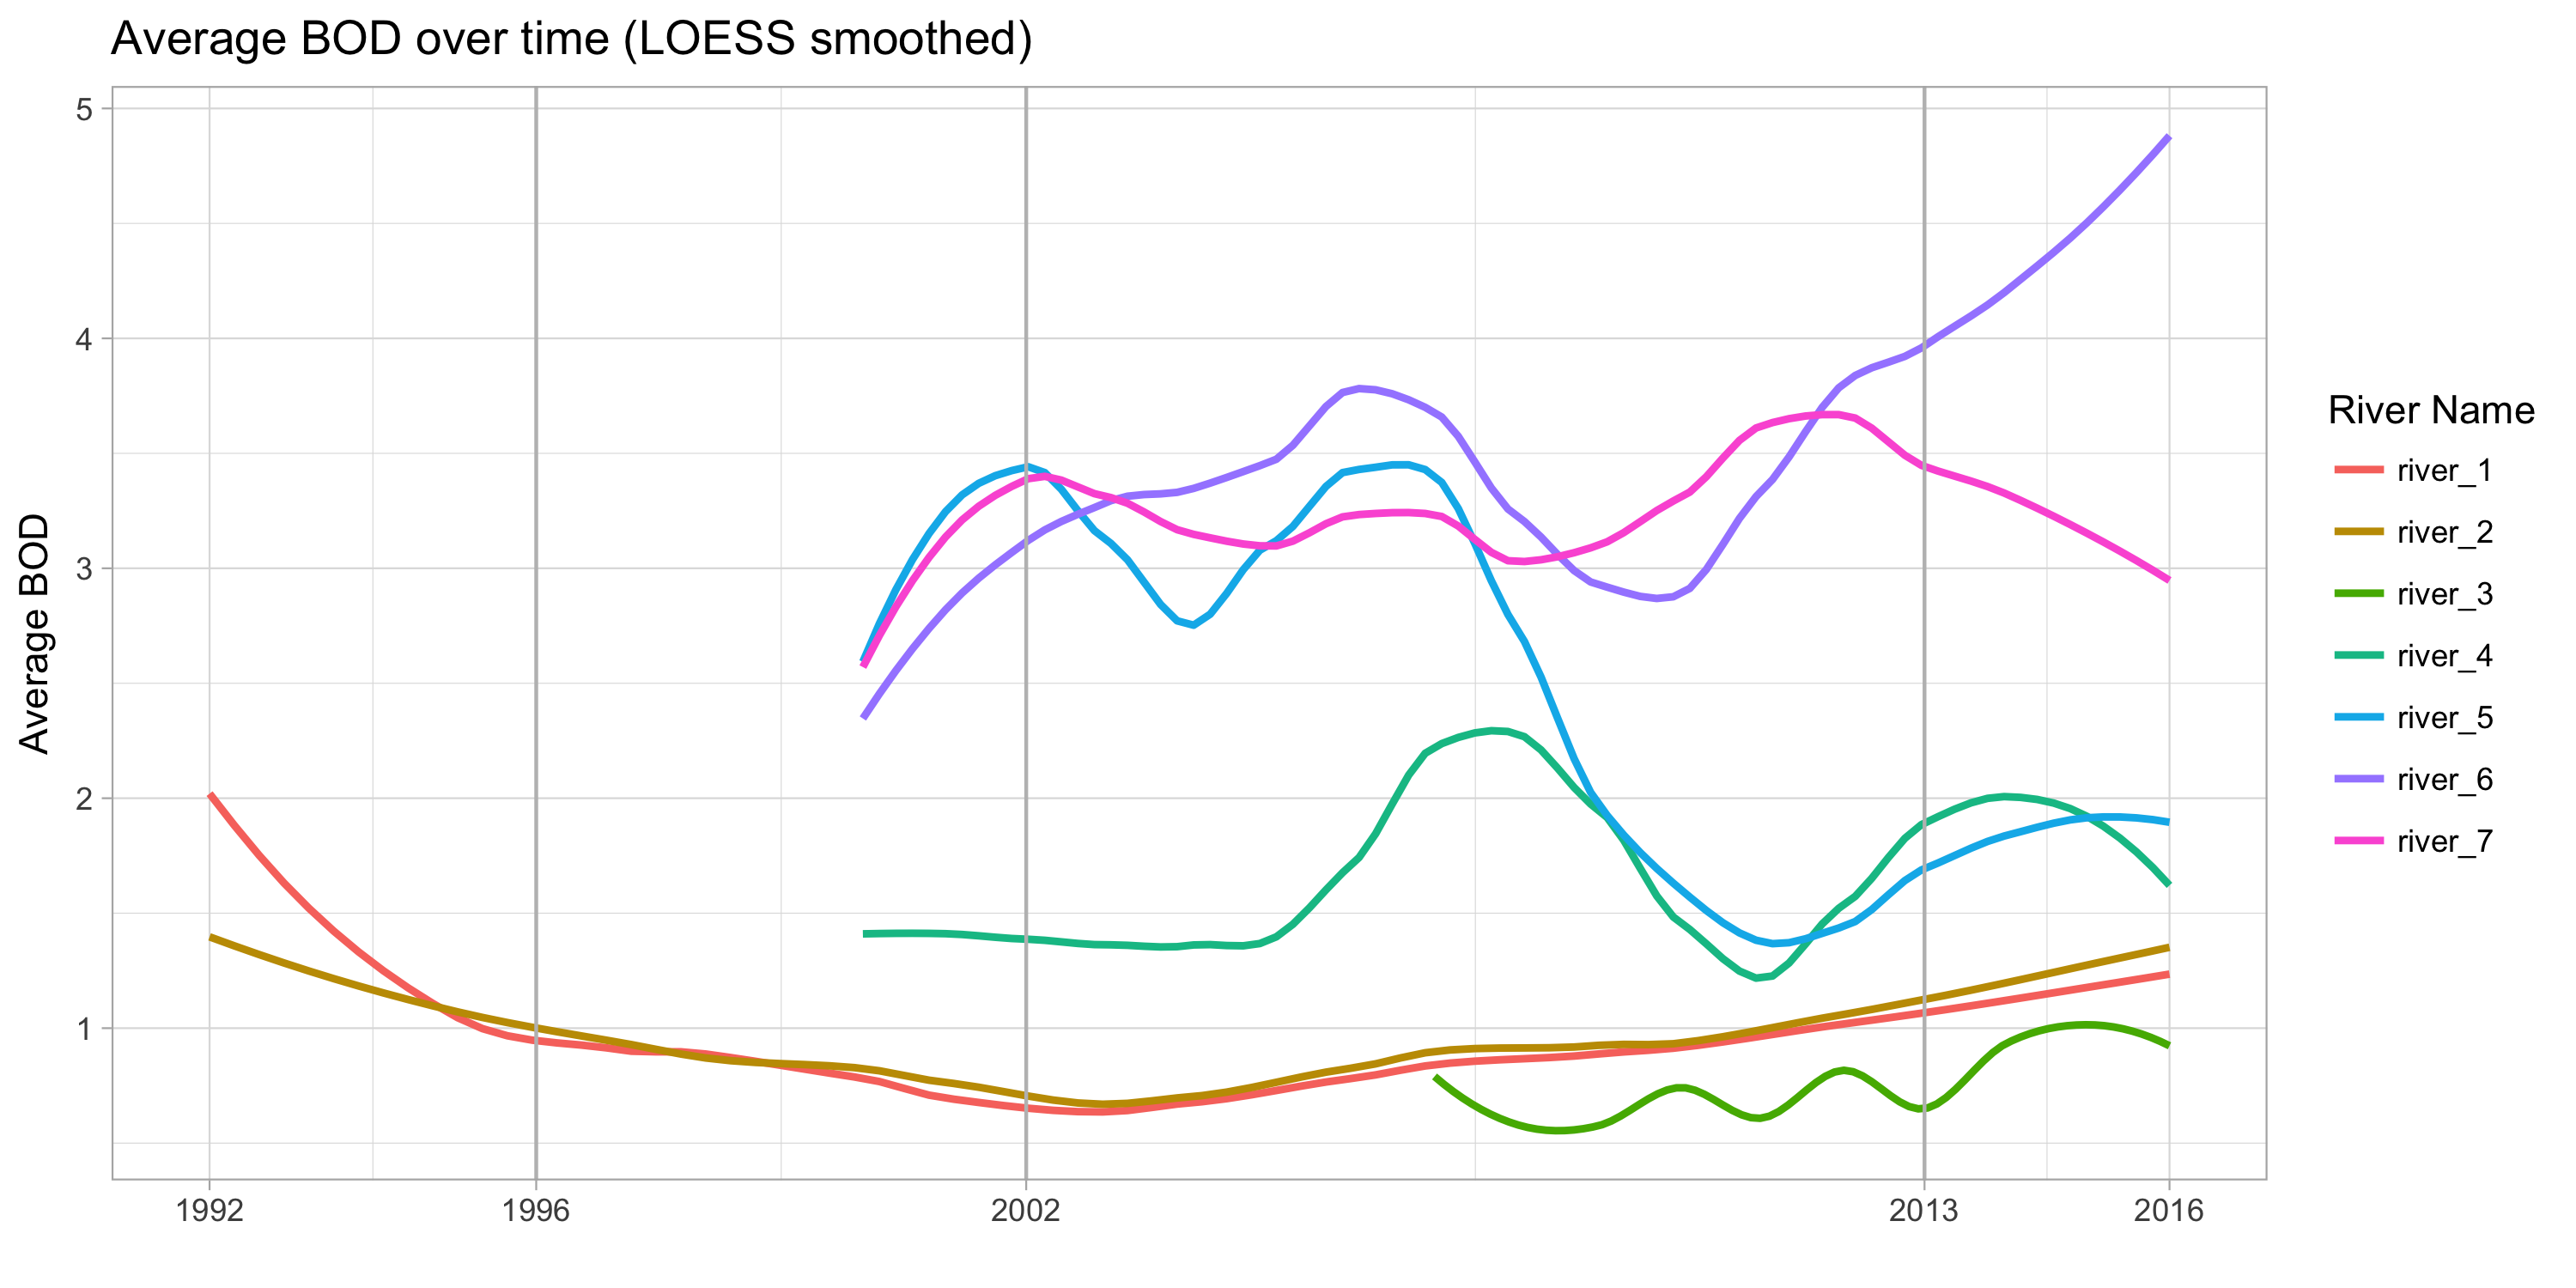
- Average BOD over time (LOESS smoothed)
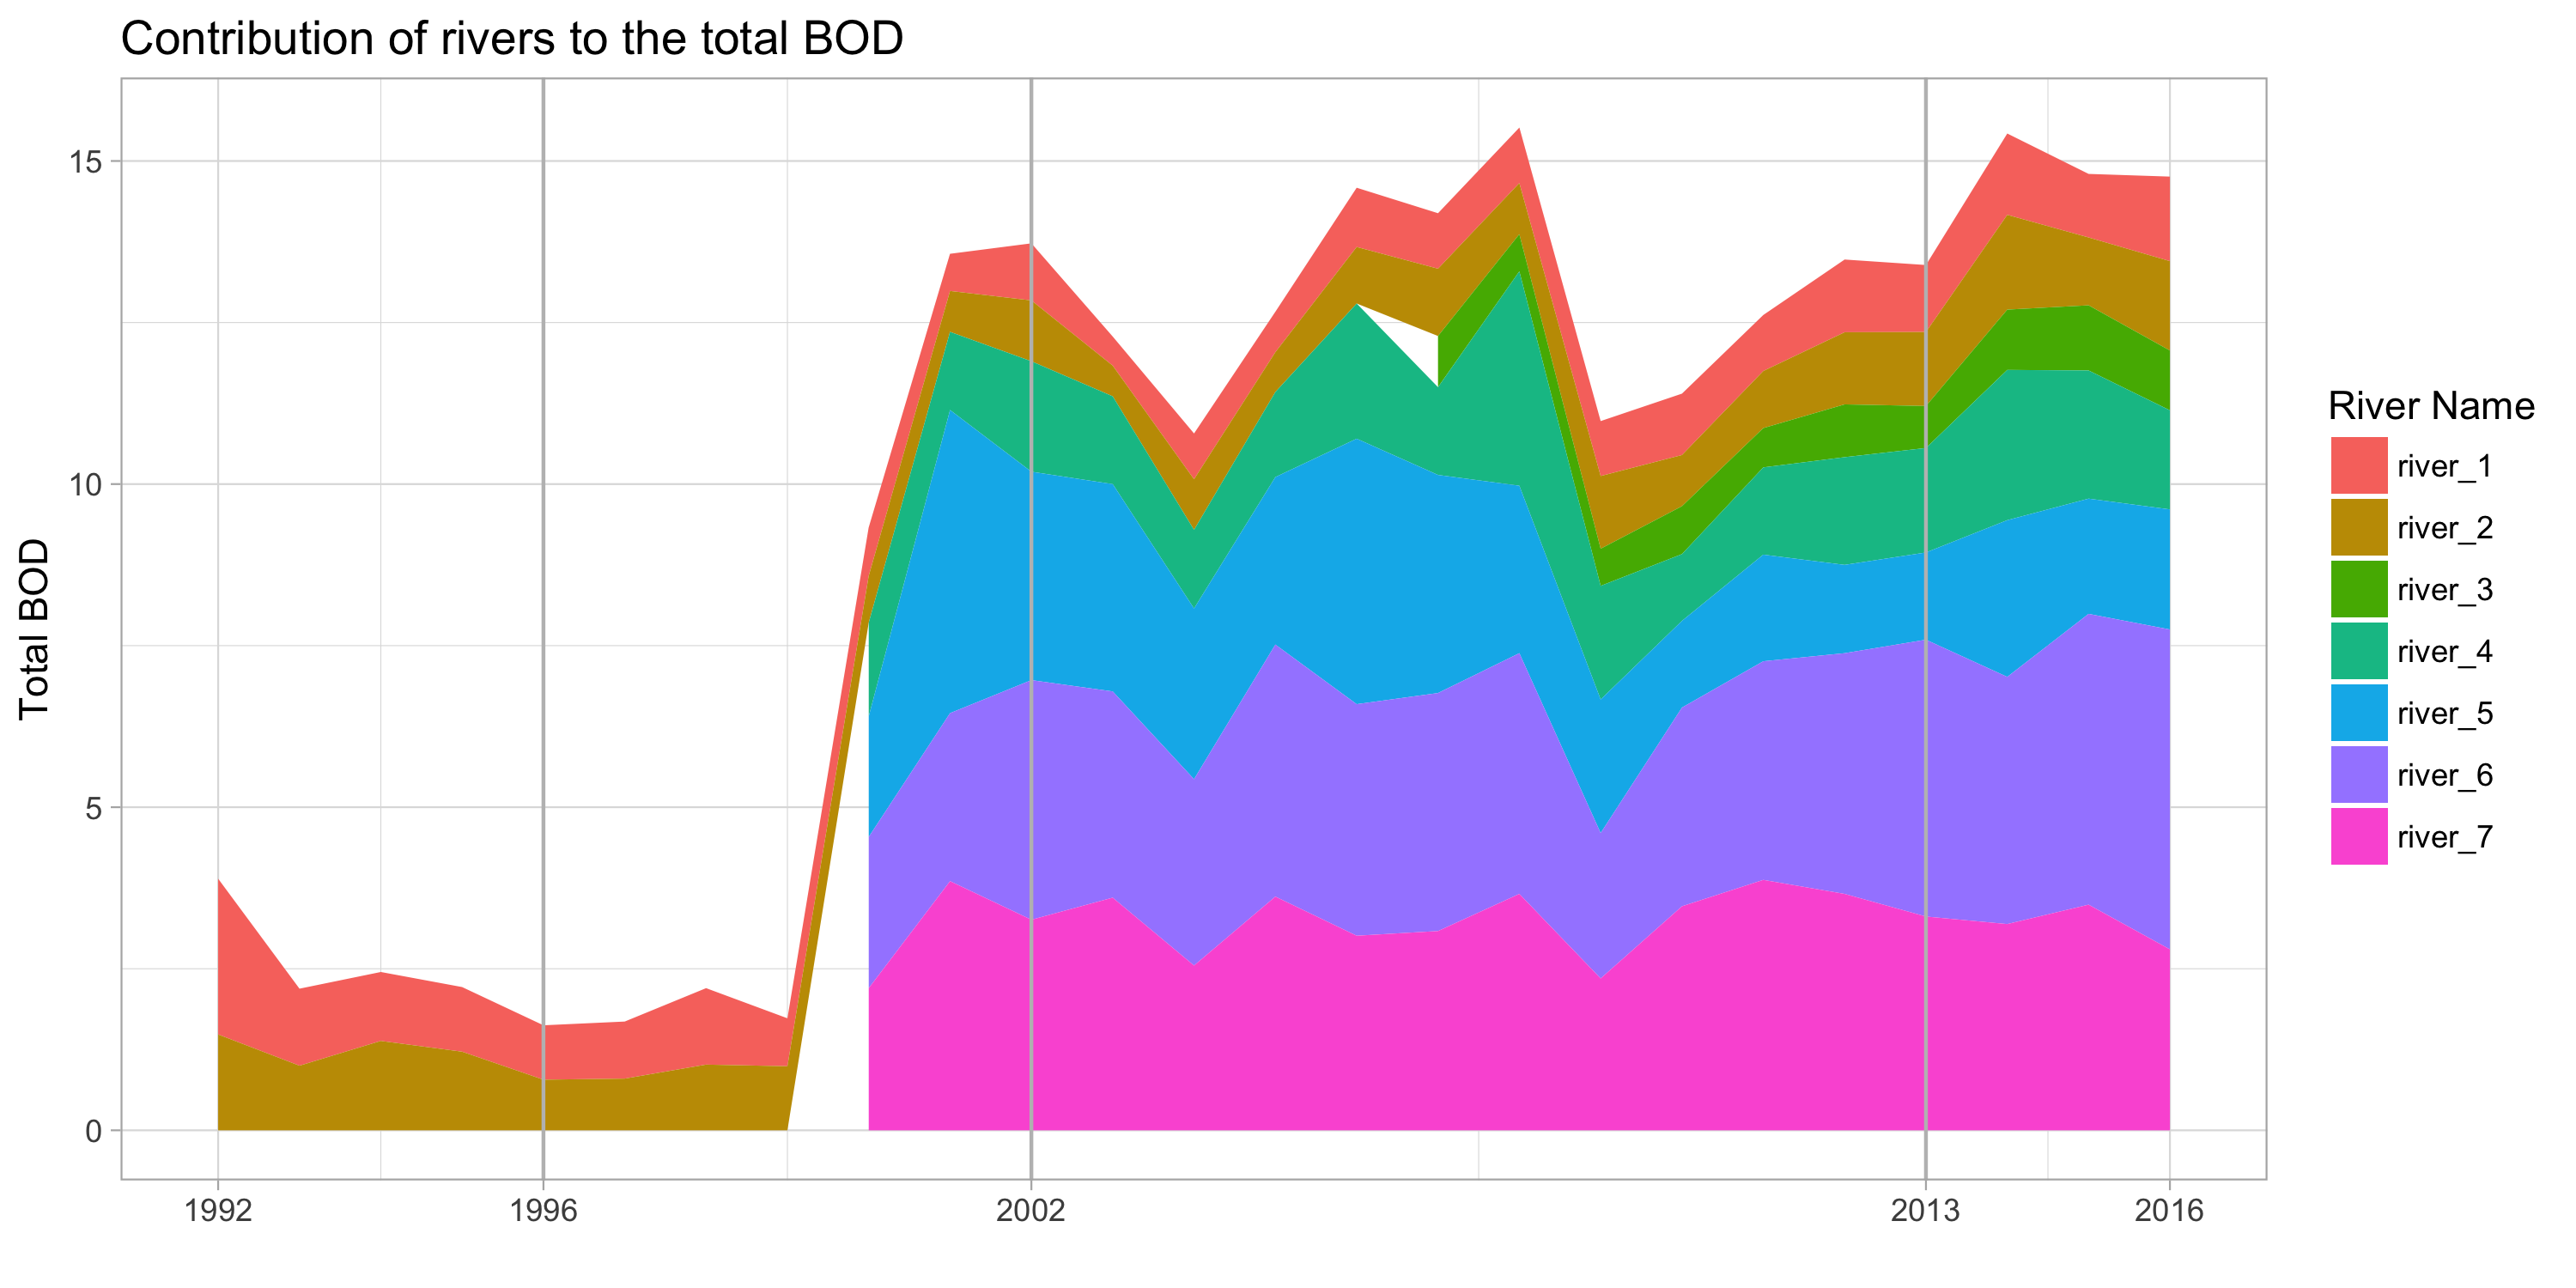
- Contribution of rivers to the total BOD
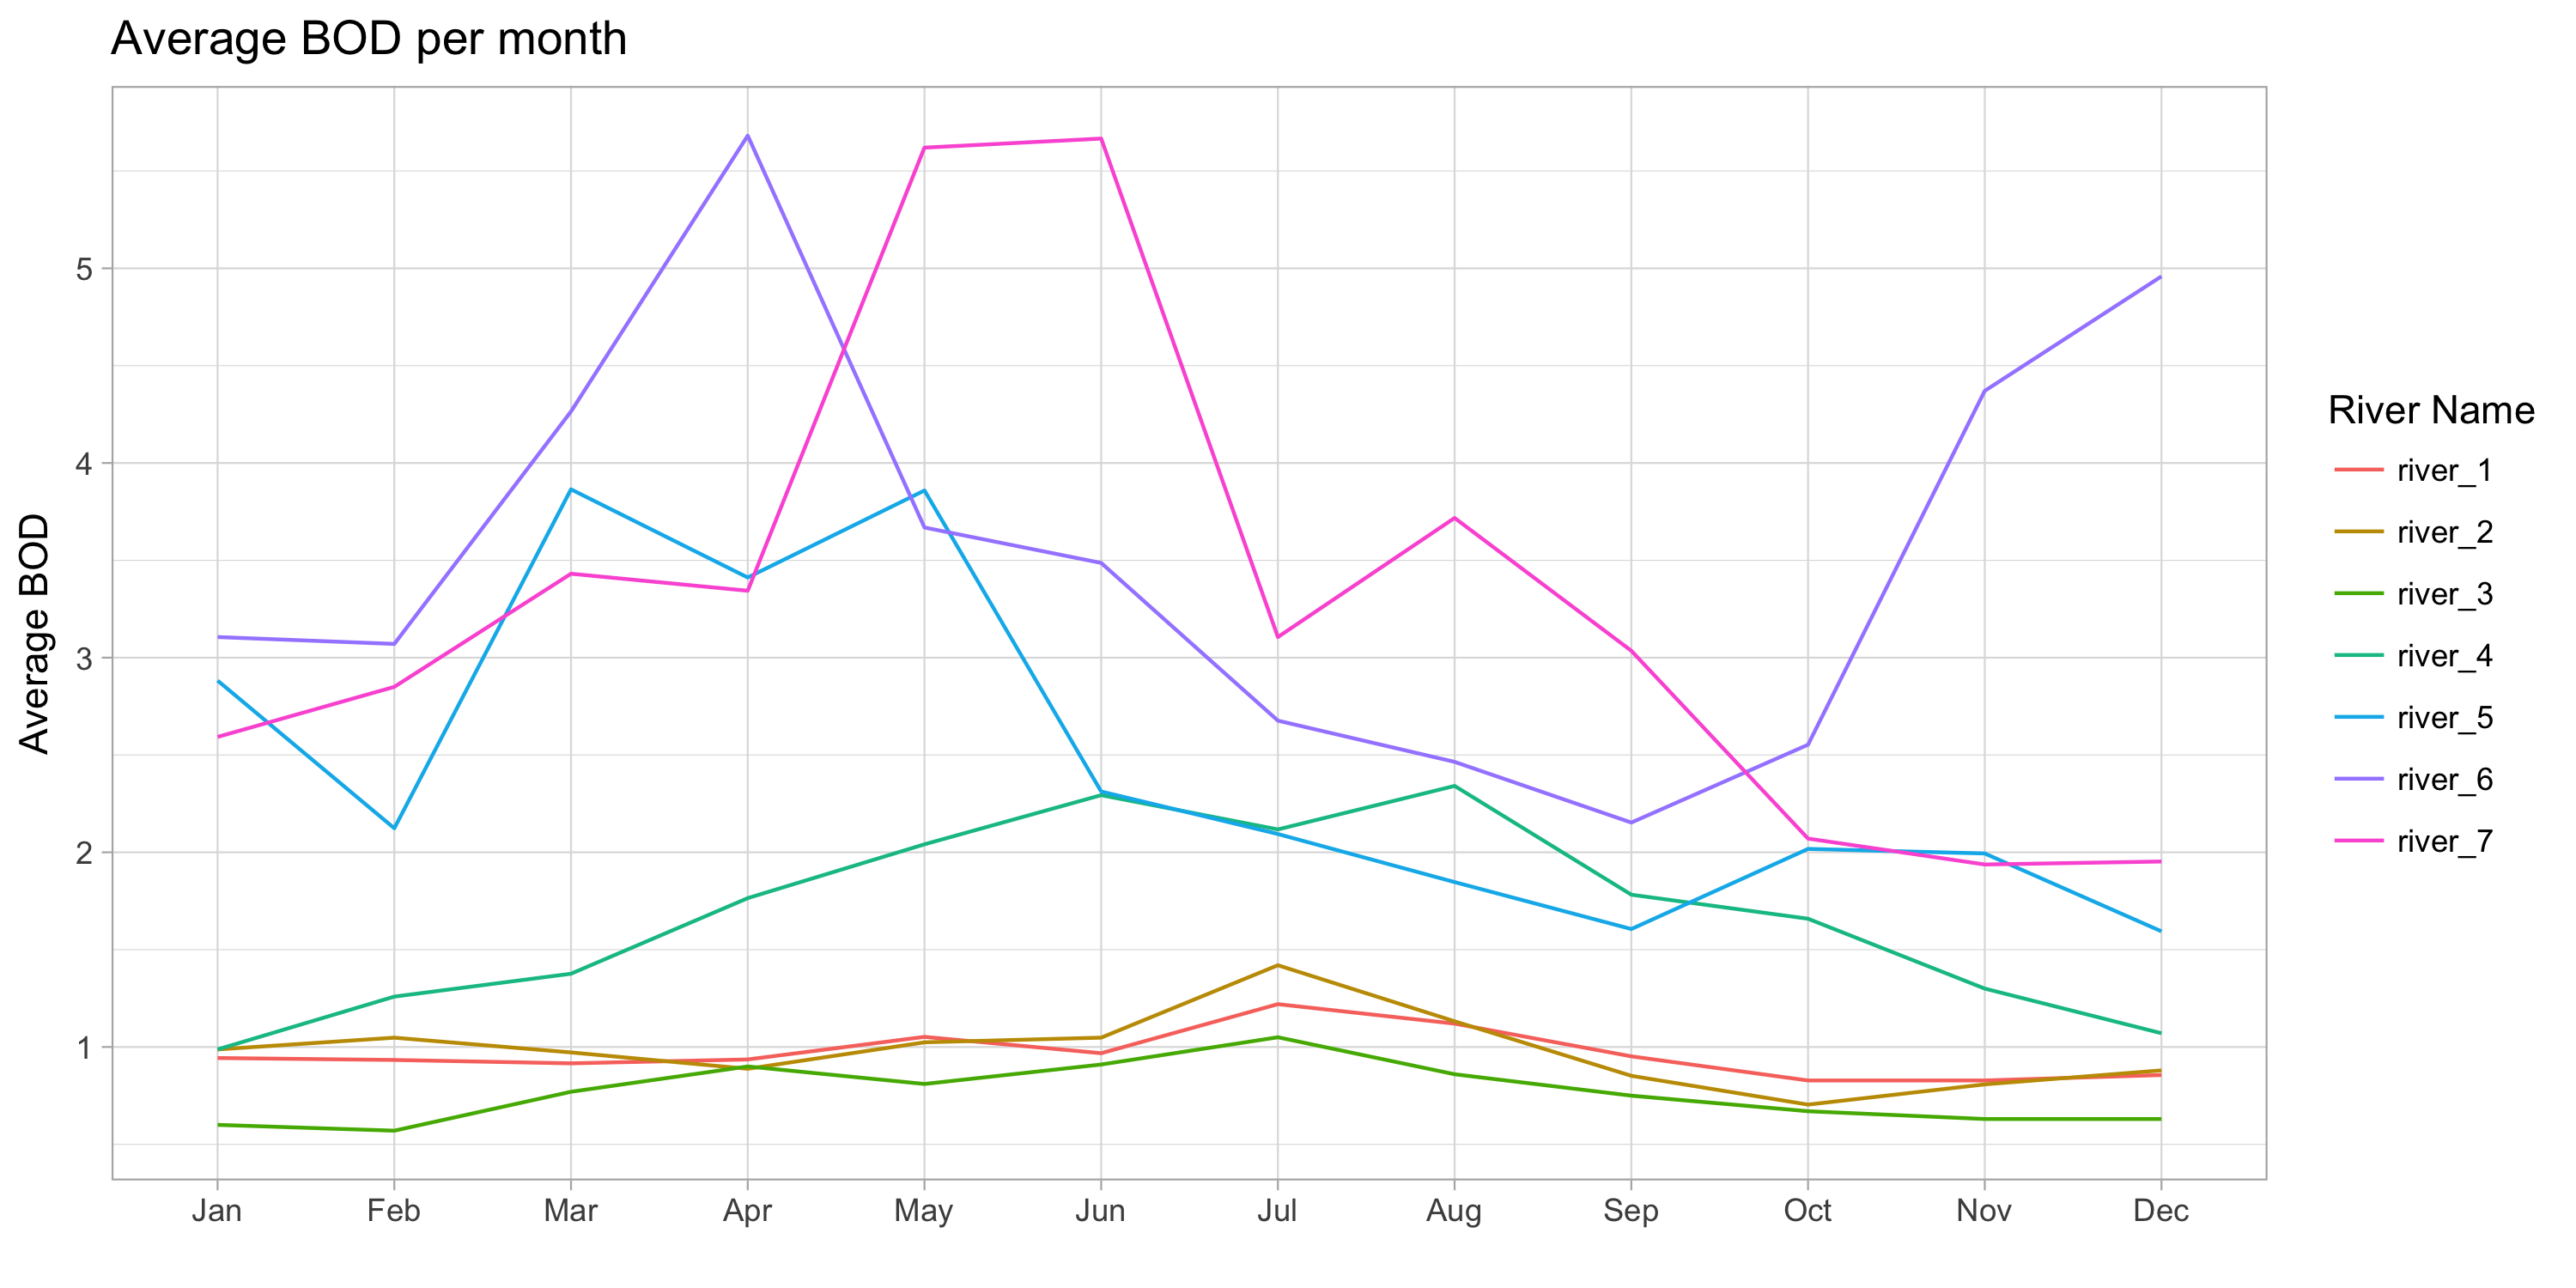
- Average BOD per month
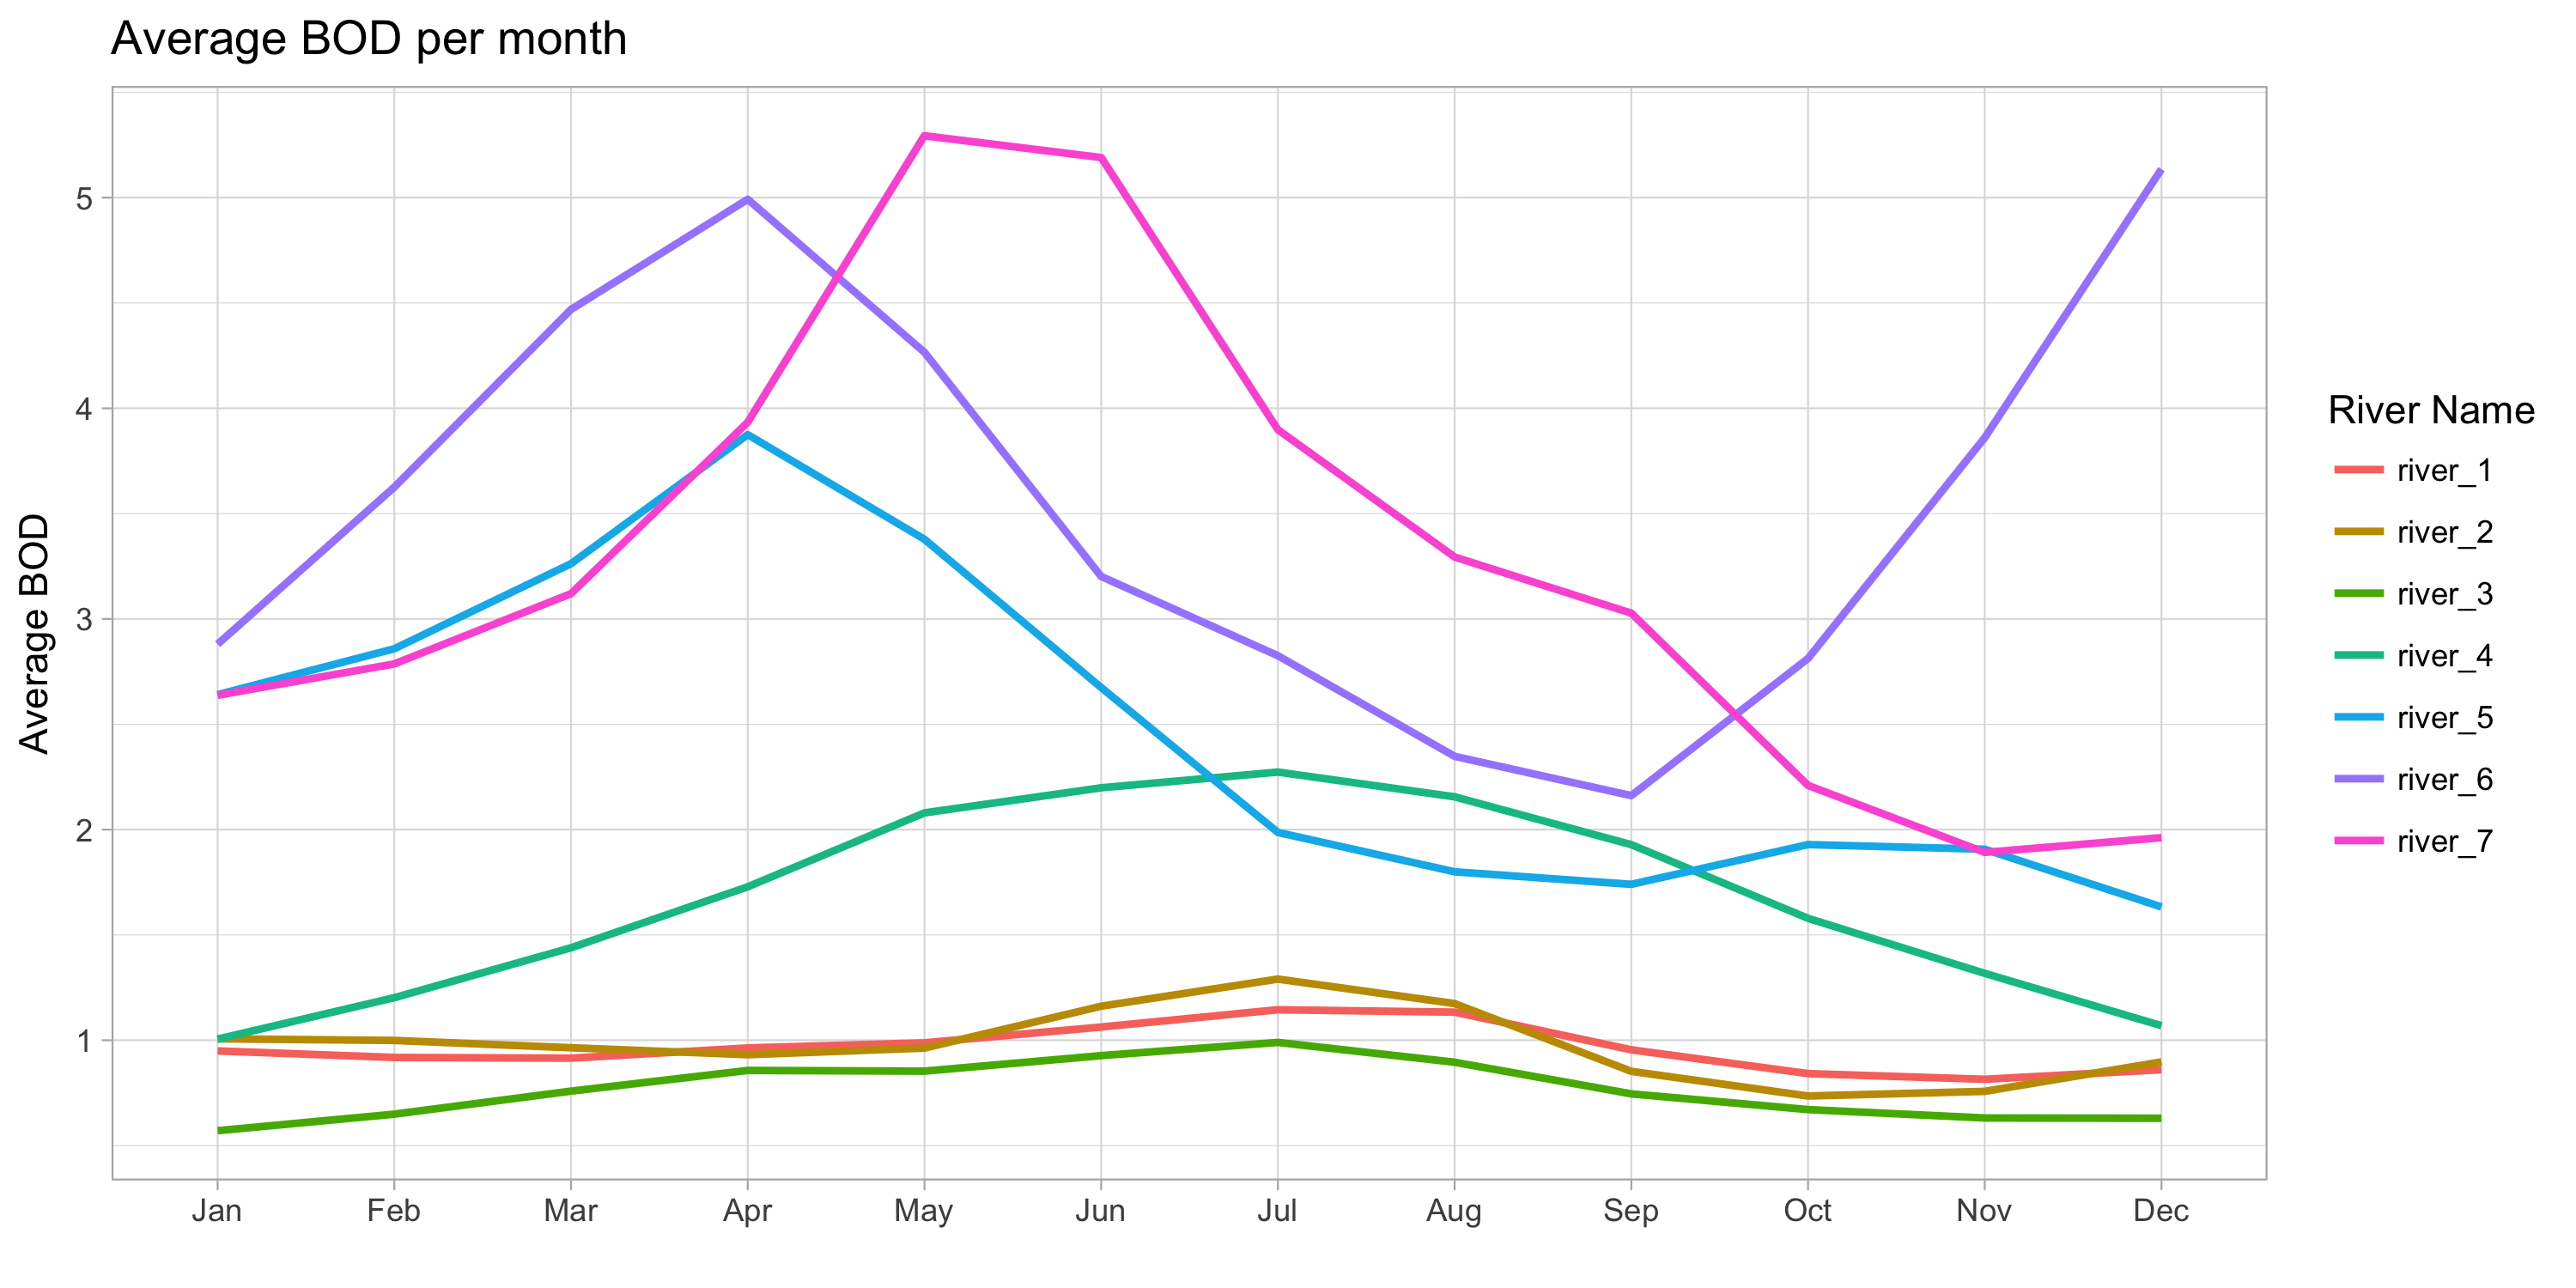
- Average BOD per month (LOESS smoothed)


- Scores and categories map

It's too late/early to make any conclustions!