File 1 - Using the Wisconsin breast cancer diagnostic data set for predictive analysis
File 2 - Download the data from https://archive.ics.uci.edu/ml/datasets/Breast+Cancer+Coimbra
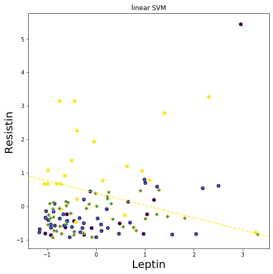
1- Created a training and test set and compute the accuracy (Training data is 80% or the dataset and Test data is 20% of the dataset ) 2- Built a model using linear kernel - the accuracy on the test data is 83%. 3- Built a model using polynomial kernel and evaluated the accuracy on the test data (80%) 4- Built a model using rbf kernal and evaluated the accuracy on the test data (87%)
Data Visualization :
Correlation between all predictors:

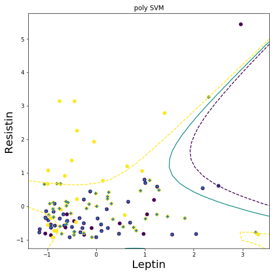
Polynomila Kernal SVM Boundary:

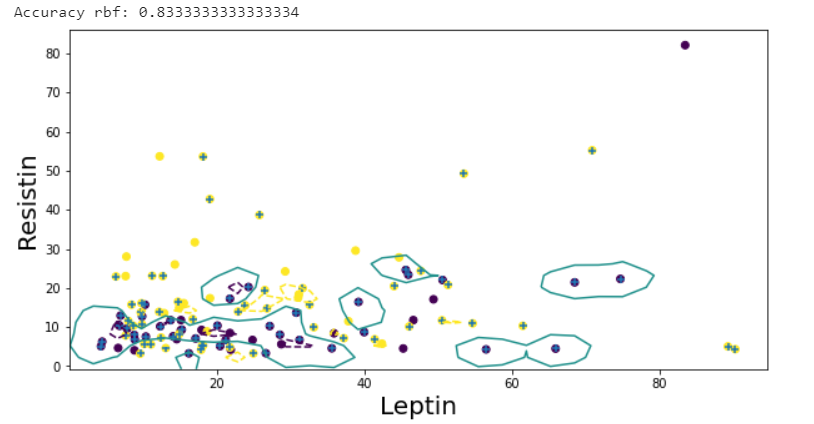
RBF Kernal SVM Boundaries with C=2 gamma=0.1:

RBF Kernal SVM Boundaries with C=40 gamma=0.1:
Final Results :
The kernel function who has the best result is the linear function. However, based on the visualization plots, we can tell the most of data set cannot be separated linearly The size of dataset is way too small which might lead to the inaccurate results. Because of the small size, the validation set only has 20% of the data set to test on.

