Note: I am not an expert in embedded systems and microcontrollers, so please do not take anything I did at face value, but this works for me.
I wanted to monitor my indoor Air Quality (Co2 and PM values) and plot the data on Grafana dashboard
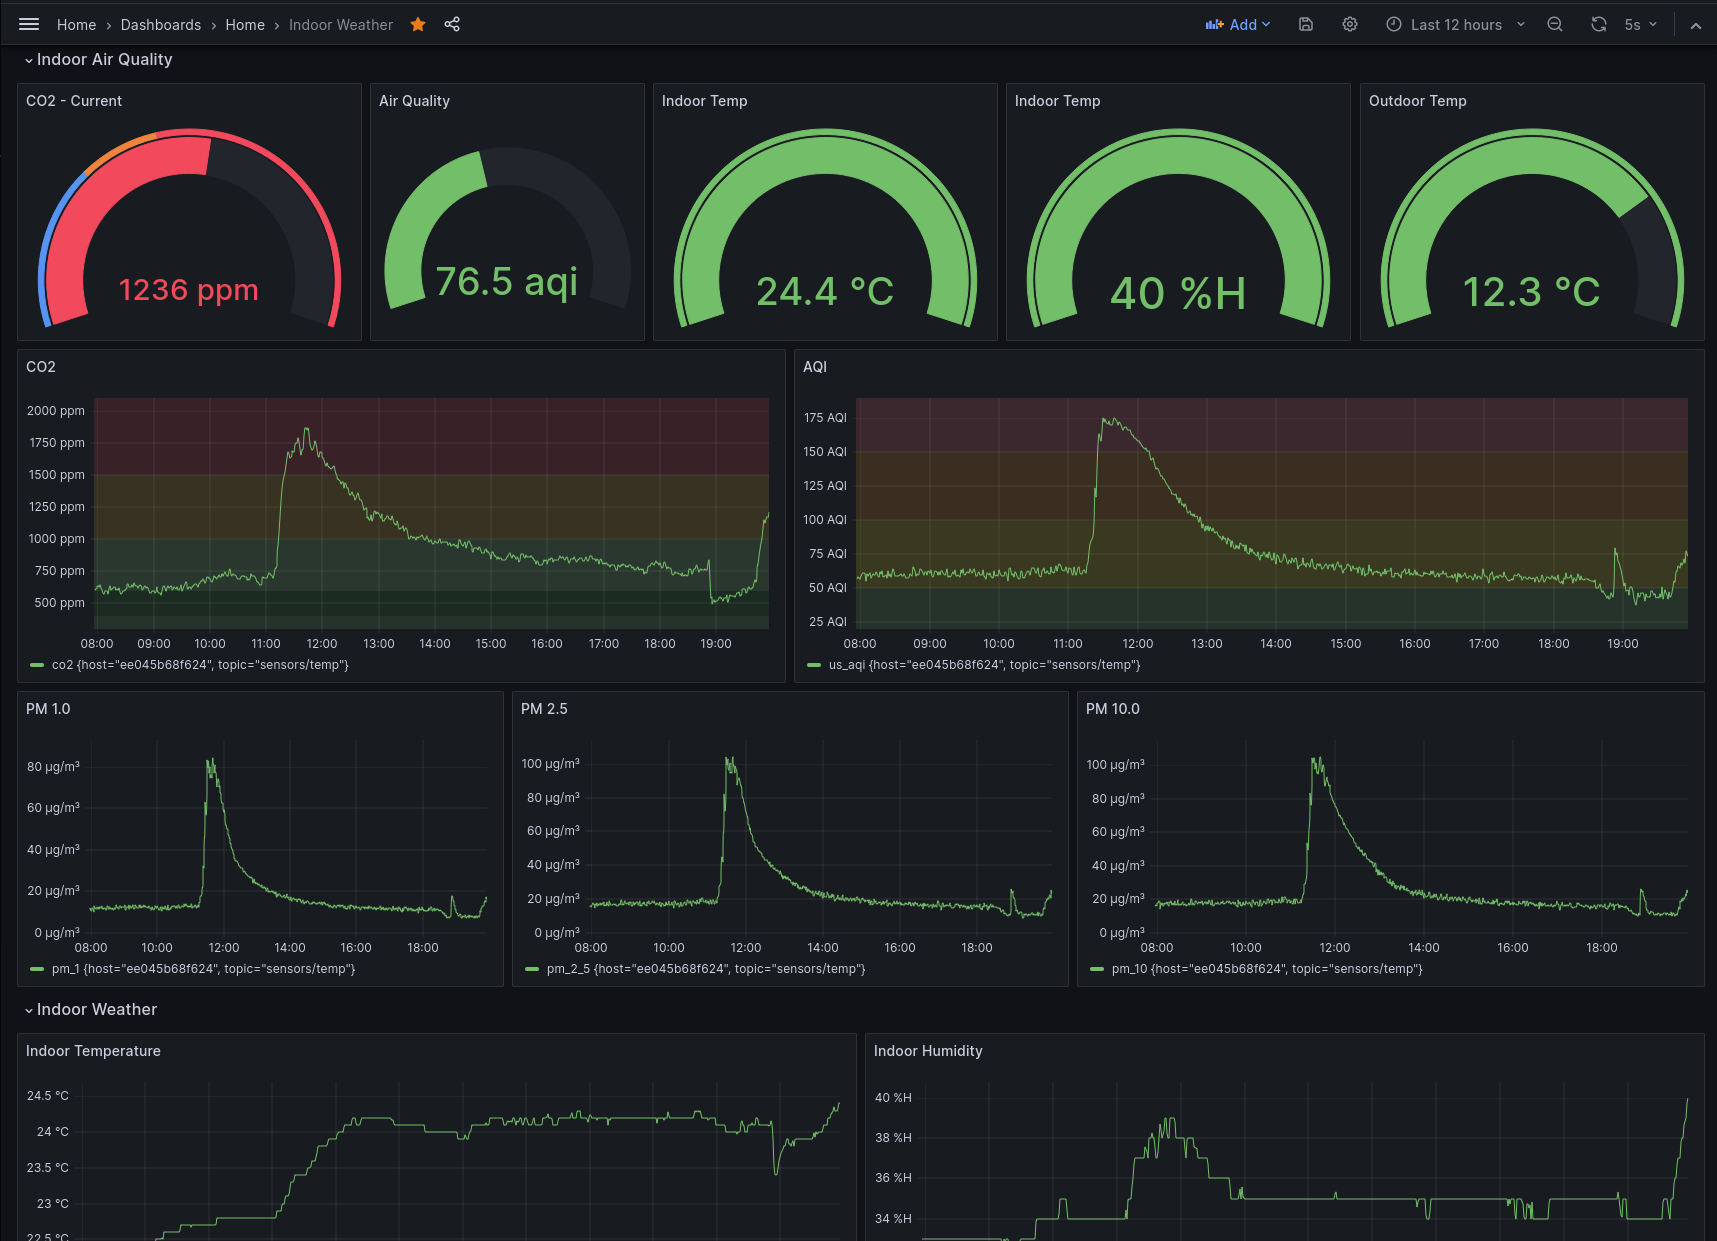
This is my grafana dashboard
Note: Lots of weekend cooking, I am not dying. The air quality is fine otherwise
- Temperature and humidity : DHT11 - This is not the best sensor, but good enough for my use case
- CO2 : MHZ19-B
- PM (Particulate Matter) : PMS5003
- Esp32 development board
- Breadboard
- Jumper Wires
- Arduino IDE
- Sensors connected to the ESP32 Dev board
- ESP32 connected to the WiFi Network
- MQTT server running on the same WiFi Network
- ESP32 pushes the sensor readings periodically to MQTT server
- We have InfluxDB, Telegraf and Grafana on the same network
- Telegraf pushes metrics to InfluxDB
- Grafana dashboards visualizes metrics in InfluxDB
The source code is HERE
We will use the serial connections for PM and CO2 sensor. Since ESP32 has three serial ports, we can use two of them. Leave the first one (Serial port 0) alone and use 1 and 2
Refer THIS in connecting the DHT-11 to ESP32 (Not my website, but it is very well detailed and I am too lazy to reproduce that information here)
- I used GPIO pin 21 for my dht-11
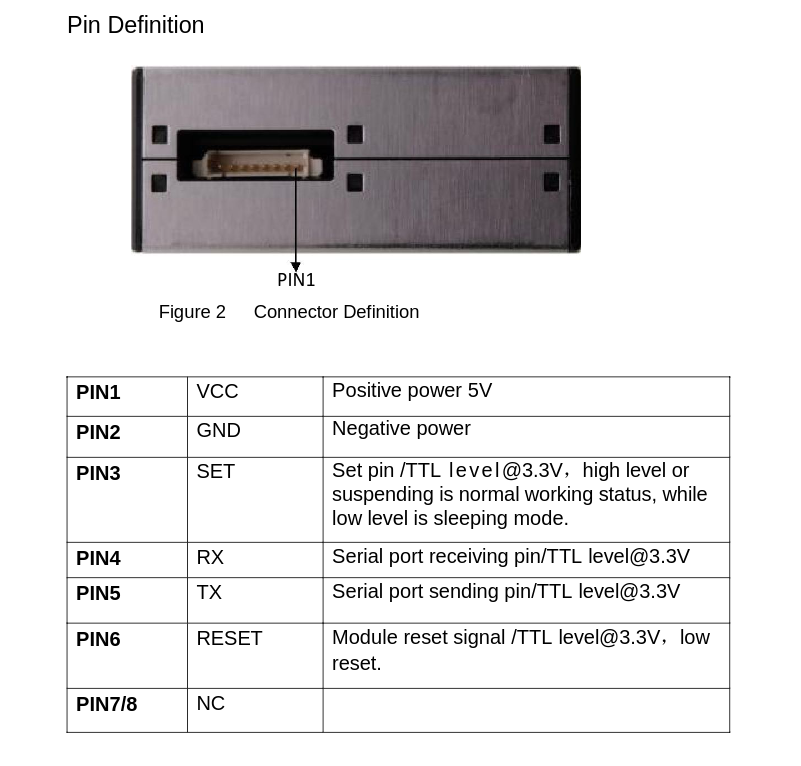
Checkout the datasheet HERE. I Downloaded from HERE
- Connect the PM sensor to one of the serial port. I used Serial port 1 (Remember, the first one is port 0)
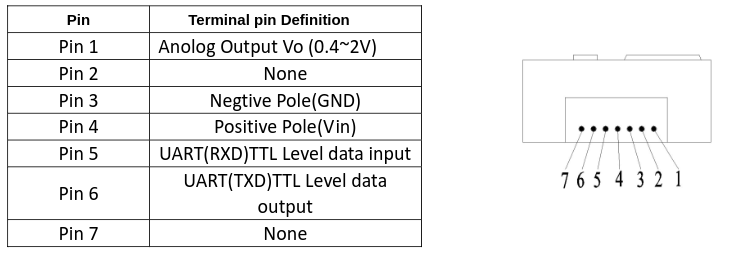
NOTE: Make sure you count the pins from the correct location
I used these pins
const int PMS_RX = 32;
const int PMS_TX = 33;
That is:
- Pin 32 on the ESP32 board is connected to TX of PM sensor (Pin 5)
- Pin 33 to Pin 4
- VCC
- GND
Note: We only need to use these 4 pins.
- I used the Serial Port 2
#define CO2_TX 16
#define CO2_RX 17
#define CO2_BAUDRATE 9600- VCC
- GND
- Pin 5 (TX) on the sensor to pin 17 (RX) on the esp32 board
- Pin 6 to Pin 17
I use the same single USB connection to the ESP32 to power everything, seems to be more than enough
- Update the WiFi SSID and Password
- Update the MQTT broker IP, username, password and the topic name
- Update the serial ports to appropriate values, use correct pin numbers
- https://github.com/fu-hsi/PMS
- https://github.com/plapointe6/EspMQTTClient
- https://github.com/WifWaf/MH-Z19
Checkout THIS directory. The docker-compose.yaml file sets up the following
- mqtt : will receive sensor data from esp32
- telegraf : will forward metrics from mqtt to influxdb2
- influxdb2 : final destination of sensor readings
- Grafana : Will come to this later
You can run docker-compose up from that directory and it should bring everything up.
You can use the following commands to create a user and password for mosquitto
docker exec -it mqtt5 /bin/sh
mosquitto_passwd -c /mosquitto/config/pwfile <username>
chmod 0700 /mosquitto/config/pwfile
exitAfter installing the mosquitto package on Linux (Or refer THIS for other OS)
You can test that it works by first starting a subscriber using
mosquitto_sub -h localhost -t sensors/readings -u <username> -P <the password>And then publish a message to the same topic
mosquitto_pub -h localhost -t sensors/readings -m "hi" -u <username> -P <the password>You should see hi showing up on the subscriber window
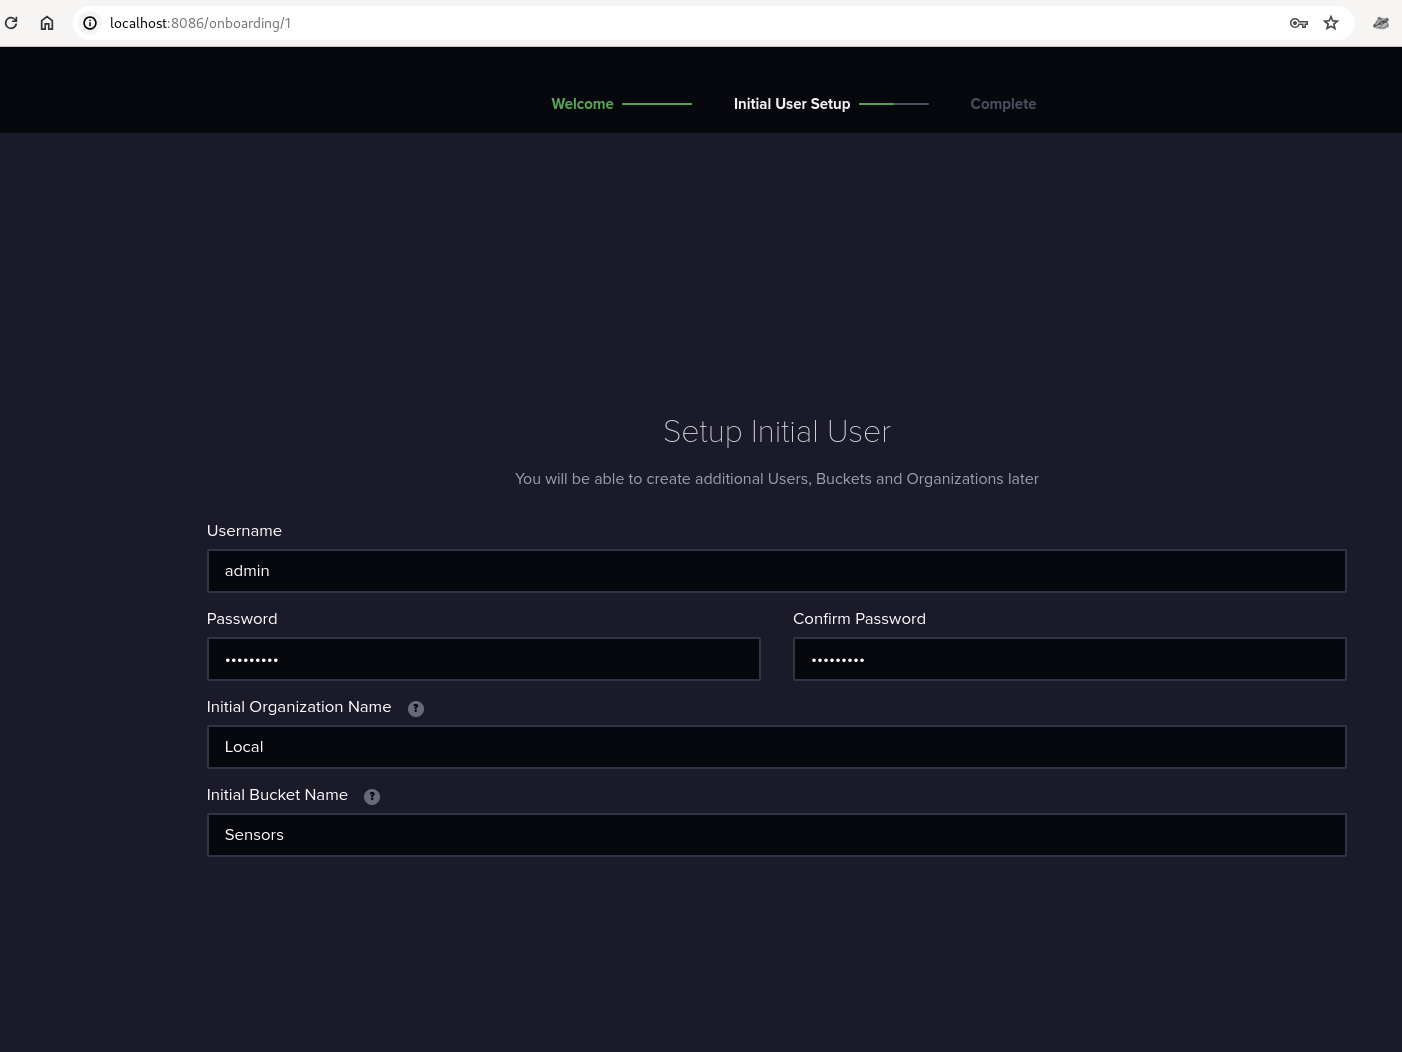
Open localhost:8086 on your browser. Assuming Docker runs on your local machine, if it is on a different host, open that host's IP address:8086
Take note of the Organization name and Bucket name because we will use this with telegraf
Once that is done:
- Go to
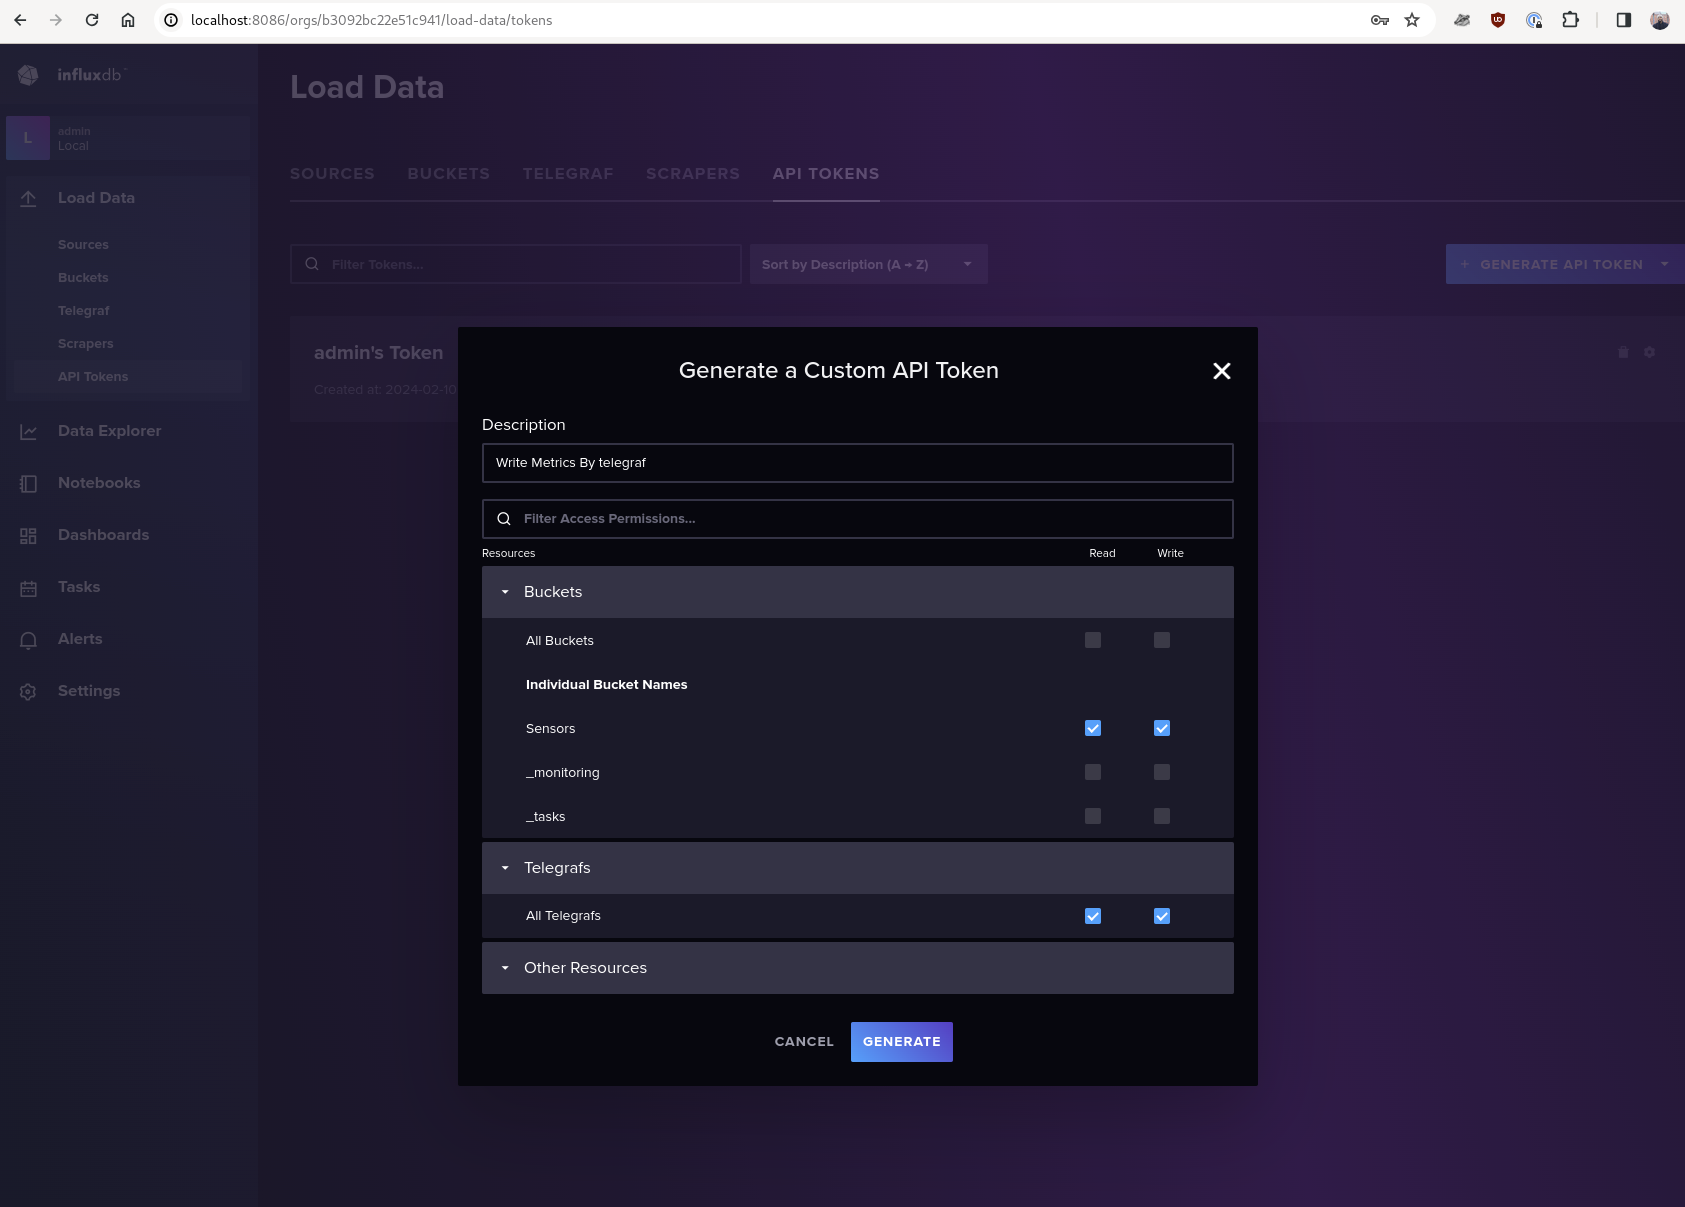
Load Data->API Tokens->Generate API Token - We will create a custom token that gives read/write access to
Sensorsbucket - Generate
Ensure telegraf.conf is accurate with all the credentials.
Also make sure to update the influxdb token
- Open http://localhost:3000 to open grafana dashboard
- Use username
adminand passwordadmin - It will ask you to generate a new password, do that
- Click on the top left side (hamburger) -> Go to connections -> Add new connection
- Search for
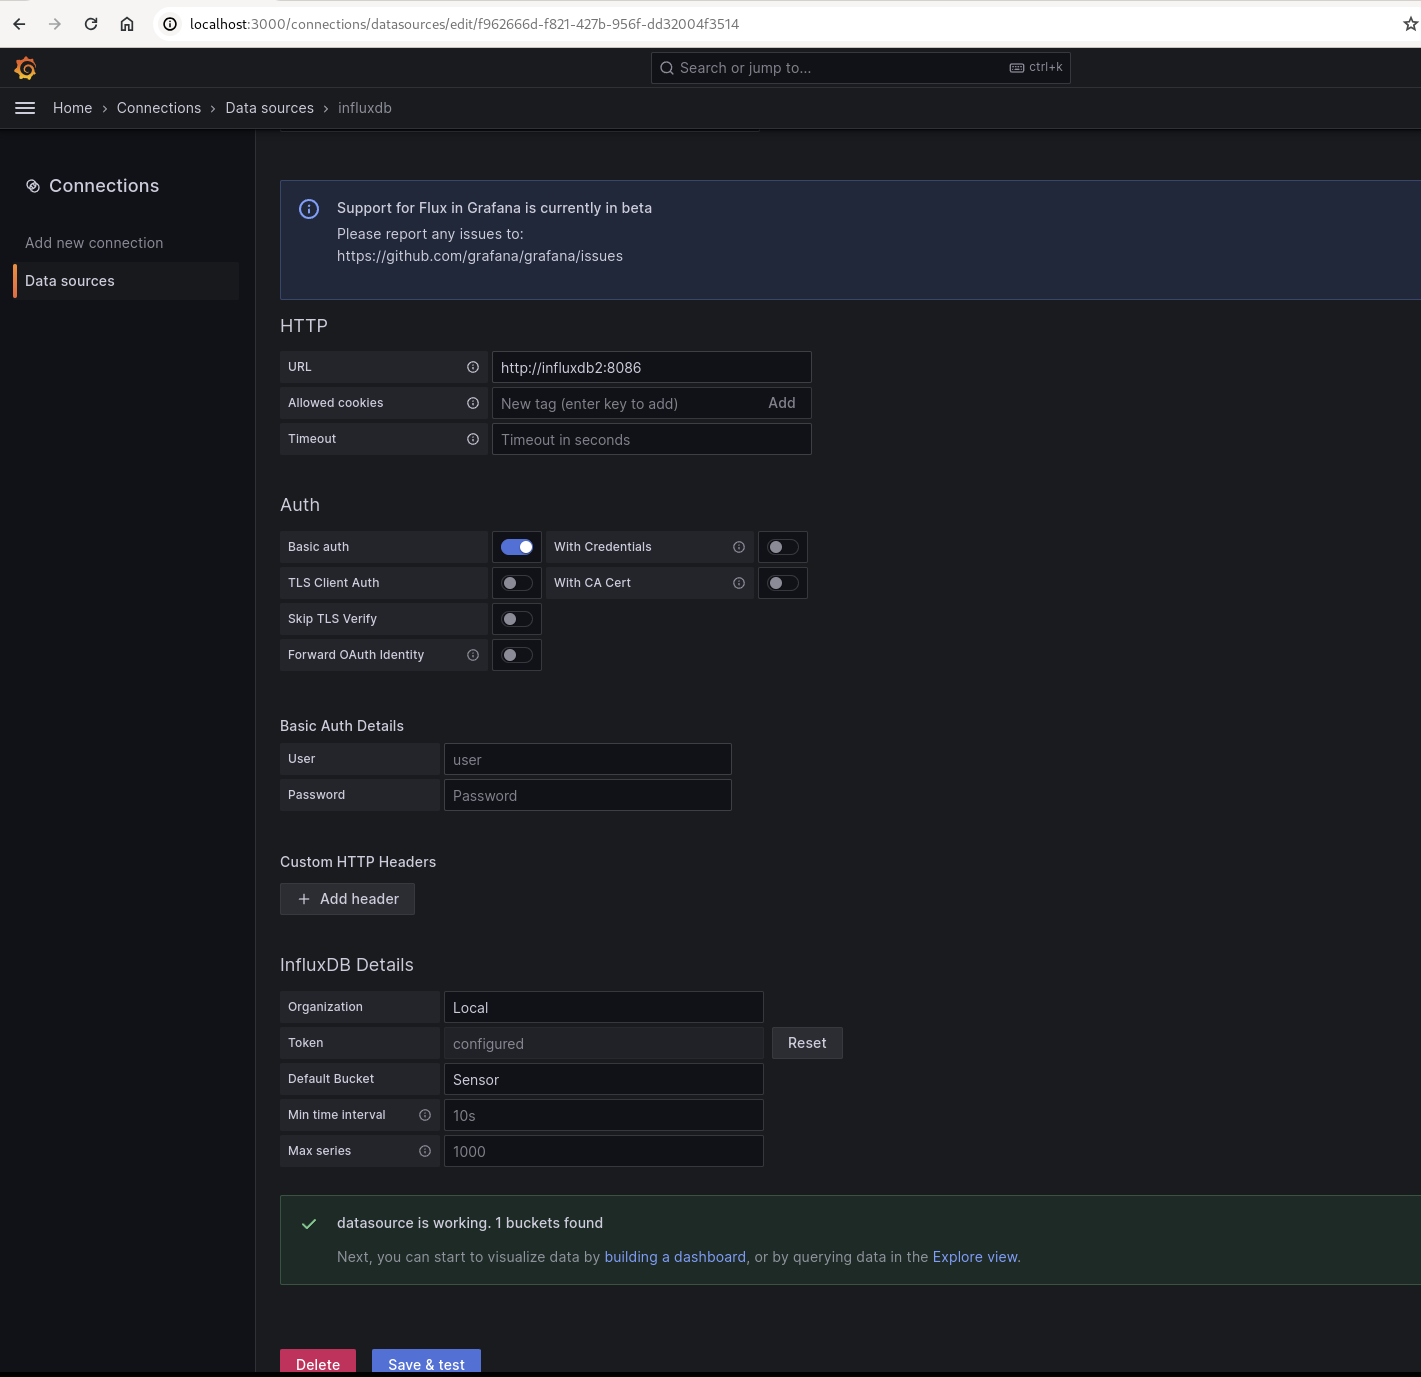
Influxdb - Fill in the details like below:
- URL :
http://influxdb2:8086
- Organization: Give what you created earlier (I had
Local) - Token : Paste the token you created for telegraf (should be in telegraf.conf)
- Default bucket : Enter the bucket name (I had
Sensor) - Save & test
If you had all the credentials correct, it should say datasource is working. 1 buckets found
At this point, you should have sensor data coming into InfluxDB and you should be able to create any dashboard you like. You can start by going to the datasources and doing explore to see the available metrics
InfluxDB2 uses Flux as the query language and in my opinion, it is kinda not my favourite.
But here is a sample query
from(bucket: "Sensors")
 |> range(start: v.timeRangeStart, stop: v.timeRangeStop)
 |> filter(fn: (r) => r._measurement == "mqtt_consumer" and r._field == "co2")
 |> aggregateWindow(every: ${interval}, fn: mean)
You should be able to create queries as you like.
I have included my full dashboard HERE which you can use as you please. You may import it into your grafana and modify as you need.
