A PowerShell front-end for the Windows debugger engine.
Ready to tab your way to glory? For a quicker intro, take a look at Getting Started.
-
This project is not produced, endorsed, or monitored by the Windows debugger team. While the debugger team welcomes feedback about their API and front ends (windbg, kd, et al), they have no connection with this project. Do not file bugs or feedback to the debugger team concerning this project.
-
This is not a funded project: it has no official resources allocated to it, and is only worked on by volunteers. Do not take any production dependency on this project unless you are willing to support it completely yourself. Feel free to file Issues and submit Pull Requests, but understand that with the limited volunteer resources, it may be a while before your submissions are handled.
-
This is an experimental project: it is not fully baked, and you should expect breaking changes to be made often.
Corollary of above disclaimers: I would avoid attaching DbgShell to live targets of high value.
https://aka.ms/dbgshell-latest
Have you ever tried automating anything in the debugger? (cdb/ntsd/kd/windbg) How did that go for you?
The main impetus for DbgShell is that it's just waaaay too hard to automate anything in the debugger. There are facilities today to assist in automating the debugger, of course. But in my opinion they are not meeting people's needs.
- Using the built-in scripting language is arcane, limited, difficult to get right, and difficult to get help with.
- DScript is kind of neat, but virtually unknown, and it lacks a REPL, and it's too low-level.
- Writing a full-blown debugger extension DLL is very powerful, but it's a significant investment—way too expensive for solving quick, "one-off" problems as you debug random, real-world problems. Despite the cost, there are a large number of debugger extensions in existence. I think there should not be nearly so many; I think the only reason there are so many is because there aren't viable alternatives.
- Existing attempts at providing a better interface (such as PowerDbg) are based on "scraping" and text parsing, which is hugely limiting (not to mention idealogically annoying) and thus are not able to fulfill the promise of a truly better interface (they are only marginally better, at best).
- Existing attempts to provide an easier way to write a debugger extension are merely a stop-gap addressing the pain of developing a debugger extension; they don't really solve the larger problem. (for instance, two major shortcomings are: they are still too low-level (you have to deal with the dbgeng COM API), and there's no REPL)
- The debugger team has recently introduce Javascript scripting. Javascript is a much better (and more well-defined) language than the old windbg scripting language, but I think that PowerShell has some advantages, the largest of which is that nobody really uses a Javascript shell--PowerShell is much better as a combined shell and scripting language.
The goal of the DbgShell project is to bring the goodness of the object-based PowerShell world to the debugging world. When you do 'dt' to dump an 'object', you should get an actual object. Scripting should be as easy as writing a PowerShell script.
The DbgShell project provides a PowerShell front-end for dbgeng.dll, including:
- a managed "object model" (usable from C# if you wished), which is higher-level than the dbgeng COM API,
- a PowerShell "navigation provider", which exposes aspects of a debugging target as a hierarchical namespace (so you can "cd" to a particular thread, type "dir" to see the stack, "cd" into a frame, do another "dir" to see locals/registers/etc.),
- cmdlets for manipulating the target,
- a custom PowerShell host which allows better control of the debugger CLI experience, as well as providing features not available in the standard powershell.exe host (namely, support for text colorization using ANSI escape codes (a la ISO/IEC 6429))
The custom host is still a command-line (conhost.exe-based) program (analogous to
ntsd/cdb/kd), but it can be invoked from windbg (!DbgShell).
In addition to making automation much easier and more powerful, it will address other concerns as well, such as ease of use for people who don't have to use the debuggers so often. (one complaint I've heard is that "when I end up needing to use windbg, I spend all my time in the .CHM")
For seasoned windbg users, on the other hand, another goal is to make the transition as
seamless as possible. So, for instance, the namespace provider is not the only way to
access data; you can still use traditional commands like "~3 s", "k", etc.
I'm not only talking about the sort of thing where you open up a text editor and write some big script to do something complex—I'm also talking about being able to whip out relatively simple stuff directly on the command line. There are many situations where you would like to be able to use a little bit of logic, but nothing so big or re-usable that you would even want to save it. It should be easy to just whip off "one-liners" like "break on CreateFile if the file being opened is on the user's desktop and function Blah is on the stack."
Let me be clear: it took me approximately 4 years to "warm up" to PowerShell. I feel it has sharp edges, aspects that are just plain difficult, and plenty of bugs, both in design and implementation. Sometimes it really irritates me. However, the benefits of PowerShell are compelling, and have convinced me that it's the best thing to use for this project:
- It is both a scripting environment and a CLI environment. The fact that it has to do both leads to some negative things like a steeper learning curve, but in the end it is extremely handy, because you want to be able to both do stuff quickly in a command-line REPL, as well as write full-featured, robust scripts.
- It is very discoverable—things like
Get-Command, tab completion, the ability to expose hierarchical data like a filesystem, the facilities for providing and synthesizing help, are very good. - Tab completion. I know I mentioned it in the previous bullet, but it's awesome enough to get its very own bullet.
- The object pipeline: the object-oriented nature of the PowerShell pipeline is so much
more powerful and easy to use than the bad old days of string-parsing-based scripting
that it's not even funny. Imagine doing "
dt" to "dump" an "object", and actually getting an object. DbgShell does that. - People know it: I estimate that the number of people who know PowerShell and/or C# is at least a handful of orders of magnitude larger than the people who know windbg scripting techniques. That means more people will be able to easily "pick up" a PowerShell-based debugger; and it also means that when people need help, the pool of potential helpers is much larger (for scripting-related issues, anyway).
- PowerShell is still a general-purpose shell: when using DbgShell, you have access to not
just debugger commands, but you can "
cd" over to the filesystem, registry, AD, etc.; you can executeSend-MailMessage,Get-WmiObject,Invoke-WebRequest,Invoke-RestMethod, run arbitrary programs, etc.
DbgShell has been in "prototyping mode" for a long time. I have spent a lot of time figuring how something could or should be done, but not necessarily "finishing" everything. There are a huge number of TODOs in the current code. So although it has started to become actually useful, the project is still pretty green. However, it can definitely demonstrate enough to give you a good taste of what it should be like.
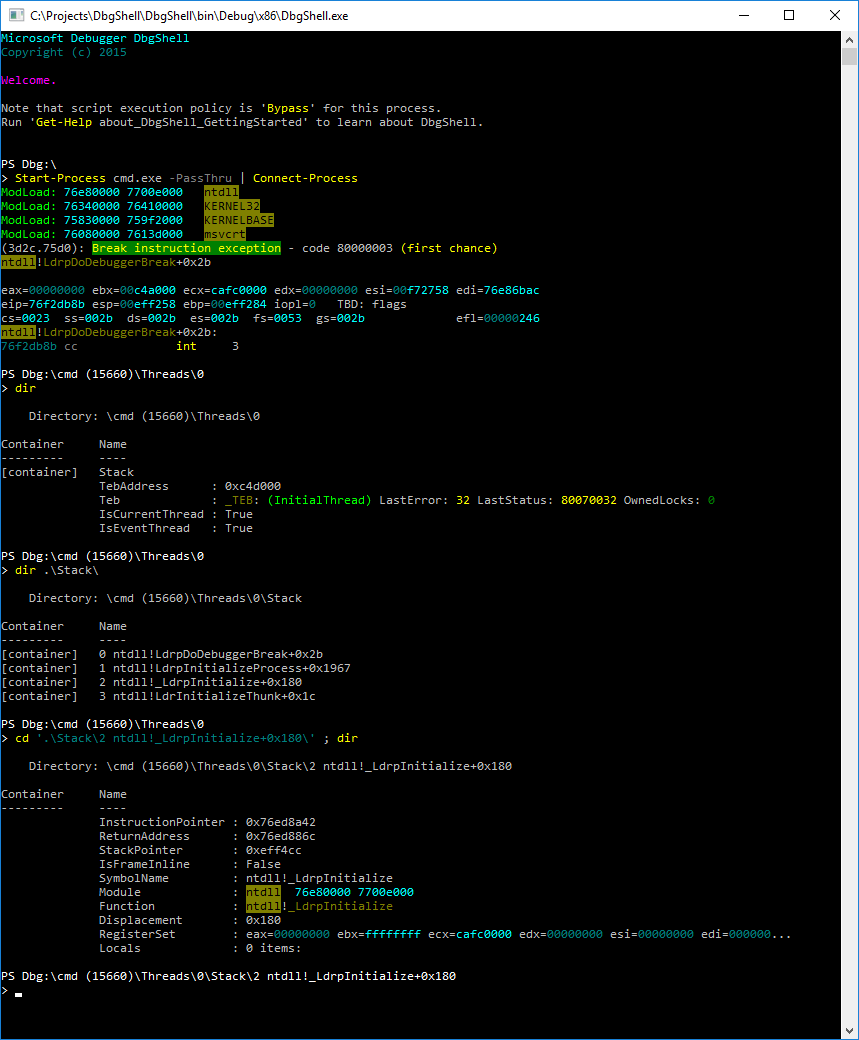
Below are some screenshots. It's important to note that nothing you see is dbgeng text
output. Although some stuff in the output will look familiar, that is only because I have
used PowerShell's formatting and output features to customize how certain objects are
displayed—all the output you see actually corresponds to real, full .NET objects. For
instance, those ModLoad messages each correspond to a MS.Dbg.ModuleLoadedEventArgs
object, which has more properties than what get displayed when sent to Out-Default.
There is no string parsing of anything from dbgeng whatsoever. (Well... almost. I've made
a few compromises where there is no other way to get information. For instance,
disassembly stuff, or parsing the symbolic name of an adjustor thunk function to find the
offset.)
This is a sort of "hello world" scenario: attaching to an instance of cmd.exe. I first use
the PowerShell built-in command Start-Process, then pipe the output to the DbgShell
command Connect-Process, and then poke around the namespace:
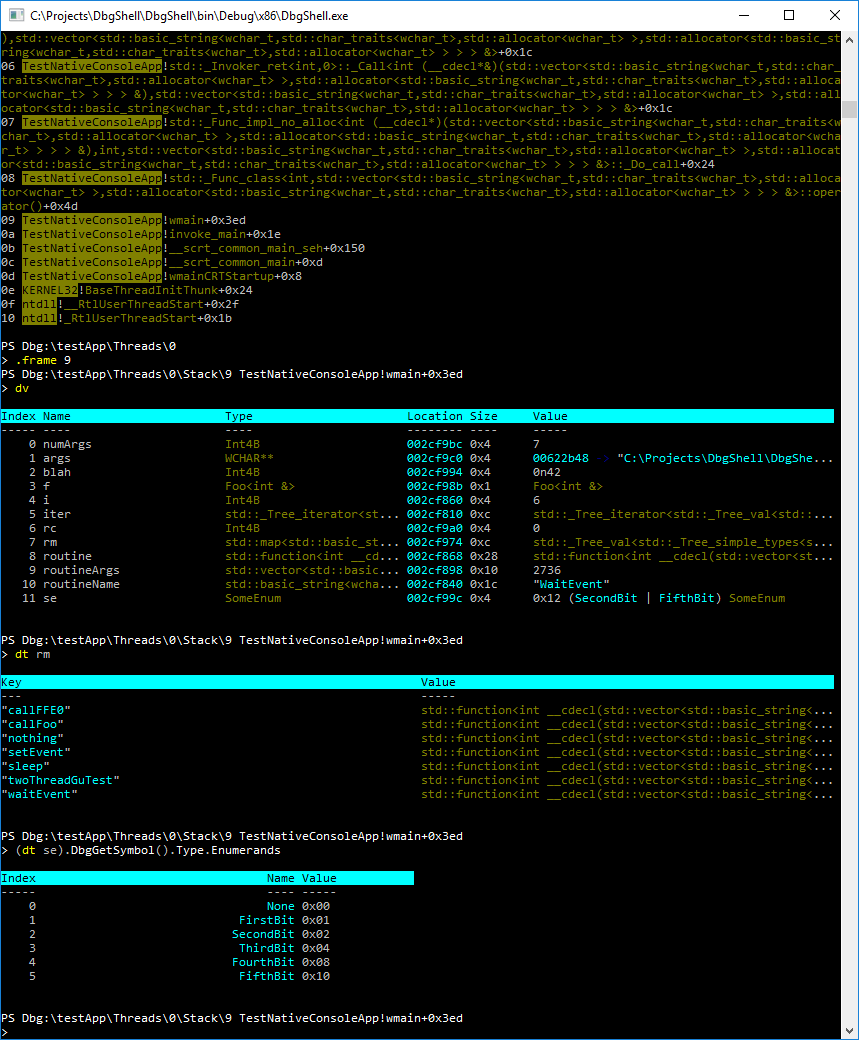
Here I have attached to a test program, and looked at the stack, switched to a particular
stack frame, dumped locals, inspected the value of a local std::map, and inspected some
type information for a local enum value. Note the display of the enumeration value: not
only does DbgShell handle looking up the symbolic name for single enumerands, but also
when multiple enumerands are OR'ed together. You can't tell this from the screenshot, but
there is tab completion for all of this stuff.
- Color: support for text colorization using ANSI escape codes (a la ISO/IEC 6429)
- Custom formatting engine: Don't like .ps1xml stuff? Me neither. In addition to standard table, list, and custom views, you can define "single-line" views which are very handy for customizing symbol value displays.
- Custom symbol value conversion: For most variables, the default conversion and display are good. But sometimes, you'd like the debugger to do a little more work for you. The symbol value conversion feature allows, for instance, STL collection objects to be transformed into .NET collection objects that are much easier to deal with.
- Derived type detection: For when your variable is an IFoo, but the actual object is a FooImpl.
- Rich type information: exposed for your programmatic pleasure.
- Q: Does it work in WinDbg? I will only use WinDbg. A: Yes--load up the
DbgShellExt.dll extension DLL, and then run "
!dbgshell" to pop open a DbgShell console.
- The biggest deficiency currently is that it does not support kernel mode well (if you are already in the proper context, you can display values, but you can't change context from within DbgShell, and the namespace is not wired up).
- Although you can load and execute traditional debugger extensions in the usual way, there are still many windbg commands missing.
- Remotes are not supported: the dbgeng API supports connecting to a remote debugger. Unfortunately, the symbol and type information exposed by the dbgeng API is critically insufficient for DbgShell's needs, so DbgShell uses the dbghelp API. Unfortunately, there is no such thing as remote dbghelp. We will need to work with the debugger team to solve this problem.
Licensed under the MIT License.
This project welcomes contributions and suggestions. Most contributions require you to agree to a Contributor License Agreement (CLA) declaring that you have the right to, and actually do, grant us the rights to use your contribution. For details, visit https://cla.microsoft.com.
When you submit a pull request, a CLA-bot will automatically determine whether you need to provide a CLA and decorate the PR appropriately (e.g., label, comment). Simply follow the instructions provided by the bot. You will only need to do this once across all repos using our CLA.
See Contributing for more information about contributing to the project.
This project has adopted the Microsoft Open Source Code of Conduct.
For more information see the Code of Conduct FAQ or contact opencode@microsoft.com with any additional questions or comments.
You can find a short (3 minute) video introduction here: https://youtu.be/ynbg2zZ1Igc

