Problem solving focused statistical and machine learning software toolkit.
Report Bug
·
Request Feature
In today's world, the fields of statistics and machine learning hold immense potential for solving real-world problems and significantly impacting businesses and daily life. However, the complexity and learning curve associated with these fields can be daunting, making it challenging for those interested to effectively utilize these tools. Recognizing this gap, we've developed AURORA, a software solution crafted to make the power of statistical and machine learning models more accessible to everyone.
AURORA is designed with the principle that tools that are capable of addressing a diverse range of problems should be within reach of anyone interested in applying scientific methods to their decision-making processes. Our aim is to remove the barriers posed by the need for specialized training, making it easier for individuals to leverage these models in their activities.
Aurora comprises three main components:
- Algorithms Component: This section encompasses various algorithms essential to Aurora's functionality.
- Data Gathering Module: This module is responsible for collecting data from multiple sources, including web scraping tools.
- Automated Problem Solver Module: Utilizing Natural Language Processing, this module assists users in navigating and applying interactively Aurora's capabilities to address their specific issues effectively.
Using Text Classifier from Aurora to predict if a message is spam or not
Predict employee churn using AURORA
Make sure you have Python >=3.9 installed
- Clone the repo
git clone https://github.com/MariusNea/Aurora.git
- Install libraries
pip install -r requirements.txt
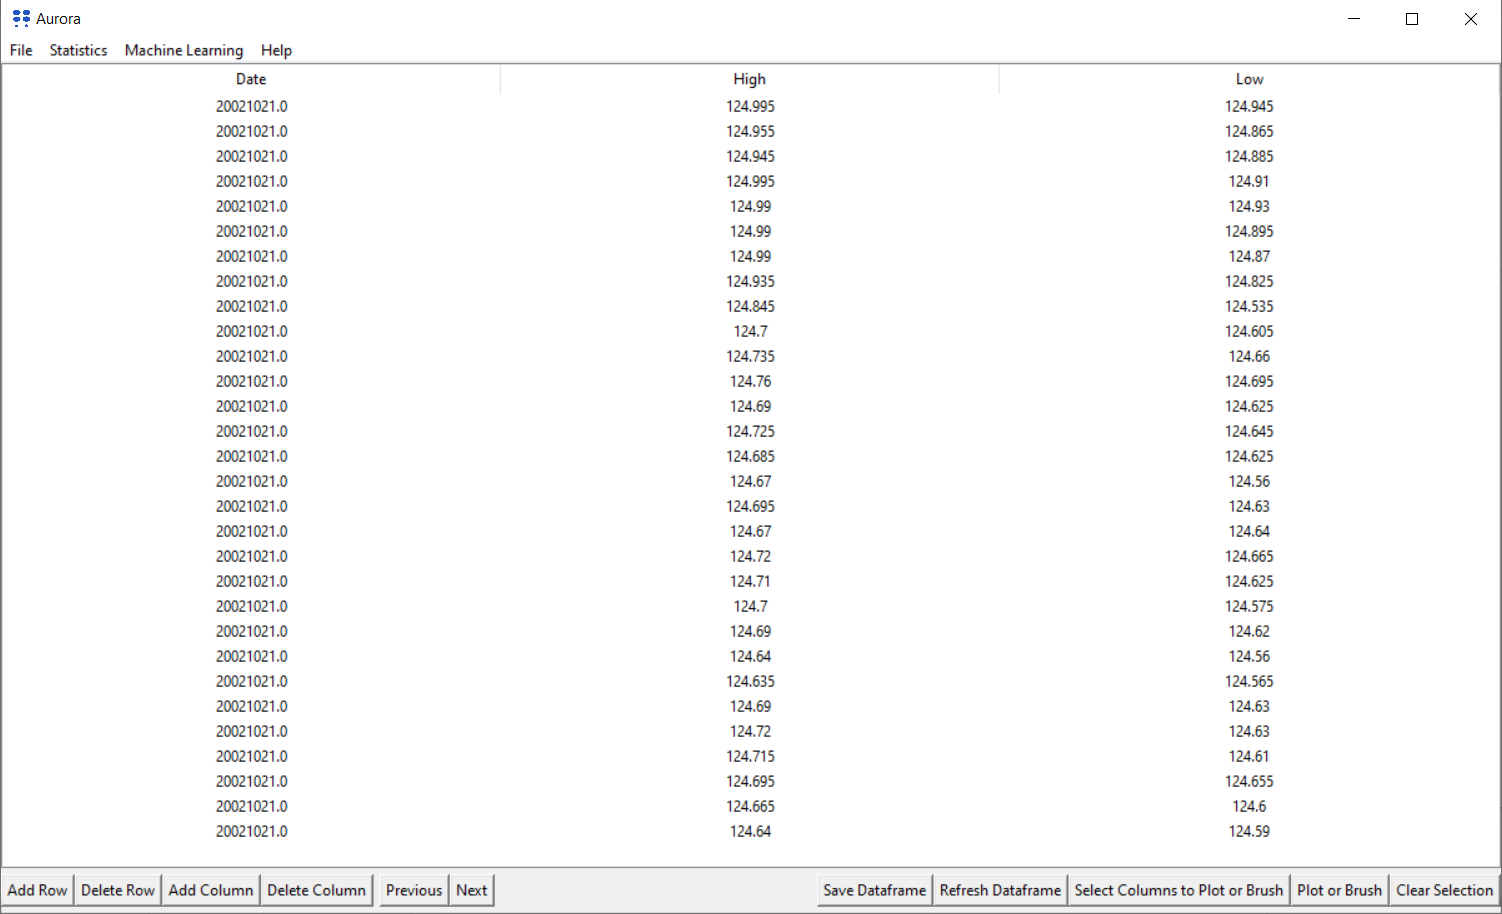
python -m AuroraThe process commences with your .csv file containing the requisite information, which is initially imported as a dataframe into AURORA. Subsequently, all models are applied based on this dataframe.
Every plugin comes with its own documentation except the core plugins which are described here.
Within the dataframe, all columns except the last one function as features, while the final column represents the predicted variable. The Linear Regression algorithm can accommodate any type of numerical data in the predicted column, whereas Logistic Regression and Decision Trees are suitable for categorical data.
This test is conducted between two consecutive columns in the dataframe. For instance, if there are four columns named data_1, data_2, data_3, and data_4, the Mann-Whitney U Test is performed between data_1 and data_2, and then between data_3 and data_4, respectively. Consequently, the dataframe must have an even number of columns.
Firs column of the dataframe must contain your tests categories. All other column must be numeric and represents the results of your tests. If your dataframe contains cells without values, AURORA will clean it automatically.
For a practical example, let's consider a scenario where a researcher wants to analyze the impact of three different types of fertilizer on the growth of plants. The researcher has three groups of plants, each group receiving a different type of fertilizer. The goal is to see if there's a significant difference in the growth of plants (measured in height) across these groups.
CSV example:
| No | Fertilizer_Type | Height_After_1_Month | Height_After_2_Months | Height_After_3_Months |
|---|---|---|---|---|
| 0 | Type_A | 5.1 | 7.2 | 9.8 |
| 1 | Type_B | 4.8 | 7.0 | 10.1 |
| 2 | Type_C | 5.3 | 7.9 | 10.5 |
| 3 | Type_A | 5.5 | 7.5 | 9.9 |
| 4 | Type_B | 4.9 | 7.1 | 10.0 |
| 5 | Type_C | 5.0 | 7.8 | 10.2 |
| ... |
This plugin uses Isolation Forest algorithm to detect outliers in timeseries. From your dataframe select column on which you want to apply algorithm. The result will be a plot with both inliers(red) and outliers (blue).
To apply this plugin on your dataframe, the last column must be the target column and others columns must be features columns. The output will be a .csv file with components.
- Implement Plot & CrossSelect
- Implement Dataframe Edit
- Implement Dataframe Pagination for fast loading
- Implement Linear Regression
- Implement Logistic Regression
- Implement Decision Tree
- Implement Time Series Decomposition
- Implement One Way ANOVA
- Implement Canonical Correlation Analysis
- Implement Exponential Smoothing Model
- Implement Mann-Whitney U Test
- Implement Poisson Probabilities
- Implement Anomaly (Outliers) Detection
- Implement Principal Component Analysis
- Implement Support Vector Machines
- Implement K-Nearest Neighbors
- Implement K-Means
- Implement Histogram
- Implement Text Classifier
- Implement Denoising Autoencoder
- Implement XGBoost (Regression and Classification)
- Implement Pearson Correlation
- Implement Monte Carlo Simulation
- Implement Interactive Web Scraper
- Develop multiple methods for interactive data gathering
- Implement Automated Problem Solver
Contributions are what make the open source community such an amazing place to learn, inspire, and create. Any contributions you make are greatly appreciated.
If you have a suggestion that would make this better, please fork the repo and create a pull request. You can also simply open an issue with the tag "enhancement". Don't forget to give the project a star! Thanks again!
For contributing to the project follow steps described here
This project is dual licensed. Distributed under the GPL-2.0 license and a commercial license. See LICENSE.txt for GPL-2.0.
Find more here


