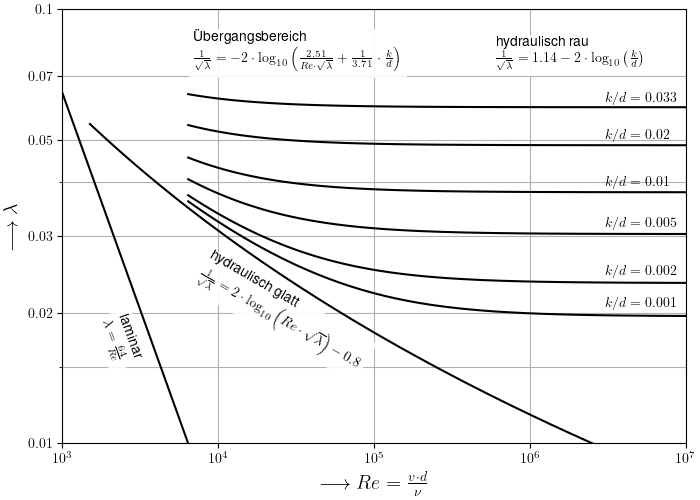
In engineering, the Moody chart or Moody diagram (also Stanton diagram) is a graph in non-dimensional form that relates the Darcy–Weisbach friction factor fD, Reynolds number Re, and surface roughness for fully developed flow in a circular pipe.
https://en.wikipedia.org/wiki/Moody_chart
pip install git+https://github.com/MarkusPic/moody_chart.gitfrom moody_chart import moody_chart
fig, ax = moody_chart()
fig.set_size_inches(7, 5)
fig.savefig('moody_chart.png')