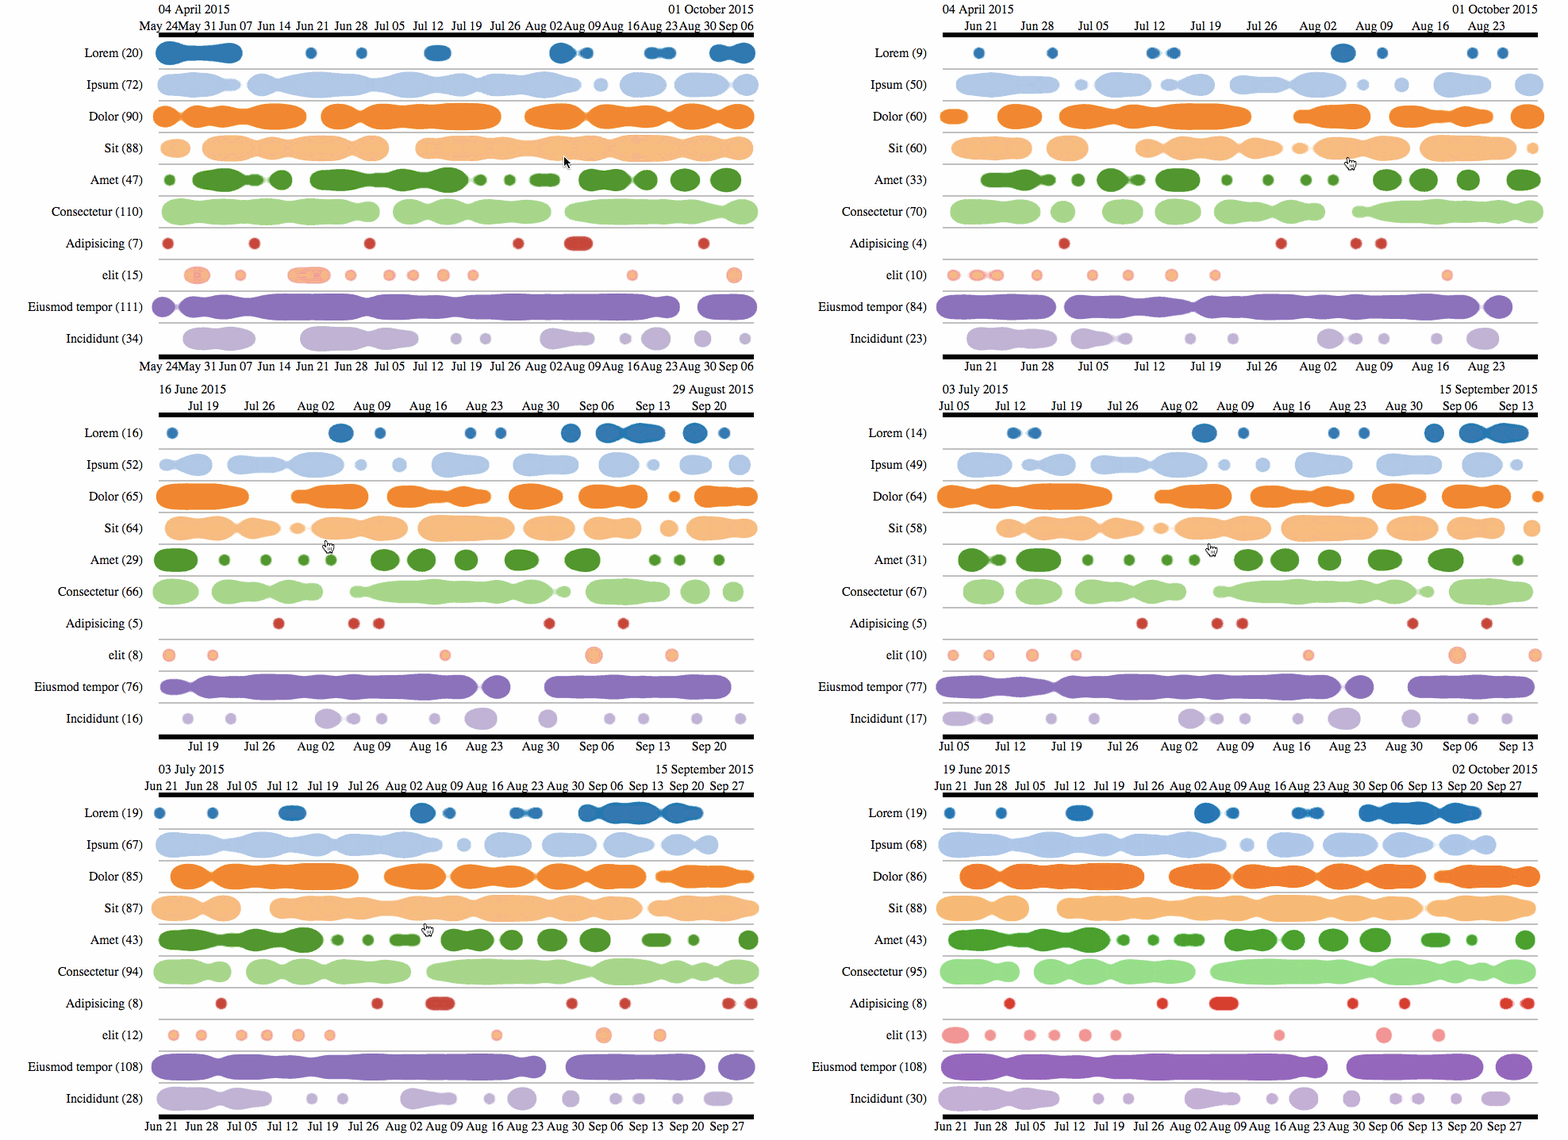
A time based / event series interactive visualization using d3.js. Use drag and zoom to navigate in time.
You can use npm to install event-drops
npm install event-drops --save
Additionally you can also use bower
bower install event-drops --save
Include the src/eventDrops.js script in your page after d3:
<script src="path/to/d3.js"></script>
<script src="src/eventDrops.js"></script>Tip: You can also use RequireJs, see example/amd for an implementation.
In the HTML source, create a new EventDrops chart, bind data to a DOM element, then call the chart on the element.
var eventDropsChart = d3.chart.eventDrops();
d3.select('#chart_placeholder')
  .datum(data)
  .call(eventDropsChart);
The data must be an array of named time series. For instance:
var data = [
  { name: "http requests", dates: [new Date('2014/09/15 13:24:54'), new Date('2014/09/15 13:25:03'), new Date('2014/09/15 13:25:05'), ...] },
  { name: "SQL queries", dates: [new Date('2014/09/15 13:24:57'), new Date('2014/09/15 13:25:04'), new Date('2014/09/15 13:25:04'), ...] },
  { name: "cache invalidations", dates: [new Date('2014/09/15 13:25:12'), ...] }
];EventDrops follows the d3.js reusable charts pattern to let you customize the chart at will:
var eventDropsChart = d3.chart.eventDrops()
  .width(1200)
  .hasTopAxis(false);
Configurable values:
start: start date of the scale. Defaults tonew Date(0).end: end date of the scale. Defaults tonew Date()width: width of the chart in pixels. Default to 1000px.margin: margins of the graph in pixels. Defaults to{ top: 60, left: 200, bottom: 40, right: 50 }locale: locale used for the X axis labels. See d3.locale for the expected format. Defaults to null (i.e. d3 default locale).axisFormat: function receiving the d3 axis object, to customize tick number and size.tickFormat: tickFormat for the X axis. See d3.timeFormat.multi() for expected format.eventHover: function to be called when hovering an event in the chart. Receives the DOM element hovered (uses event delegation).eventZoom: function to be called when done zooming on the chart. Receives the d3 scale at the end of the zoom.hasDelimiter: whether to draw time boundaries on top of the chart. Defaults to true.hasTopAxis: whether the chart has a top X axis. Accepts both a boolean or a function receiving the data of the graph that returns a boolean.hasBottomAxis: same as topAxis but for the bottom X axiseventLineColor: The color of the event line. Accepts a color (color name or#ffffffnotation), or a function receiving the eventData and returning a color. Defaults to 'black'.eventColor: The color of the event. Accepts a color (color name or#ffffffnotation), or a function receiving the eventData and returning a color. Defaults to null. EventLineColor will be ignored if this is used.minScale: The minimum scaling (zoom out), default to 0.maxScale: The maximum scaling (zoom in), default to Infinity.
You can style all elements of the chart in CSS. Check the source to see the available selectors.
First, install the dependencies:
$ npm installSource files are located under the lib/ folder, and use browserify for dependency management.
Once your changes are finished, regenerate the combined and minified source under src/ by calling the following command:
$ gulp browserifyTo update your change dynamically and have sourcemap that allow the console to map to the original file type:
$ gulp watch
To run the test :
$ gulp test // all test
$ gulp karma-test
$ gulp mocha-test
You can test the result by launching a server at the project root, and navigating to the examples/ directory.
EventDrops is released under the MIT License, courtesy of marmelab and Canal Plus.
