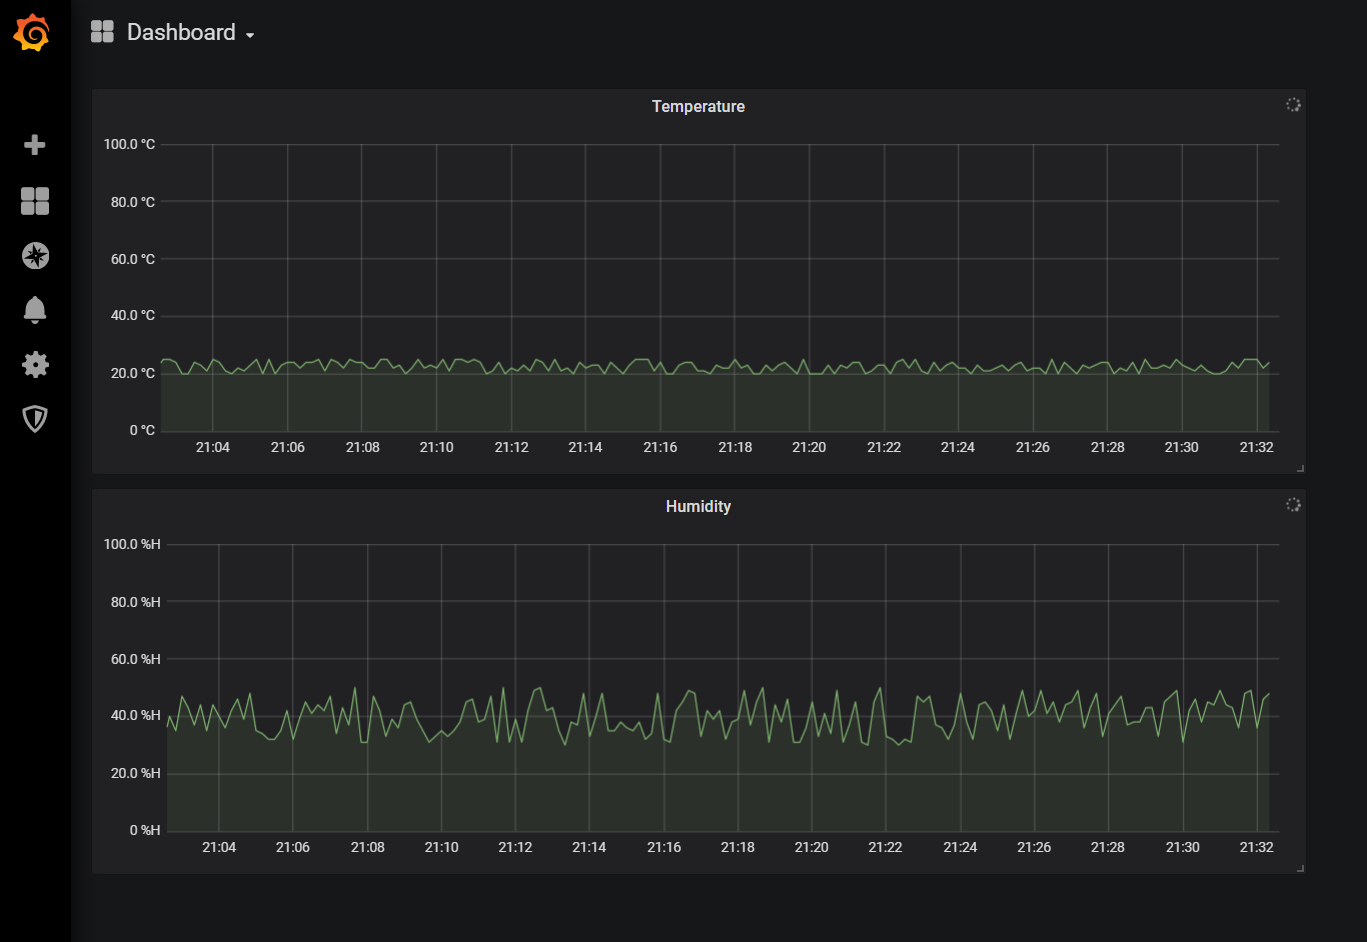
A dashboard to show temperature and humidity readings from Raspberry Pi Zero.
Adapted from Balena Sense project https://github.com/balenalabs/balena-sense for Raspberry Pi Zero and DHT22 sensor.
I recommend starting with this tutorial: https://www.balena.io/docs/learn/getting-started/raspberry-pi/python/
- Flask webserver - interface to the sensor.
- Influx DB - time series db to store the metrics.
- Grafana - UI for monitoring and analytics.
- Telegraf - an agent to collect metrics. Takes a reading every 10 seconds.
- Sensor driver - a deprecated Adafruit_DHT python library installed through wheel.
- Test mode - runs without sensors. Controlled by the HAS_SENSORS env variable.
- Raspberry Pi Zero Wireless WH (Pre-Soldered Header).
- DHT22 AM2302 Digital Temperature and Humidity Sensor Module. The sensor is connected to +5V, Ground and Pin 38 (GPIO20).
balena login
cd <project_folder>
balena push <app-name>
- This requires "local mode" to be enabled on the device in Balena Cloud
- ssh requires a "development" OS image
# build locally
balena push <device_ip> --nolive

# ssh to the local device
ssh root@<device_ip> -p 22222

# ssh to a service
balena ssh <device_IP> <service_name>

#check what containers are running
ssh root@<device_ip> -p 22222
balena-engine ps -a

# a container can be forced to stay live and not exit by adding this to Dockerfile
CMD tail -f /dev/null
