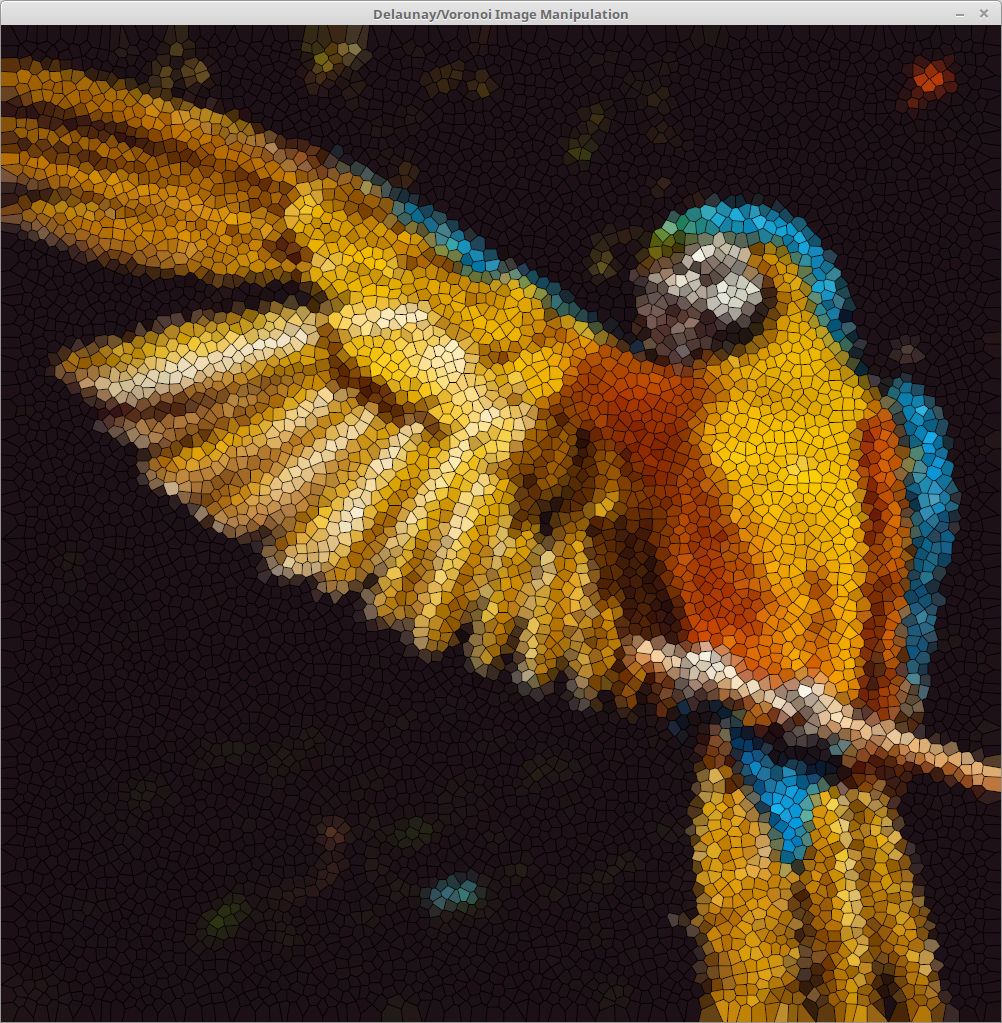
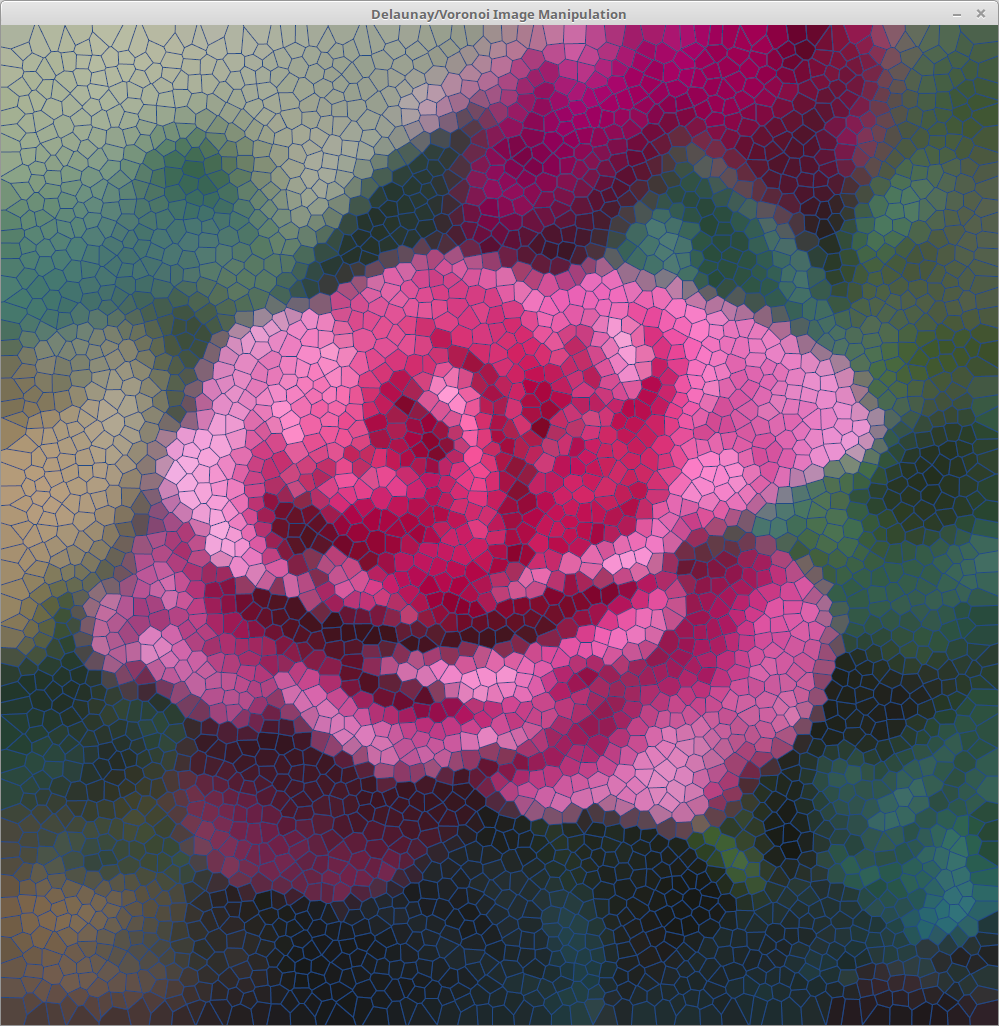
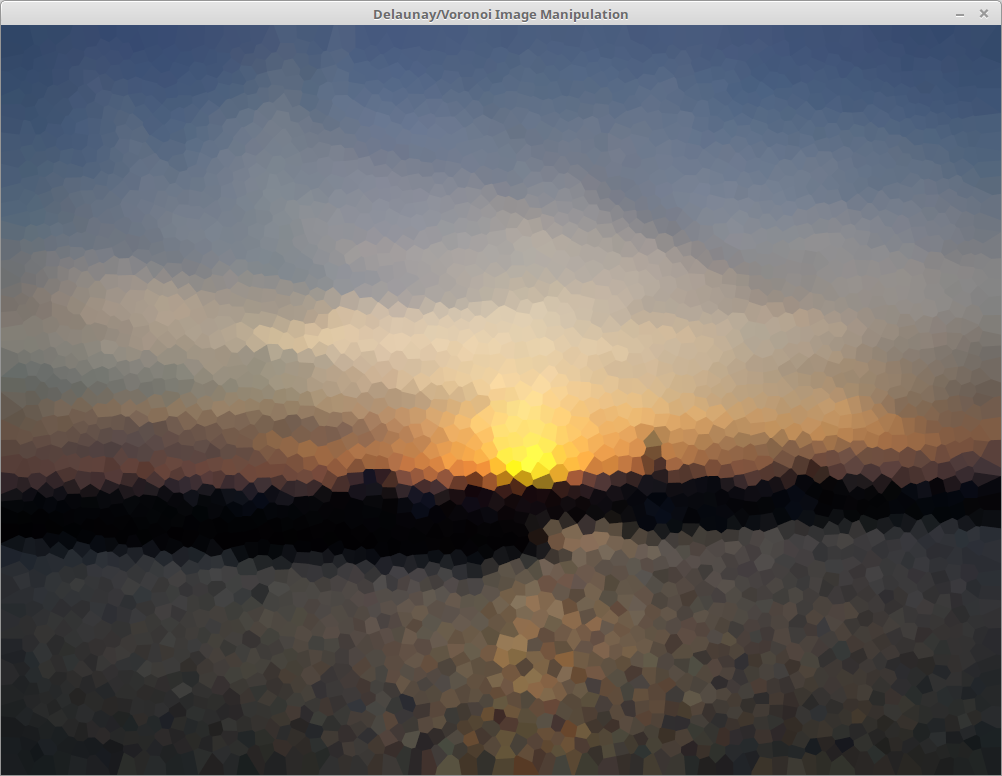
This project implements a small, lightweight tool for real-time image manipulation with Voronoi/Delaunay data structures.
The focus of this project was, to enable users without knowledge of Voronoi or Delaunay specifics, to experiment and play with different looks a Voronoi or Delaunay structure can give to an image.
Some time ago I implemented a similar effect (also Voronoi/Delaunay) in Python (github.com/MauriceGit/Delaunay_Triangulation). The main goal for this new project was, to make it a lot more robust, user friendly, fast and actually useable.
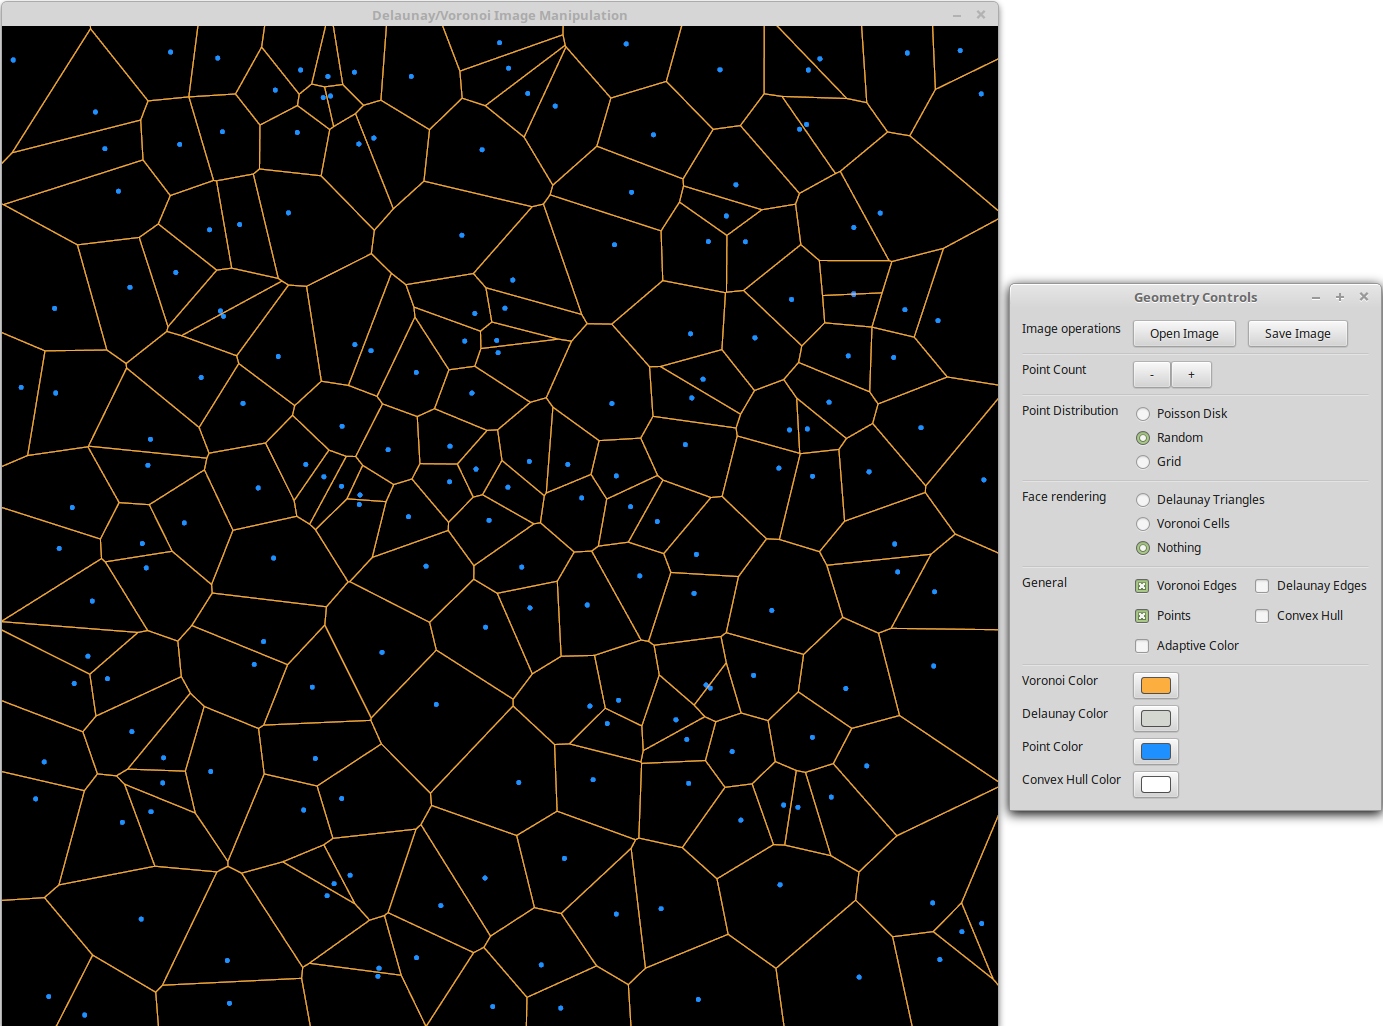
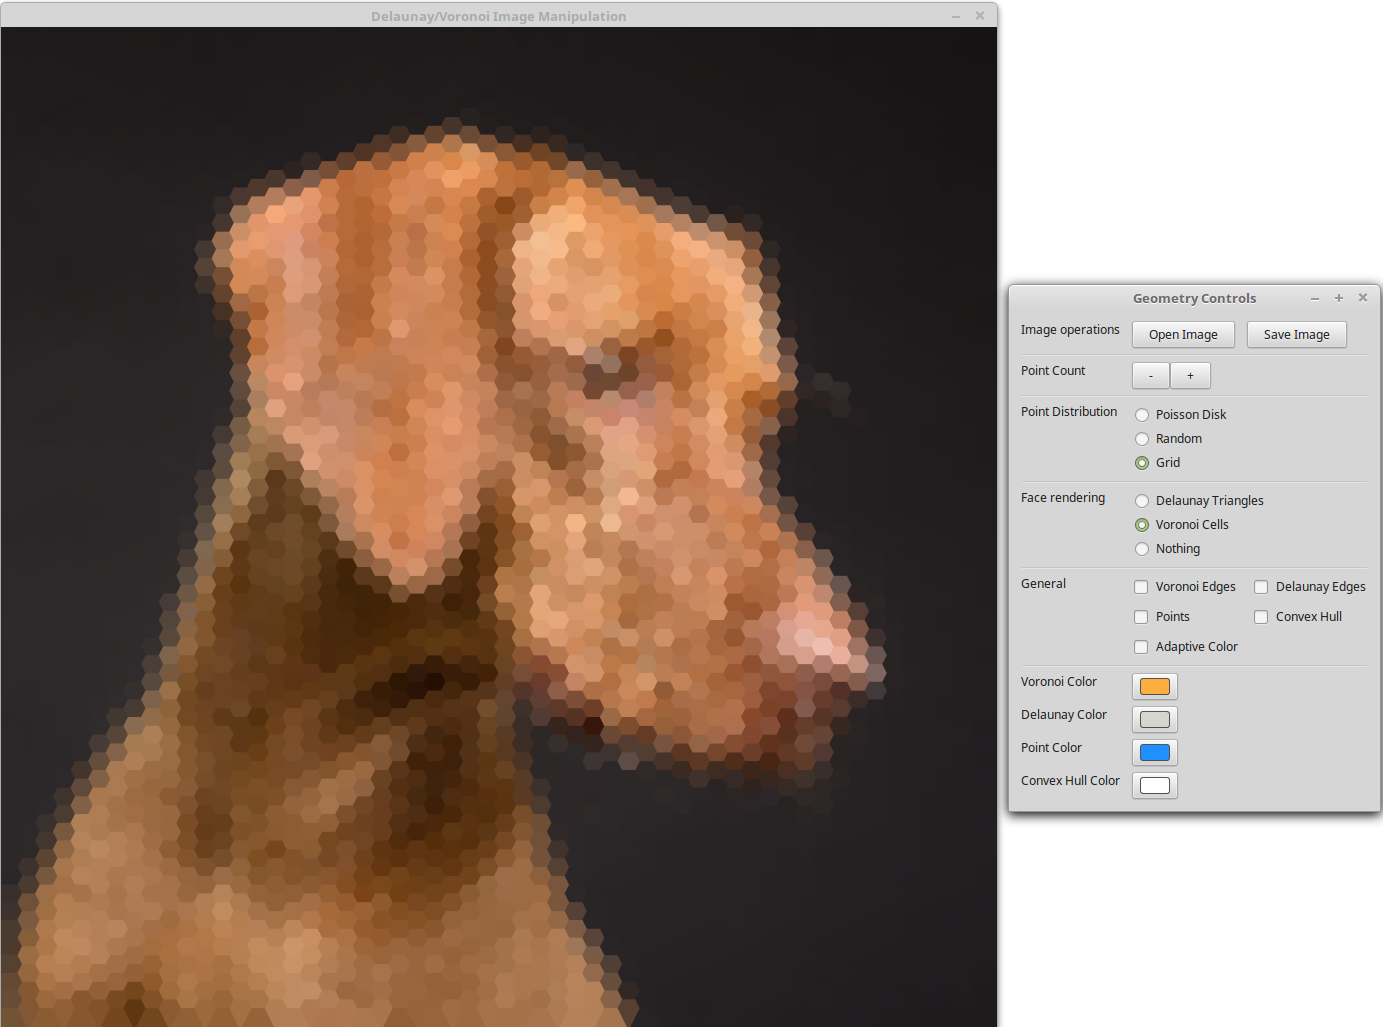
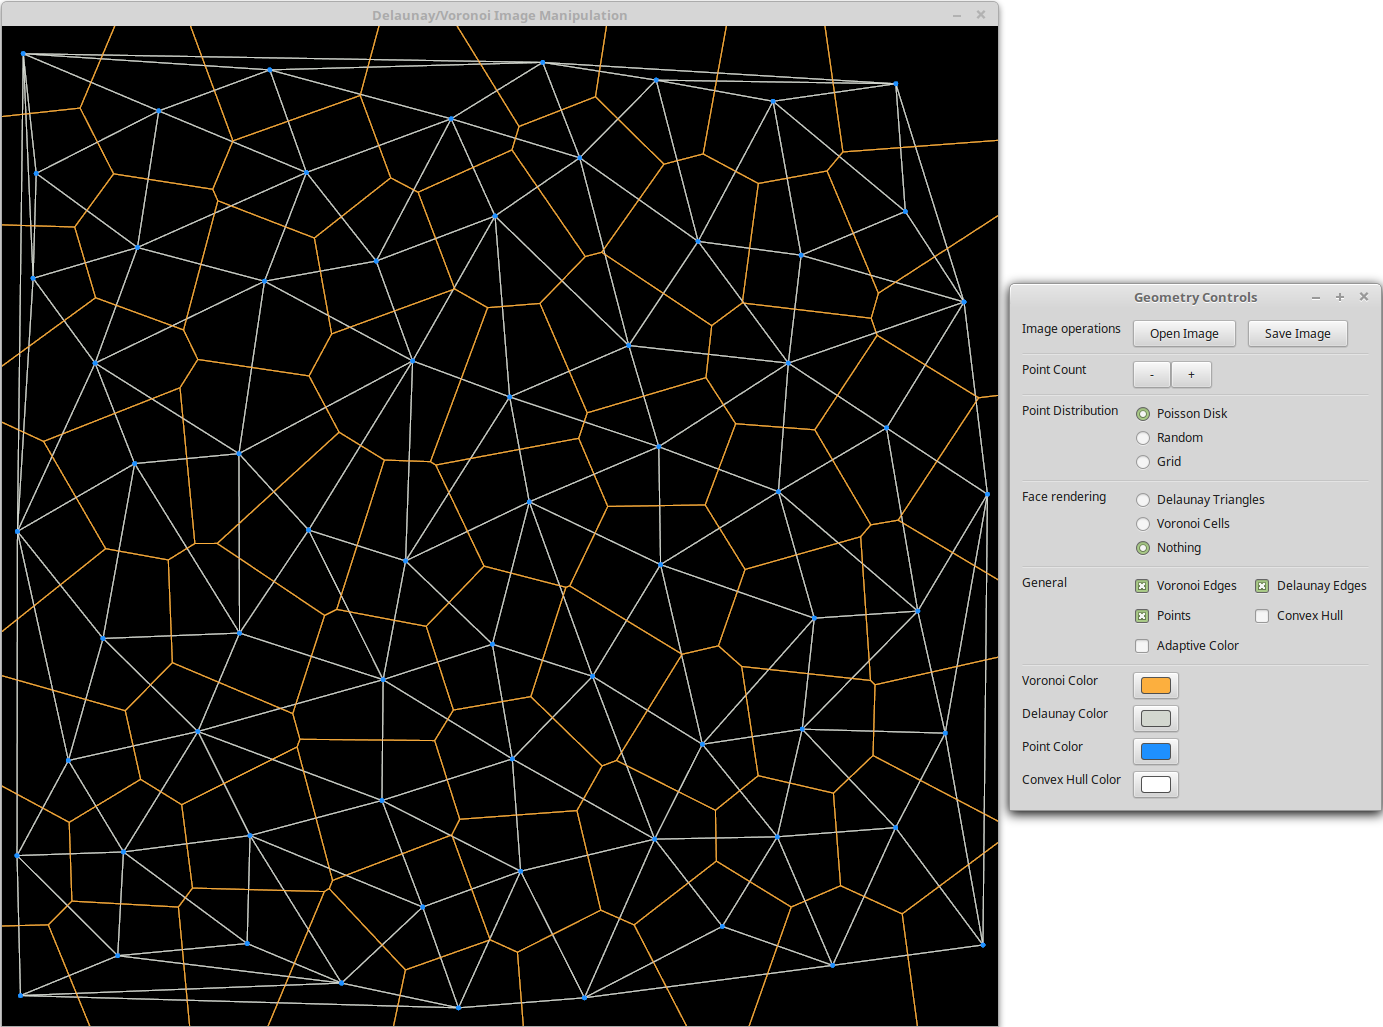
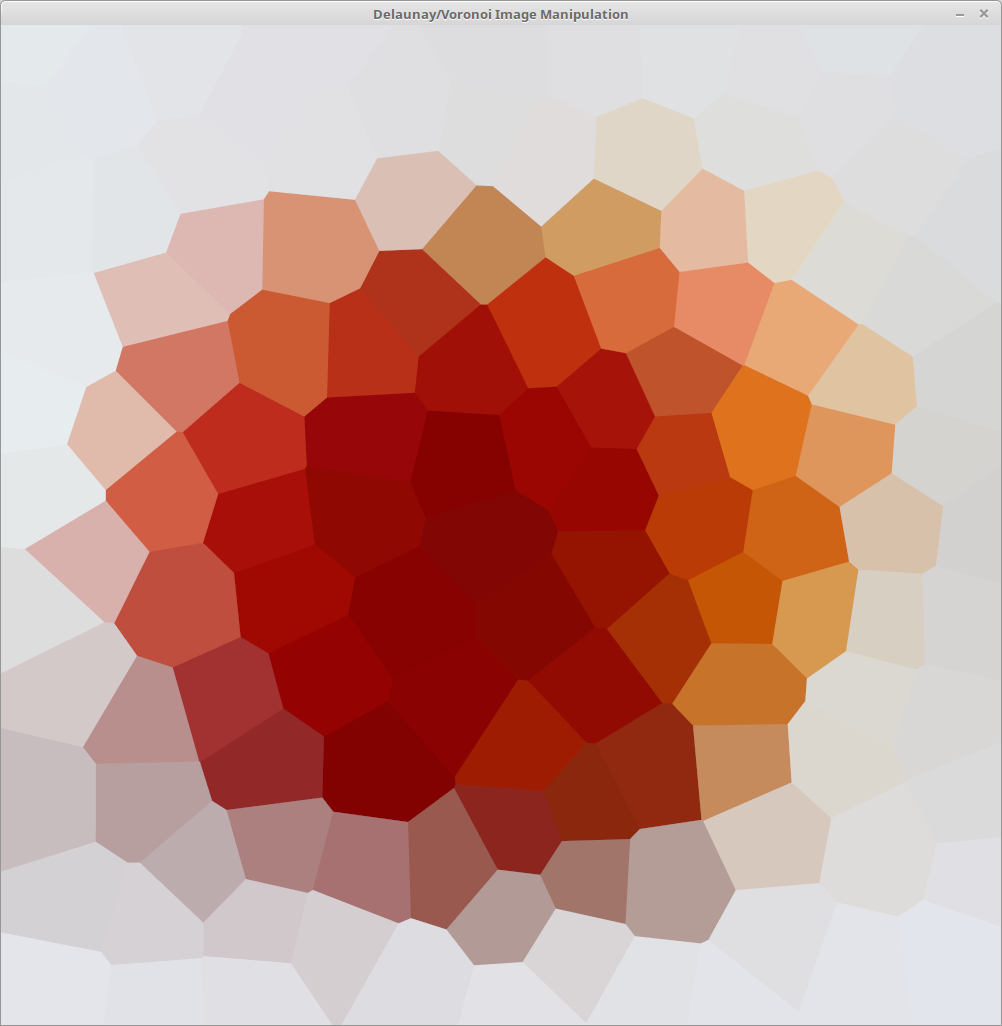
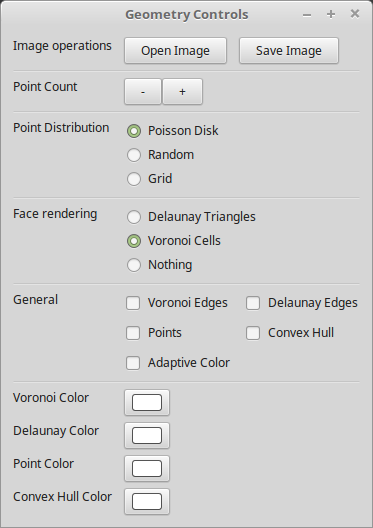
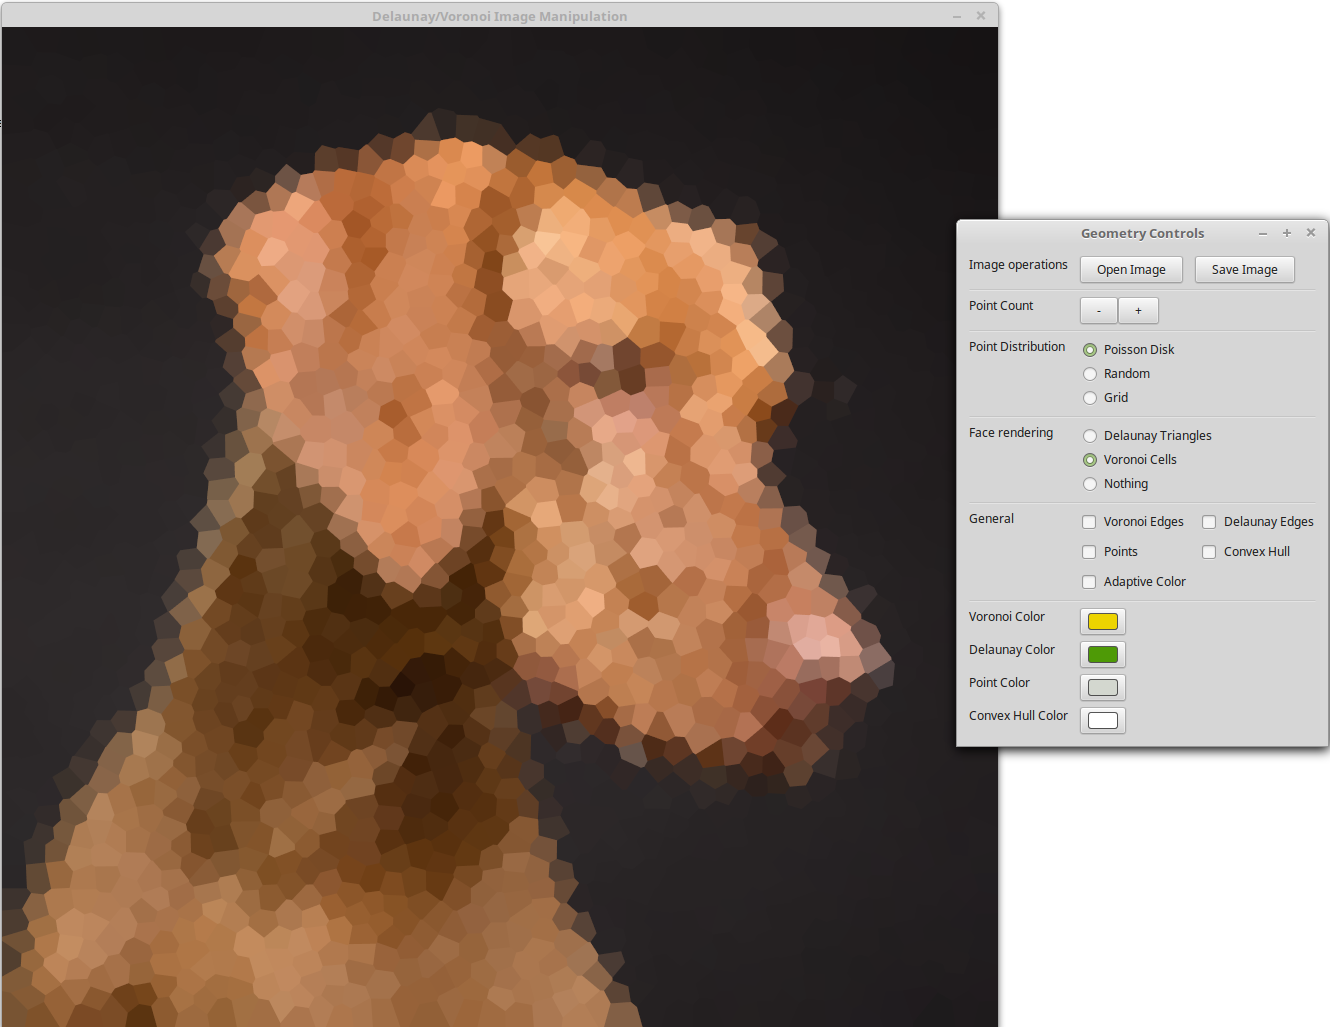
The program will start two separate windows. One to actually display the image and a control window. It will look like the following:
| Image view | Control view |
|---|---|
 |
 |
- Graphics card supporting OpenGL 3.3
- Windows users: Have mingw64 installed. Other C compilers might or might not work. Please report back if it works or submit necessary changes to this README.
- Have Go (Golang) installed on your system.
- Download this repository or run
git clone https://github.com/MauriceGit/Voronoi_Image_Manipulation - Enter the project directory
- Run
go get ./...to install all dependencies - Run
go buildwithin the projects directory - Run the created executable.
- Do not remove the Images/apple.png directory. This image is loaded by default when the program starts.
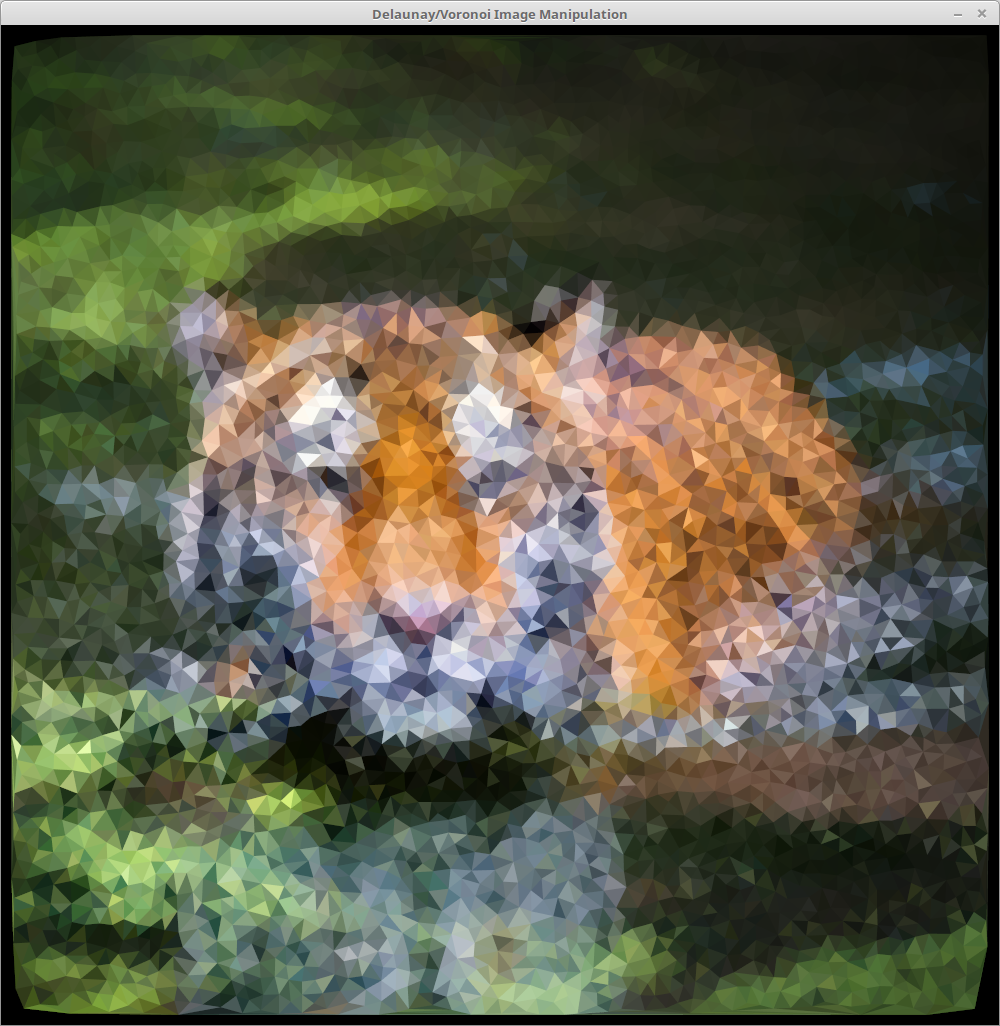
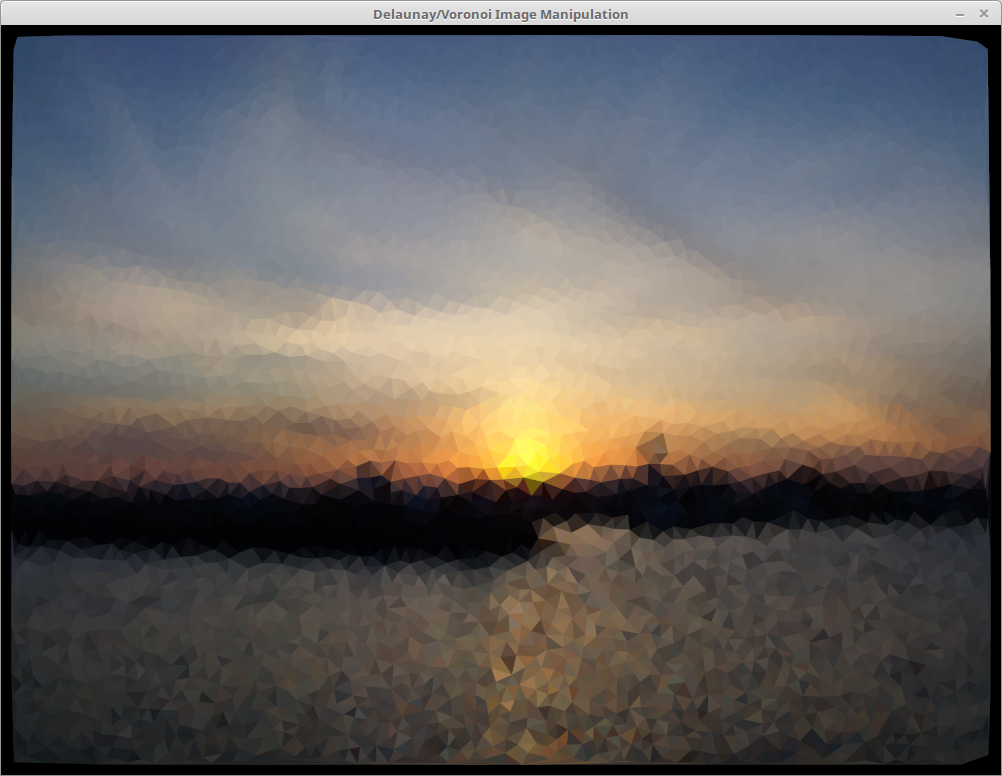
Just to give you and incomplete overview what kind of effects you can achieve with this tool (sometimes with the corresponding controls set).
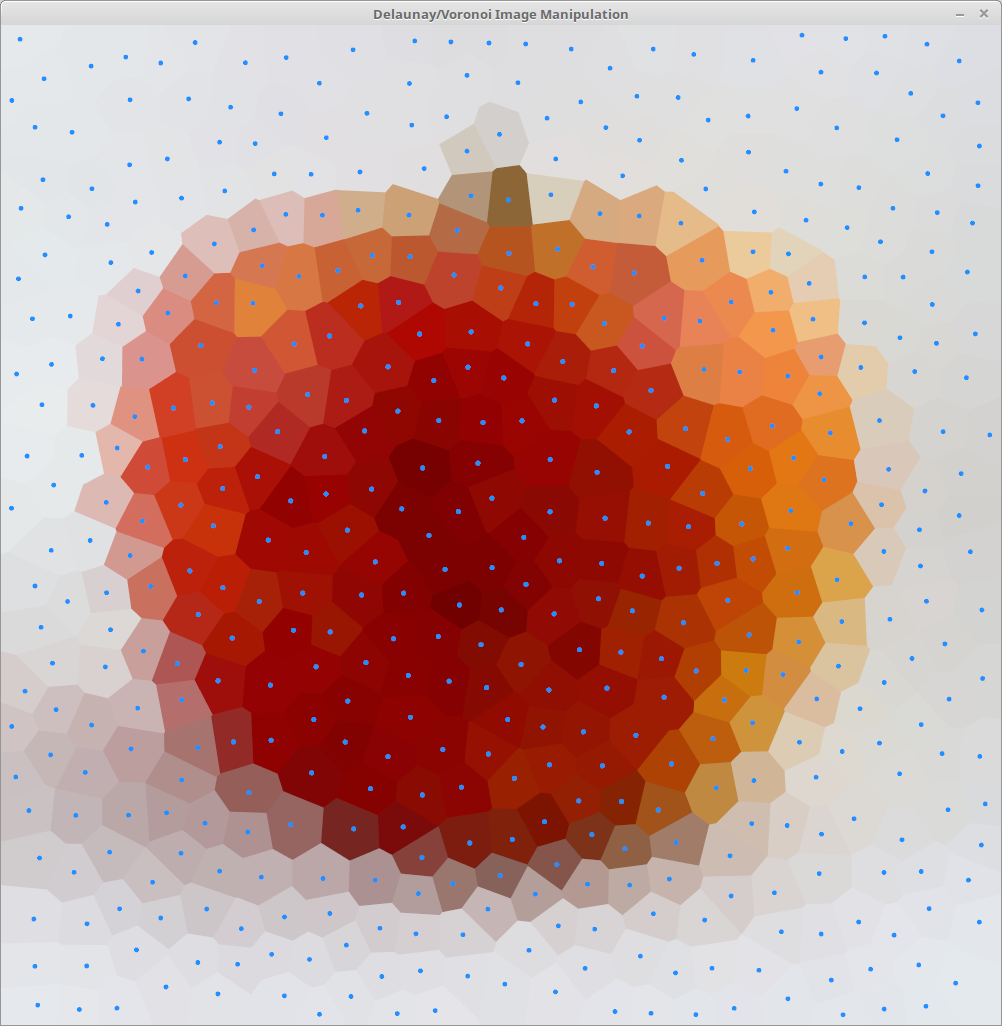
The point Distribution set to Poisson Disk to achieve random but equally distributed points over the whole area. This gives the most pleasing and homogeneous look most of the time.
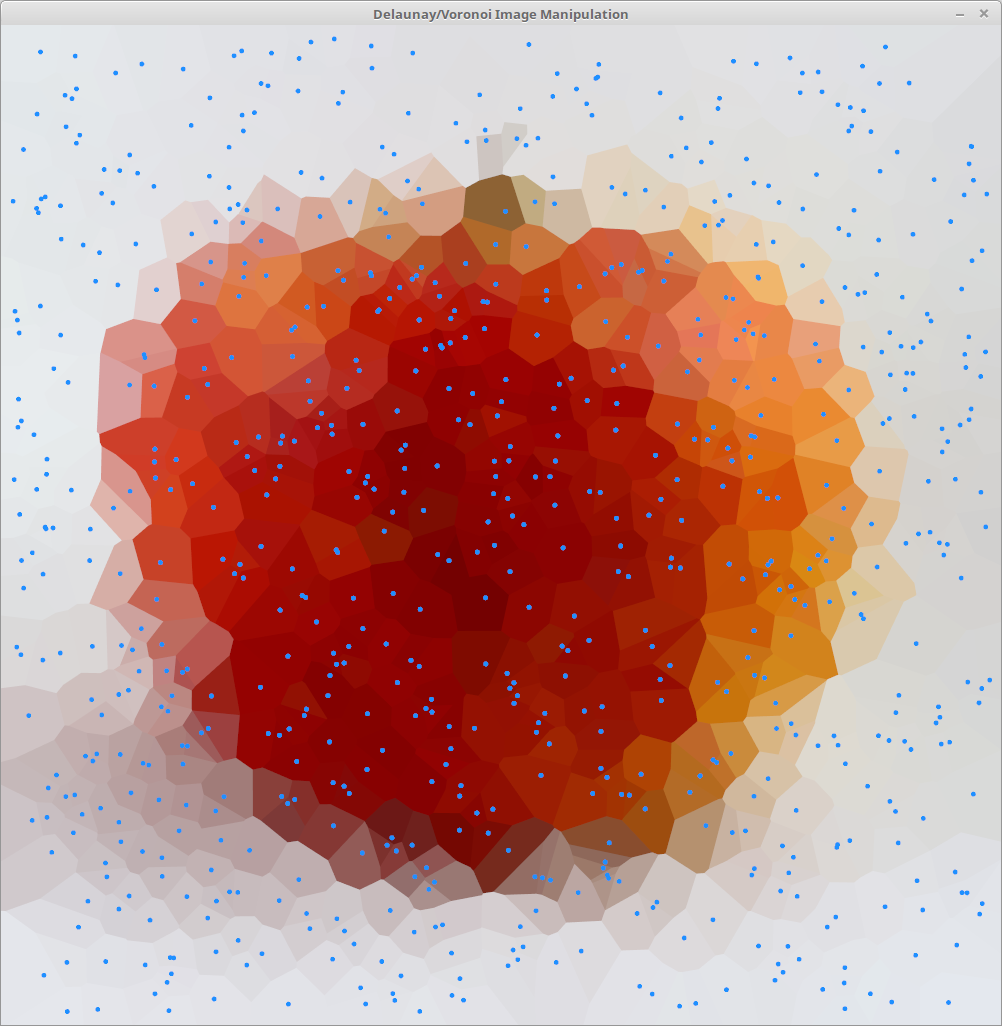
The point Distribution set to Random. Truly random point distribution. Will create unequally sized regions.
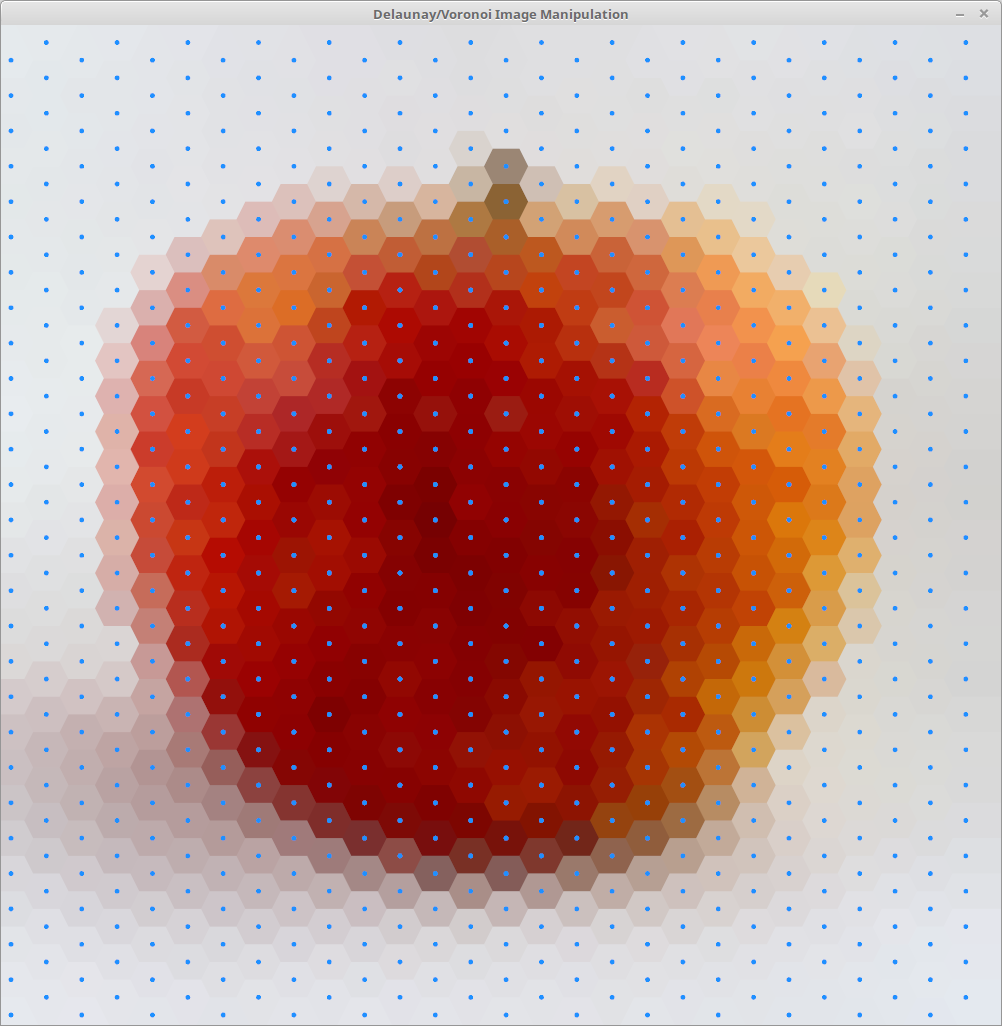
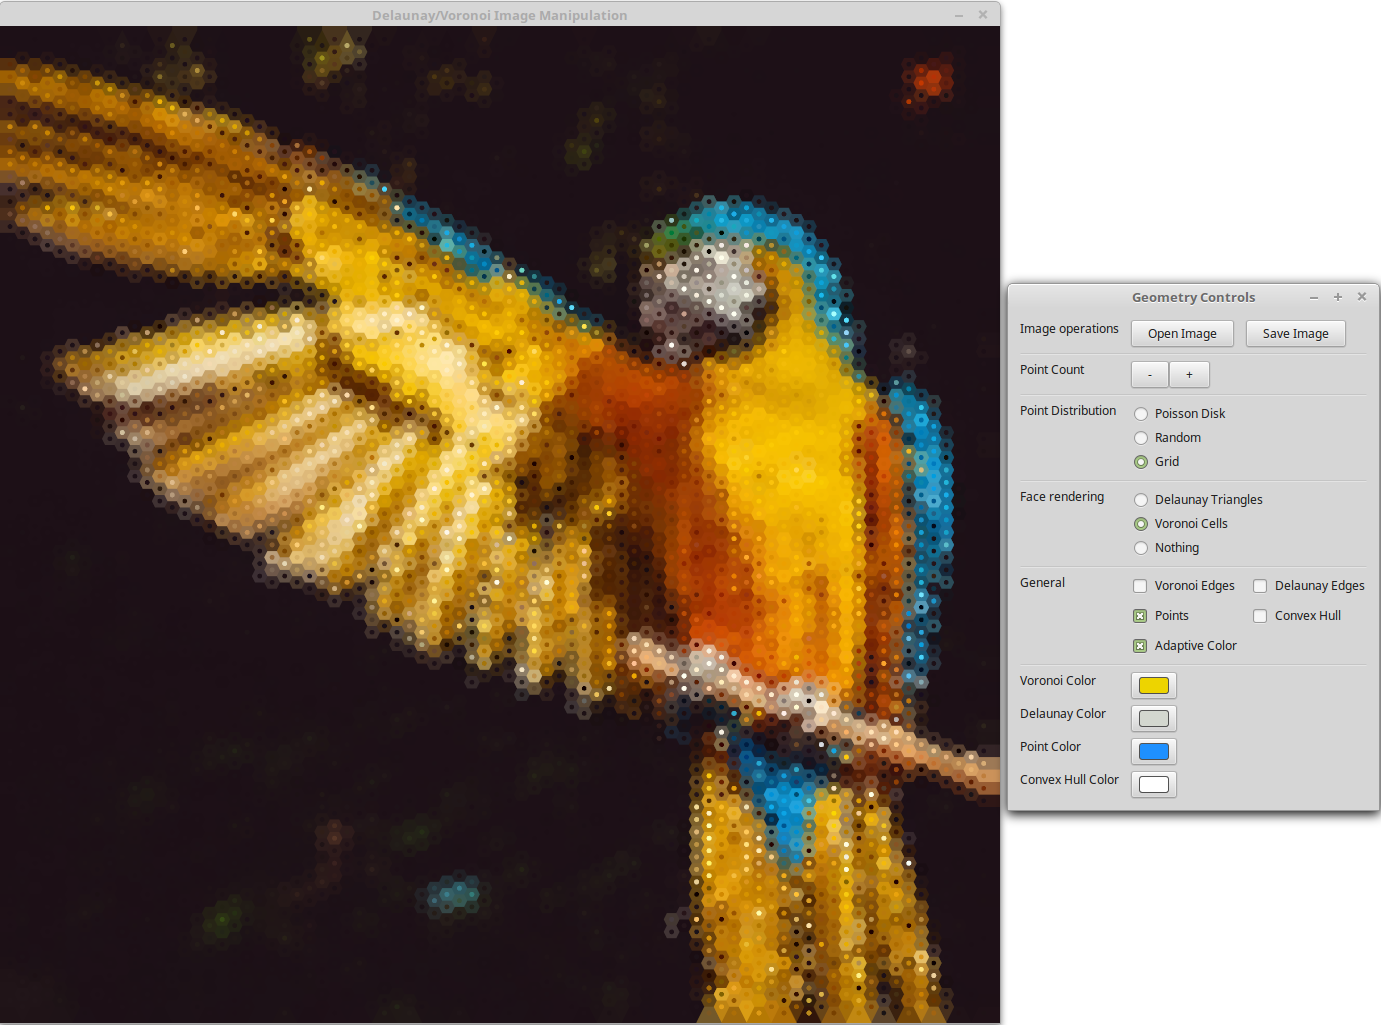
The point Distribution set to Grid will create honeycomb like regions (hexagons) by placing points in a shifted grid.
Set the Face Rendering to Delaunay Triangles.
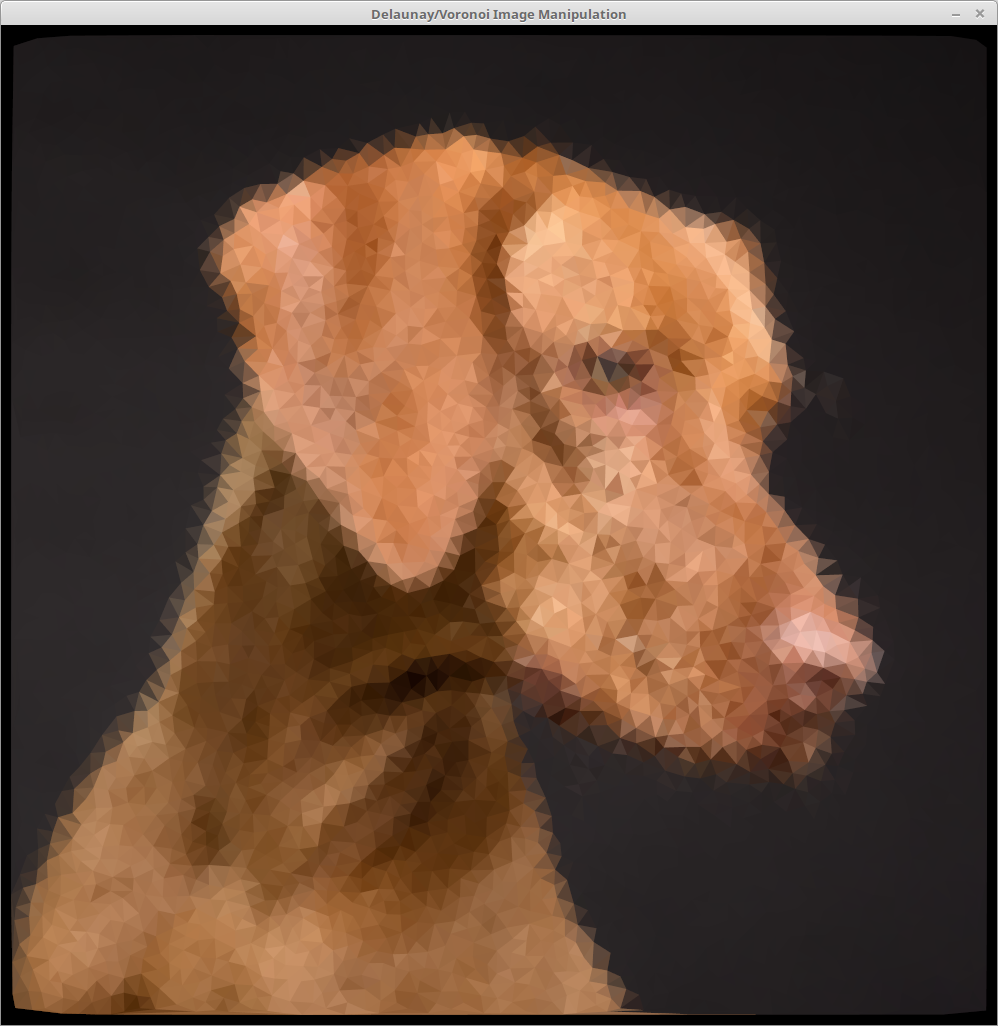
An image of a Labrador with Poisson disk distributed points.
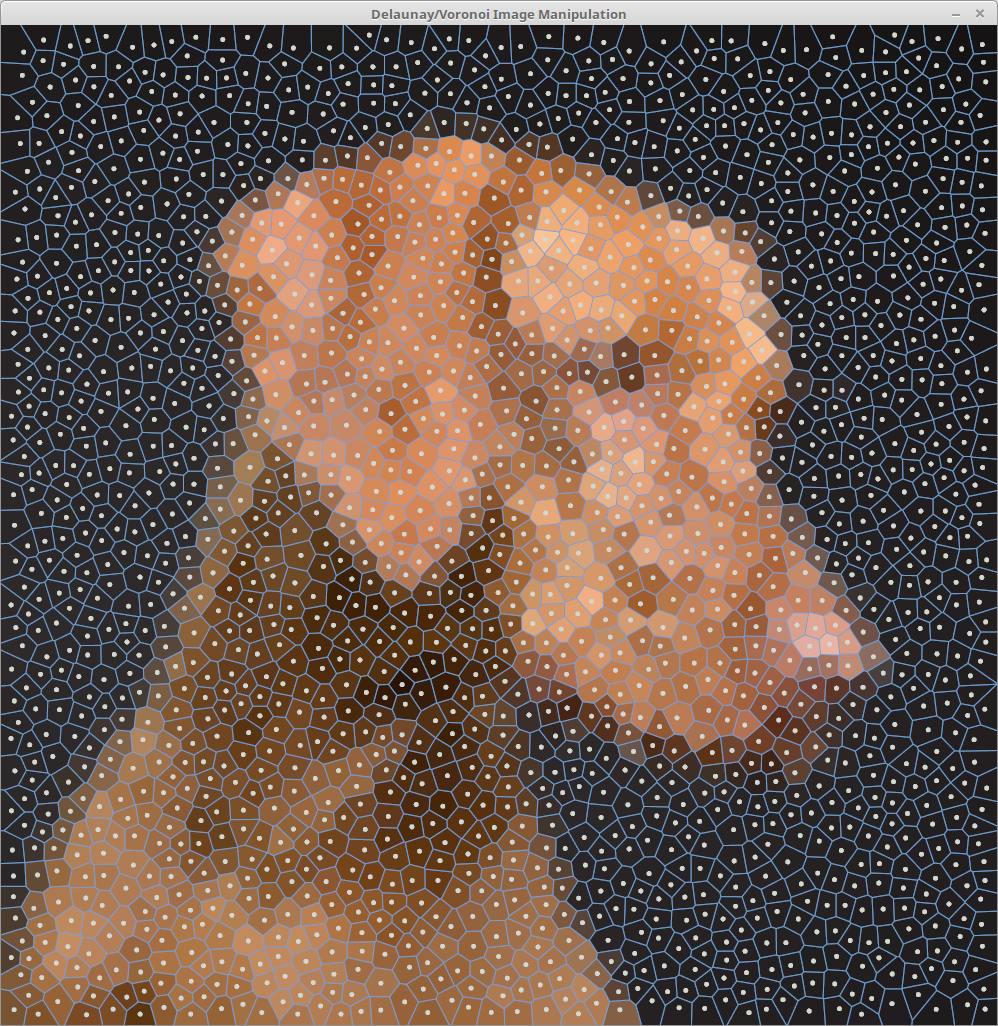
If you like you can add the Voronoi lines and points to actually display the underlaying data structure.
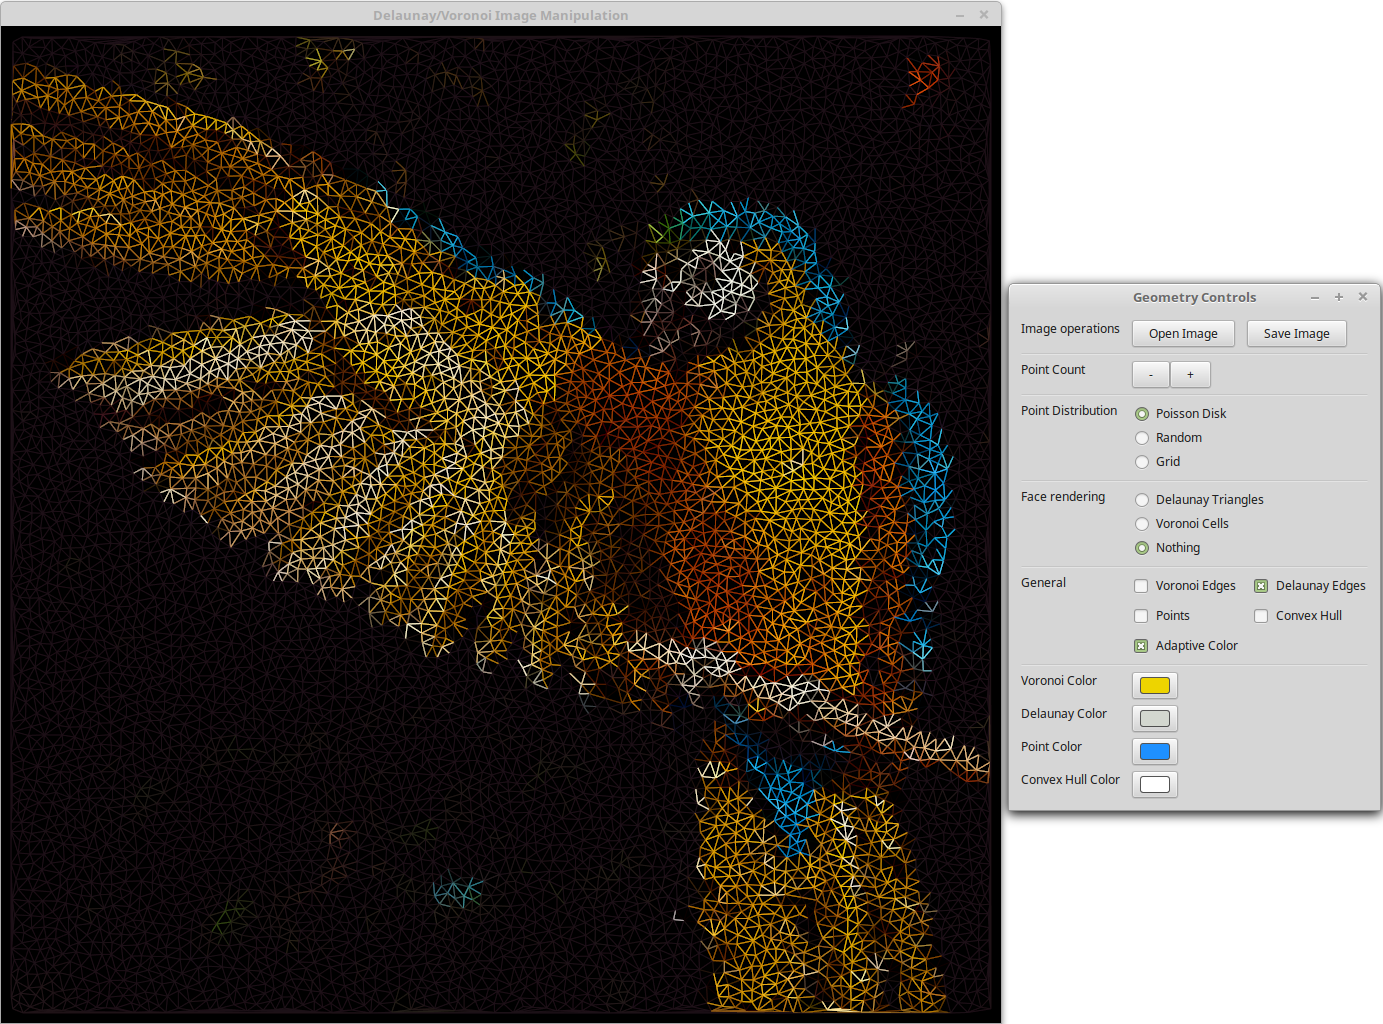
When checking Adaptive Color, the lines of Delaunay edges and points will get the average color of the image underneath. Creating an interesting effect.
Adaptive Color checked with Voronoi faces and points displayed with a grid layout.
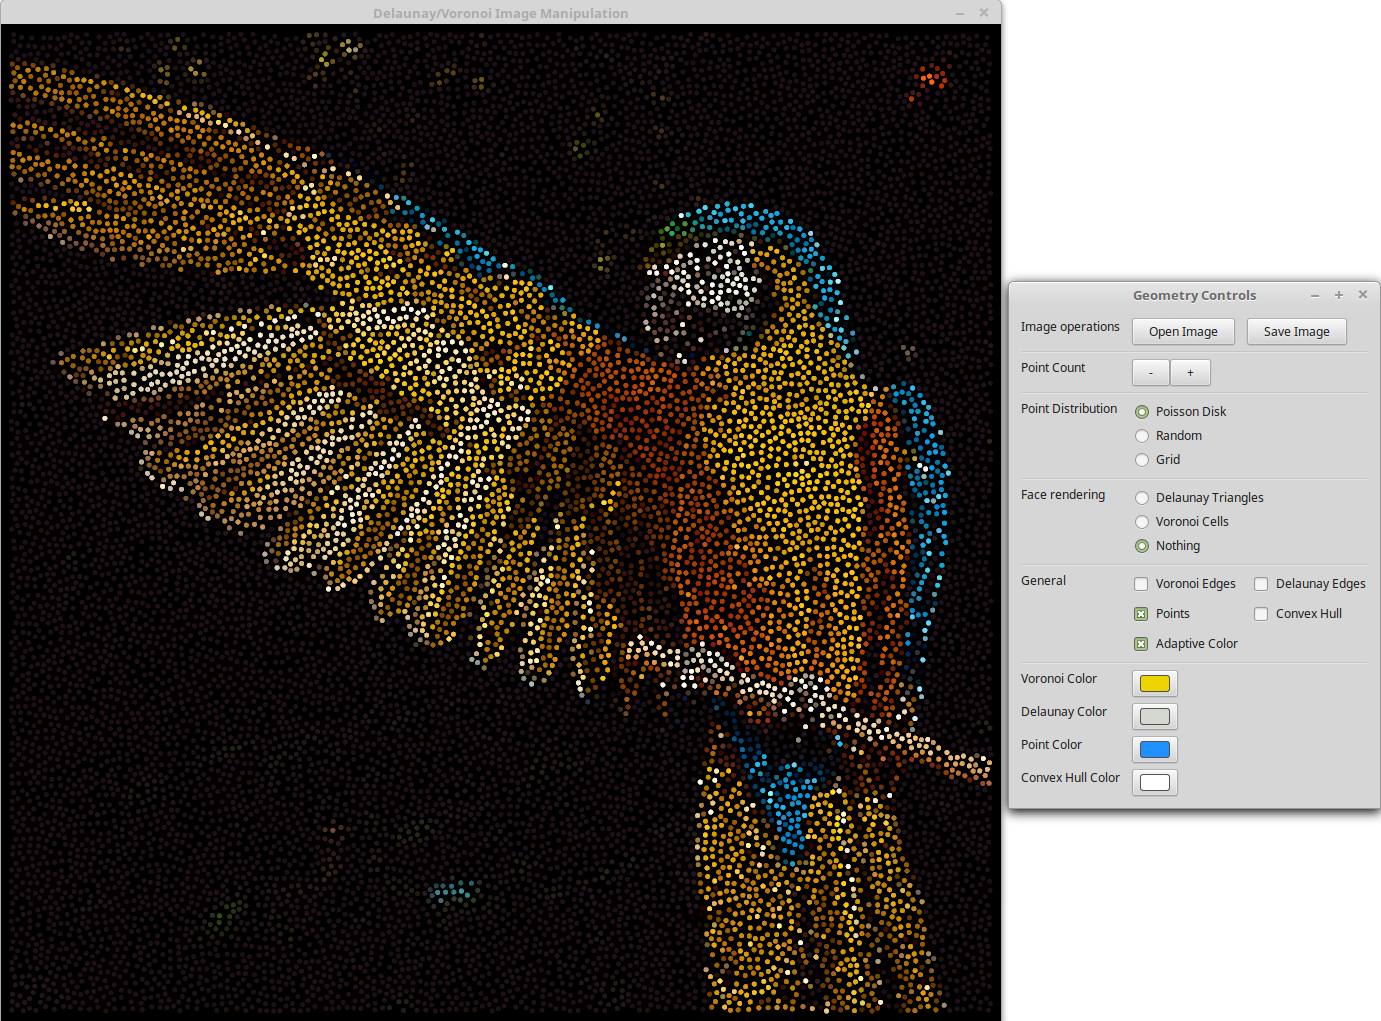
You could just view the points as well (well that doesn't really use Voronoi/Delaunay any more. But still looks cool :)).
At last, you can just ignore the image to investigate/look at voronoi and Delaunay tessellation itself:
