To explore the data provided by Cornell Lab of Ornithology eBird project.
eBird is a "real-time, online checklist program" provided by the Cornell Lab of Ornithology and National Audubon Society. This website offers a platform for individual birdwatchers to submit their birdwatching records. These records are hosts by the website and is open to the public with certain restrictions.
eBird provides prepackaged data files for users on demand. For non-commercial users, it is easy to obtain them by submitting a summary of what you are going to do with the data.
For more about ebird, please visit the following webpage: About eBird.
The complete data package provided by eBird is a clumsy chunk of .gz/.tar files with a daunting size of more than ten Gigabytes (by the time I requested them, i.e., Aug. 2015). Even a glimpse of them proved to be some sort of a struggle. So I wrote these scripts to traverse the content, pick out what is interesting to me and visualize the results.
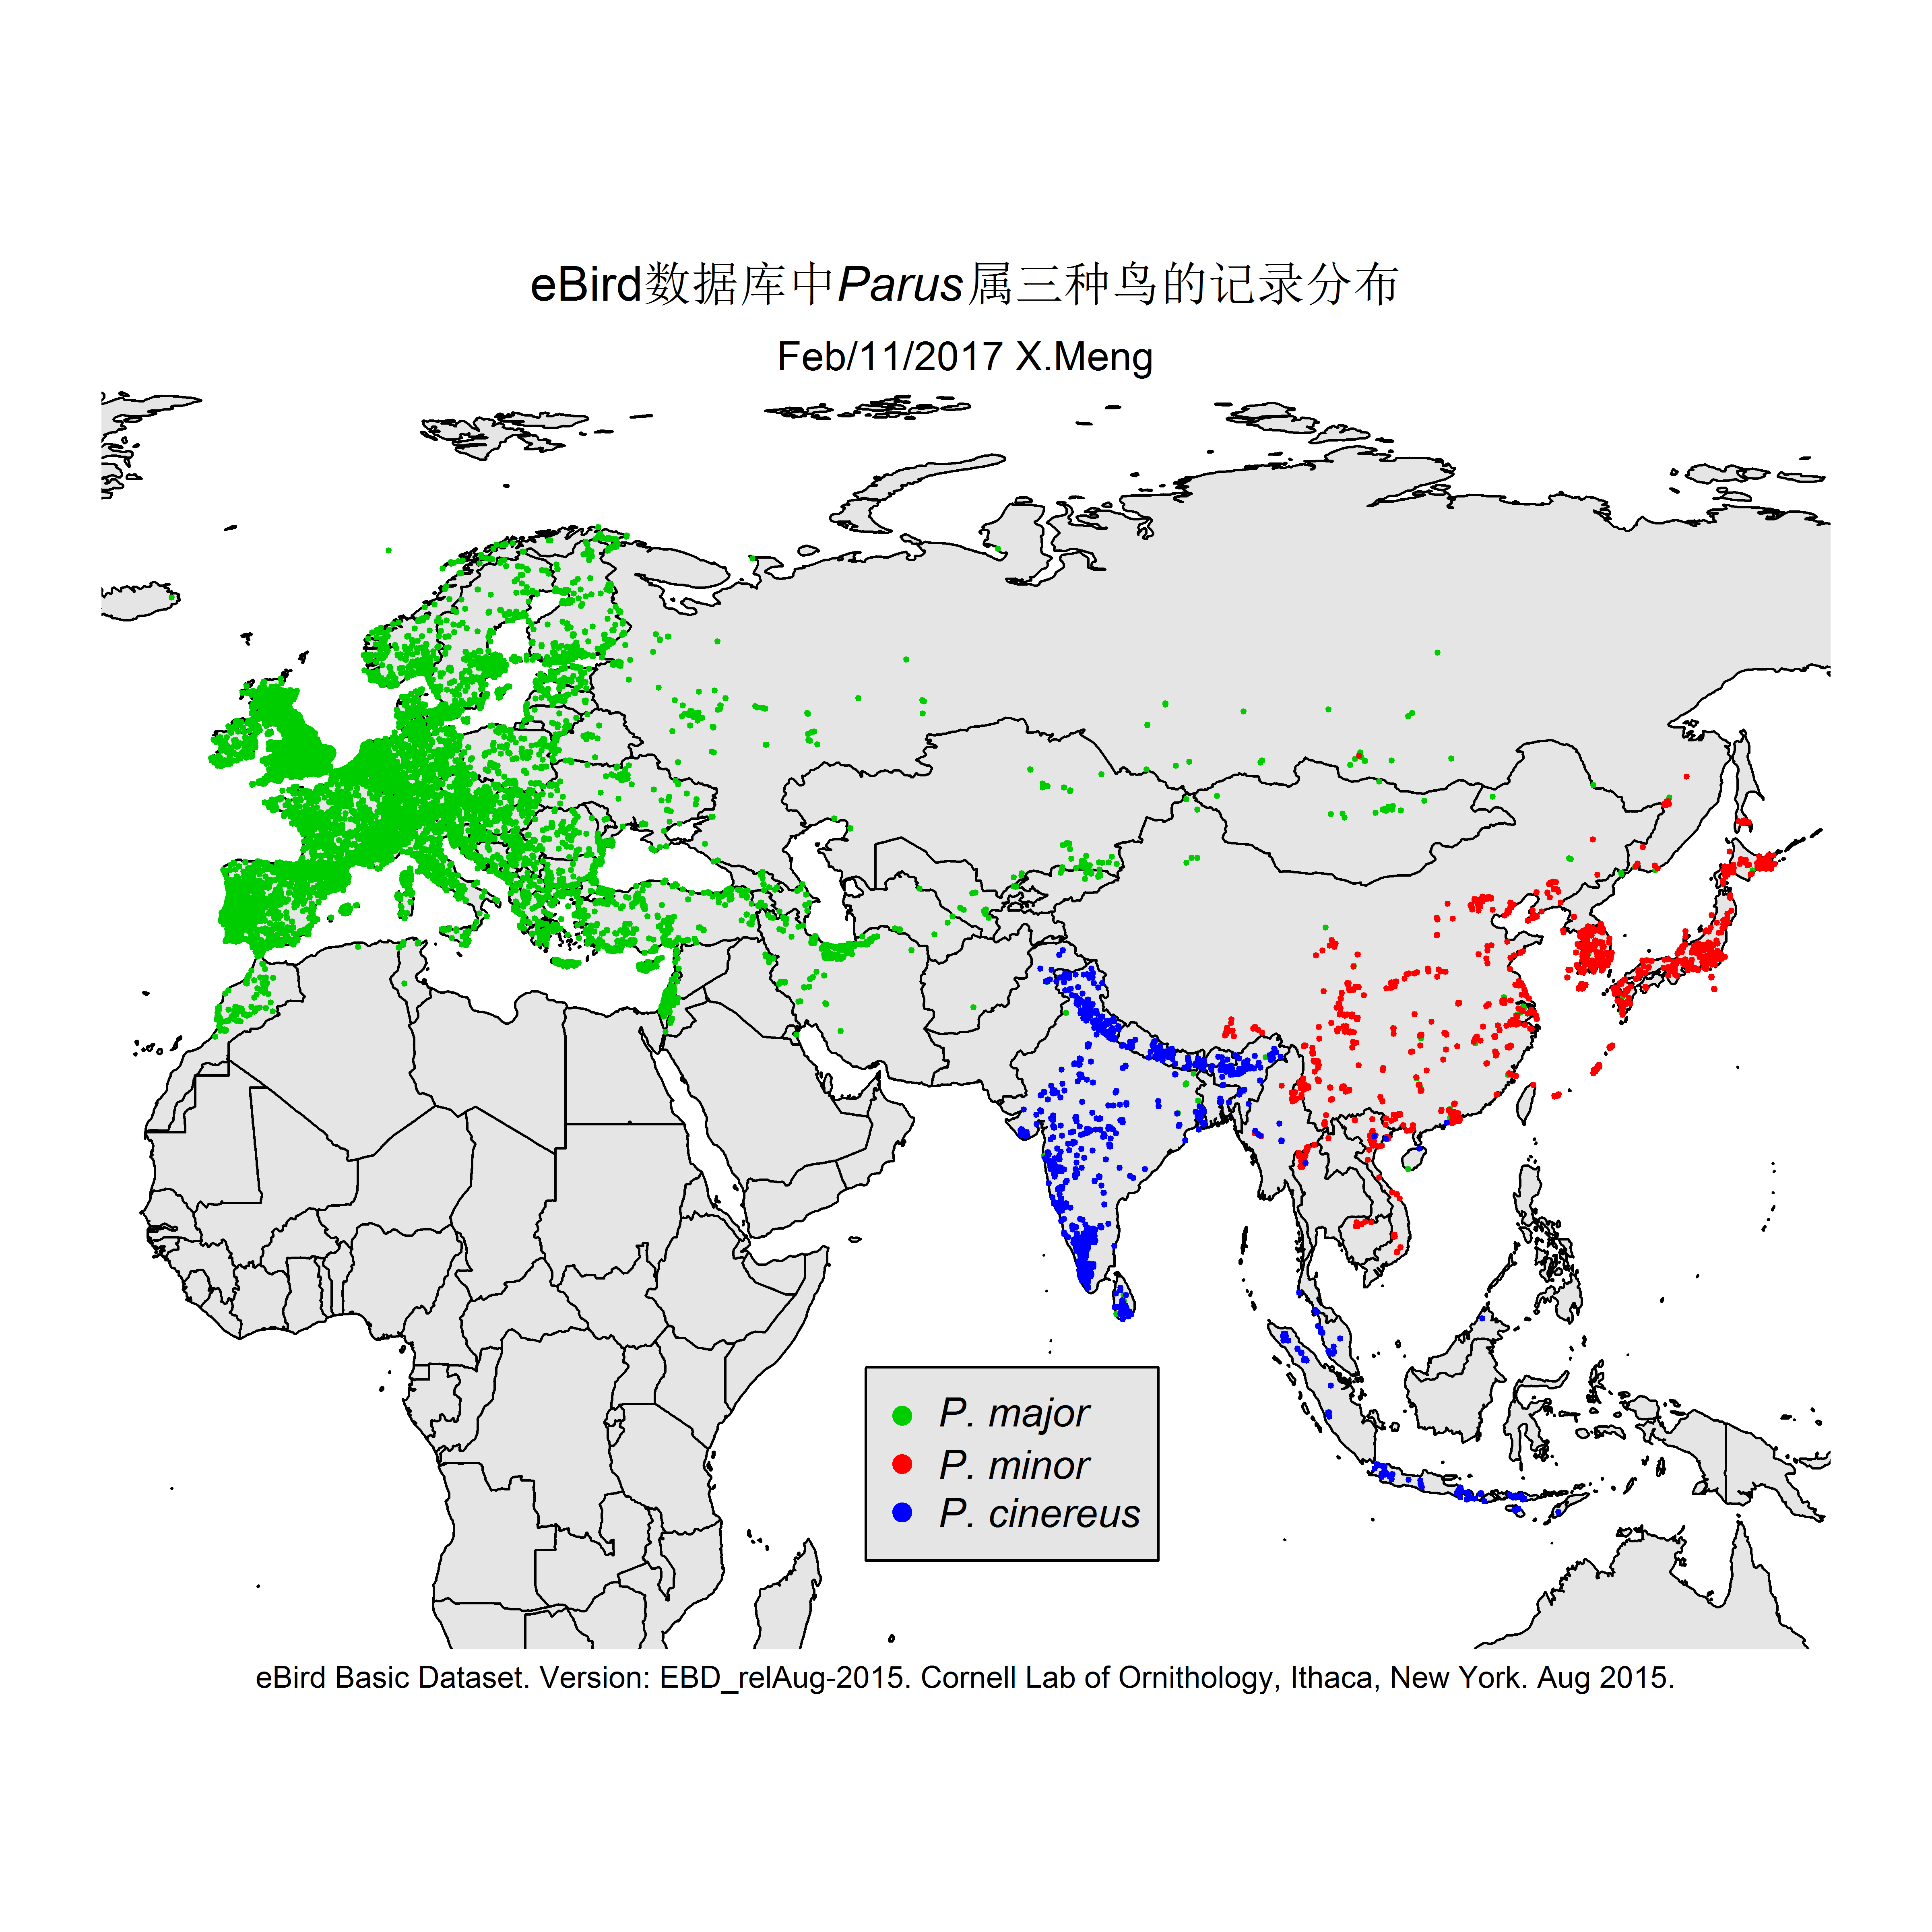
The current version of the scripts demonstrate how I made distribution maps for two groups of species: Parus spp. and Apus apus. This is for an article I prepared for the Species Calendar column of GreenLife, Peking University.
The source, eBird Basic Dataset (EBD) was retrieved from eBrid on Sept. 11, 2015 under eBird's user agreement. First, I used the script peek.py to obtain test data. Then extract.py was executed to single out the record of interest. After this, I used various other python and R scripts to further process the data, and visualize them on maps.
The Python package of gzip, and the R packages of maps, mapdata and scale were used.
Some selected results are like this: