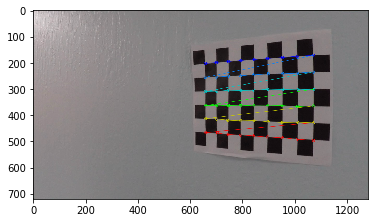
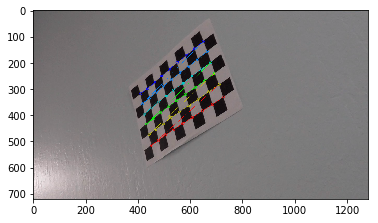
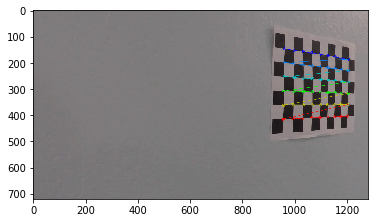
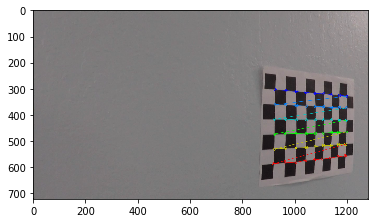
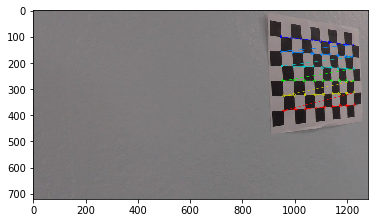
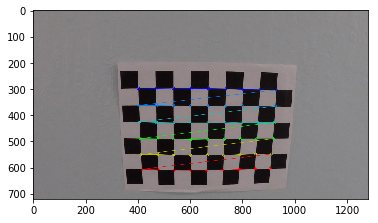
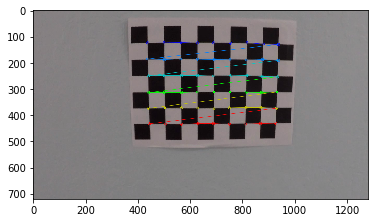
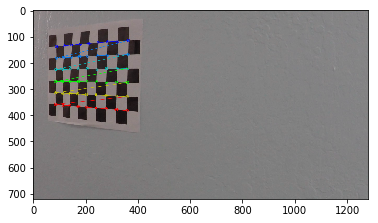
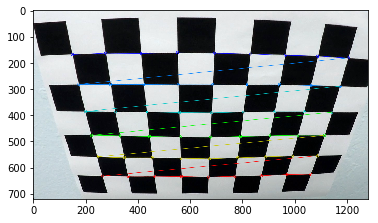
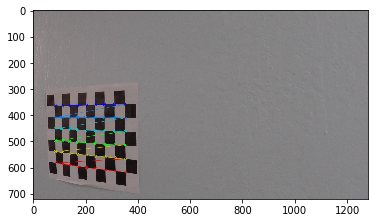
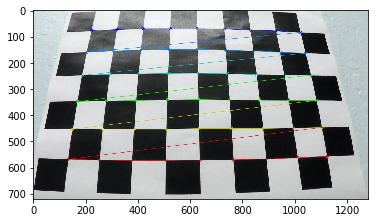
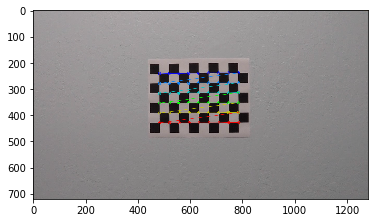
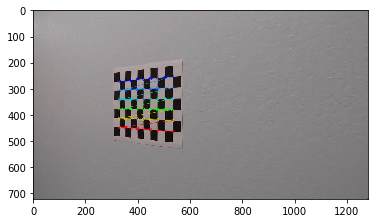
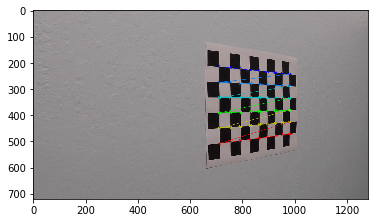
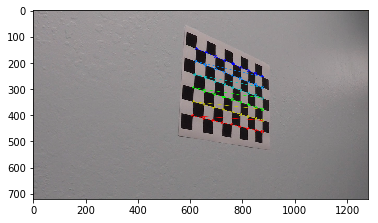
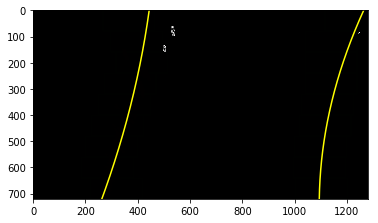
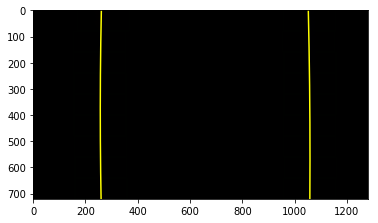
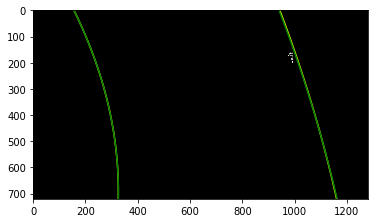
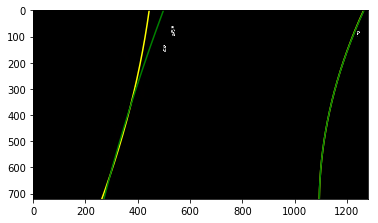
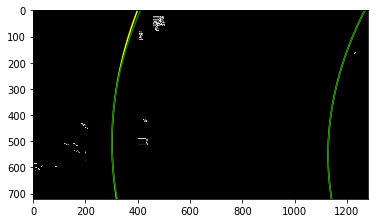
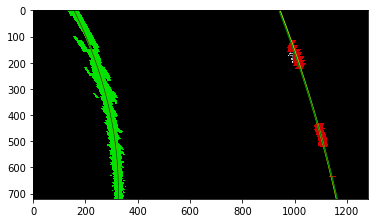
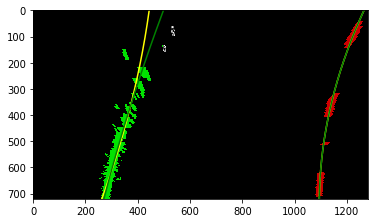
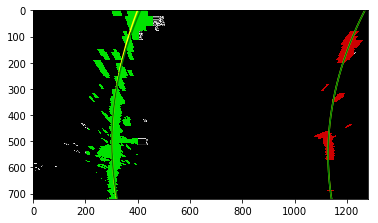
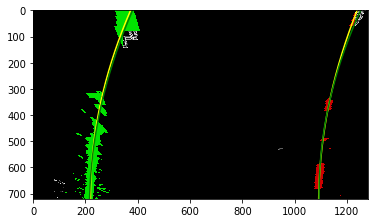
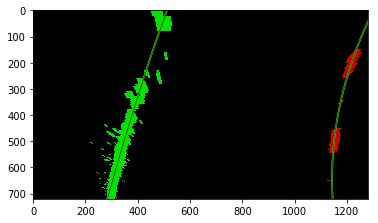
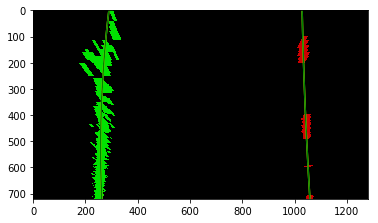
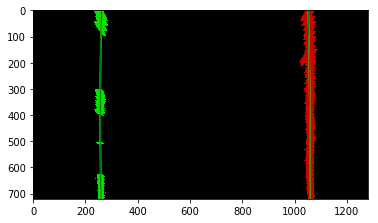
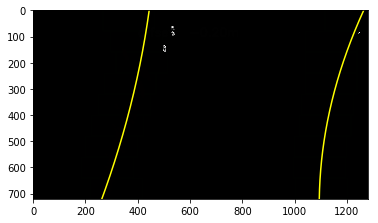
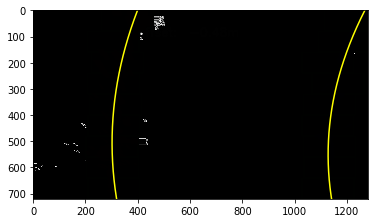
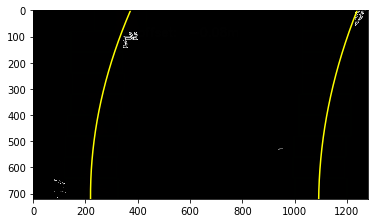
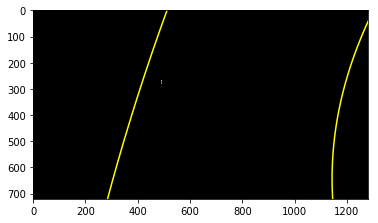
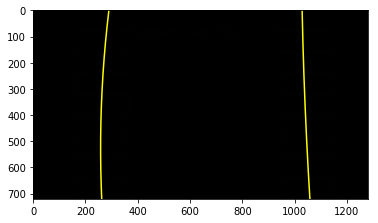
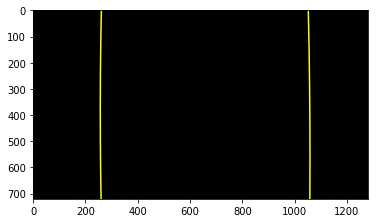
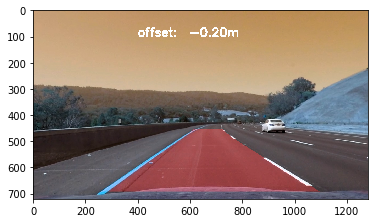
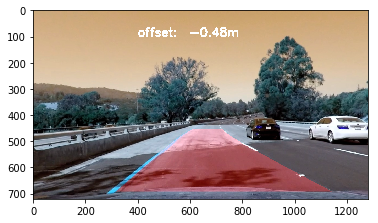
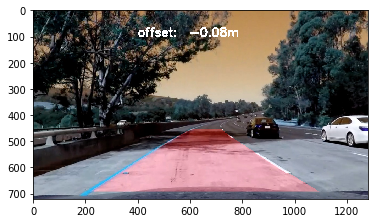
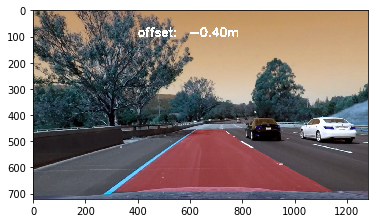
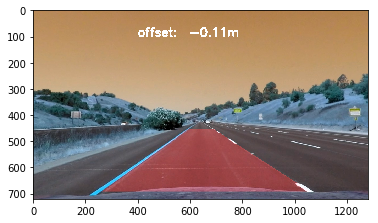
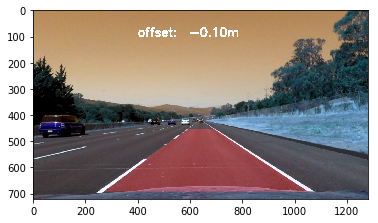
The goals / steps of this project are the following:
- Compute the camera calibration matrix and distortion coefficients given a set of chessboard images.
- Apply a distortion correction to raw images.
- Use color transforms, gradients, etc., to create a thresholded binary image.
- Apply a perspective transform to rectify binary image ("birds-eye view").
- Detect lane pixels and fit to find the lane boundary.
- Determine the curvature of the lane and vehicle position with respect to center.
- Warp the detected lane boundaries back onto the original image.
- Output visual display of the lane boundaries and numerical estimation of lane curvature and vehicle position.
Compute the camera calibration matrix and distortion coefficients given a set of chessboard images.
# prepare libaries
import numpy as np
import cv2
import glob
import matplotlib.pyplot as plt
import matplotlib.image as mpimg
%matplotlib inline
import pickle
# Calibrate camera and save obj and image points to file 'calibration_image_points.p'
#
# Make a list of calibration images
def gete_calibration_image_list( x, y, file_name_patterns ):
# prepare object points, like (0,0,0), (1,0,0), (2,0,0) ....,(6,5,0)
objp = np.zeros((y*x,3), np.float32)
objp[:,:2] = np.mgrid[0:x,0:y].T.reshape(-1,2)
# Arrays to store object points and image points from all the images.
objpoints = [] # 3d points in real world space
imgpoints = [] # 2d points in image plane.
images = glob.glob( file_name_patterns )
# Step through the list and search for chessboard corners
for fname in images:
img = cv2.imread(fname)
gray = cv2.cvtColor(img,cv2.COLOR_BGR2GRAY)
# Find the chessboard corners
ret, corners = cv2.findChessboardCorners(gray, (x,y),None)
# If found, add object points, image points
if ret == True:
objpoints.append(objp)
imgpoints.append(corners)
# Draw and display the corners
img = cv2.drawChessboardCorners(img, (x,y), corners, ret)
plt.figure()
plt.imshow(img)
return objpoints, imgpoints
# create image list
objpoints, imgpoints = gete_calibration_image_list( 9, 6, '../camera_cal/calibration*.jpg' )
# create a dictionary to dump to pickle file
calibration_dic = { 'objpoints': objpoints, 'imgpoints': imgpoints}
# save obj and image list
pickle.dump( calibration_dic, open( "calibration_image_points.p", "wb" ))# Get objpoints and imgpoints from previous saved file
#
dist_pickle = pickle.load( open( "calibration_image_points.p", "rb" ) )
objpoints = dist_pickle["objpoints"]
imgpoints = dist_pickle["imgpoints"]
def undistort_image(img, mtx, dist):
undist = cv2.undistort(img, mtx, dist, None, mtx)
return undist
def calibrate_camera( img, objpoints, imgpoints):
# Use cv2.calibrateCamera() and cv2.undistort()
gray = cv2.cvtColor( img, cv2.COLOR_BGR2GRAY)
ret, mtx, dist, rvecs, tvecs = cv2.calibrateCamera(objpoints, imgpoints, gray.shape[::-1], None, None)
return mtx, dist
def cal_undistort(img, objpoints, imgpoints):
# Use cv2.calibrateCamera() and cv2.undistort()
mtx, dist = calibrate_camera( img, objpoints, imgpoints)
undist = undistort(img, mtx, dist )
return undist#
# undistorted images
#
images = glob.glob( '../test_images/test*.jpg' )
images.extend( glob.glob( '../test_images/straight_lines*.jpg' ))
undistorted_images = []
calibrate_camera_flag = True
for fname in images:
img = cv2.imread(fname)
if calibrate_camera_flag:
calibrate_camera_flag = False
mtx, dist = calibrate_camera(img, objpoints, imgpoints)
#undistorted = cal_undistort(img, objpoints, imgpoints)
undistorted = undistort_image( img, mtx, dist)
undistorted_images.append(undistorted)
f, (ax1, ax2) = plt.subplots(1, 2, figsize=(24, 9))
f.tight_layout()
ax1.imshow(cv2.cvtColor(img, cv2.COLOR_BGR2RGB))
ax1.set_title('Original Image ' + fname.split('\\')[-1], fontsize=50)
ax2.imshow(cv2.cvtColor(undistorted, cv2.COLOR_BGR2RGB))
ax2.set_title('Undistorted Image', fontsize=50)
plt.subplots_adjust(left=0., right=1, top=0.9, bottom=0.)def thresh_binary_yellow_and_white(img, is_RGB=True,yellow_thresh=((18, 37), (20,255), (20, 255)), white_l_thresh=(200, 255), sx_thresh=(10, 25)):
img = np.copy(img)
# Convert to HLS color space and separate the V channel
if not is_RGB:
hls = cv2.cvtColor(img, cv2.COLOR_BGR2HLS).astype(np.float)
else:
hls = cv2.cvtColor(img, cv2.COLOR_RGB2HLS).astype(np.float)
h_channel = hls[:,:,0]
l_channel = hls[:,:,1]
s_channel = hls[:,:,2]
sobelx = cv2.Sobel(l_channel, cv2.CV_64F, 1, 0) # Take the derivative in x
abs_sobelx = np.absolute(sobelx) # Absolute x derivative to accentuate lines away from horizontal
scaled_sobel = np.uint8(255*abs_sobelx/np.max(abs_sobelx))
sxbinary = np.zeros_like(scaled_sobel)
sxbinary[(scaled_sobel >= sx_thresh[0]) & (scaled_sobel <= sx_thresh[1])] = 1
# Threshold color channel
yellow_binary = np.zeros_like(s_channel)
yellow_binary[(h_channel > yellow_thresh[0][0]) & (h_channel <= yellow_thresh[0][1]) &
(l_channel > yellow_thresh[1][0]) & (l_channel <= yellow_thresh[1][1]) &
(s_channel > yellow_thresh[2][0]) & (s_channel <= yellow_thresh[2][1])] = 1
white_binary = np.zeros_like(s_channel)
white_binary[(l_channel > white_l_thresh[0]) & (l_channel <= white_l_thresh[1])] = 1
combined = np.zeros_like(s_channel)
combined[ (yellow_binary == 1) | ((white_binary == 1) )] = 1
return combined
def thresh_binary(img, s_thresh=(30, 255), sx_thresh=(30, 255)):
img = np.copy(img)
# Convert to HLS color space and separate the V channel
hls = cv2.cvtColor(img, cv2.COLOR_RGB2HLS).astype(np.float)
h_channel = hls[:,:,0]
l_channel = hls[:,:,1]
s_channel = hls[:,:,2]
# Sobel x
sobelx = cv2.Sobel(s_channel, cv2.CV_64F, 1, 0) # Take the derivative in x
abs_sobelx = np.absolute(sobelx) # Absolute x derivative to accentuate lines away from horizontal
scaled_sobel = np.uint8(255*abs_sobelx/np.max(abs_sobelx))
# Threshold x gradient
sxbinary = np.zeros_like(scaled_sobel)
sxbinary[(scaled_sobel >= sx_thresh[0]) & (scaled_sobel <= sx_thresh[1])] = 1
# Threshold color channel
s_binary = np.zeros_like(s_channel)
s_binary[(s_channel > s_thresh[0]) & (s_channel <= s_thresh[1])] = 1
combined = np.zeros_like(sxbinary)
combined[ (sxbinary == 1)] = 1
return combined
# Run the function
for image in undistorted_images:
# Apply each of the thresholding functions
#combined = thresh_binary(image)
combined = thresh_binary_yellow_and_white(image, is_RGB=False)
# Plot the result
f, (ax1, ax2) = plt.subplots(1, 2, figsize=(24, 9))
f.tight_layout()
ax1.imshow(image)
ax1.set_title('Original Image', fontsize=20)
ax2.imshow(combined, cmap='gray')
ax2.set_title('Thresholded Combined', fontsize=20)
plt.subplots_adjust(left=0., right=1, top=0.9, bottom=0.)
plt.show()
Use the straight line images for reference
# save the undistorted straight line images and define the source and destinetion cooridinate
#cv2.imwrite("undistorted_straightline1.png", undistorted_images[6] )
cv2.imwrite("undistorted_straightline2.png", undistorted_images[7] )
True
# print(undistorted_images[6].shape)
#
# manually determine the warp coordinates from the undistorted straight line image
#
src = np.float32([
    [588, 455],
    [697, 455],
    [1055, 690],
    [ 261, 690]])

dst = np.float32([
  [261,  0],
  [1055, 0],
  [1055, 719],
  [261,  719]])

#dst = np.float32([
#    [261,  100],
#    [1055, 100],
#    [1055, 690],
#    [261,  690]])

M_Perspective = cv2.getPerspectiveTransform(src, dst)

warped_binary_images = []
for undist in undistorted_images:  # straight line images
    undist = thresh_binary_yellow_and_white( undist, is_RGB=False )
    img_size = (undist.shape[1], undist.shape[0])
    warped = cv2.warpPerspective(undist, M_Perspective, img_size, flags=cv2.INTER_LINEAR)
    warped_binary_images.append( warped)
    # Plot the result
    f, (ax1, ax2) = plt.subplots(1, 2, figsize=(24, 9))
    f.tight_layout()
    ax1.imshow(undist, cmap='gray')
    ax1.set_title('Original Image', fontsize=20)
    ax2.imshow(warped, cmap='gray')
    ax2.set_title('Warped', fontsize=20)
    plt.subplots_adjust(left=0., right=1, top=0.9, bottom=0.)
plt.show()- Use histogram to find base locations of lane lines.
- Use slide windows from the base location upward to find the connected line.
# margin - the width of the windows +/- margin
# minpix - minimum number of pixels found to recenter window
#
def slide_window_search( binary_warped, nwindows = 9, margin = 100, minpix = 50, visualize_flag = True):
    histogram = np.sum(binary_warped[binary_warped.shape[0]/2:,:], axis=0)
    # Create an output image to draw on and  visualize the result
    if visualize_flag:
        out_img = np.dstack((binary_warped, binary_warped, binary_warped))*255
    # Find the peak of the left and right halves of the histogram
    # These will be the starting point for the left and right lines
    midpoint = np.int(histogram.shape[0]/2)
    leftx_base = np.argmax(histogram[:midpoint])
    rightx_base = np.argmax(histogram[midpoint:]) + midpoint

    # Set height of windows
    window_height = np.int(binary_warped.shape[0]/nwindows)
    # Identify the x and y positions of all nonzero pixels in the image
    nonzero = binary_warped.nonzero()
    nonzeroy = np.array(nonzero[0])
    nonzerox = np.array(nonzero[1])
    # Current positions to be updated for each window
    leftx_current = leftx_base
    rightx_current = rightx_base
    # Create empty lists to receive left and right lane pixel indices
    left_lane_inds = []
    right_lane_inds = []
    ## for left and right
    for x_current, lane_inds, dot_color in zip(
        [leftx_current, rightx_current], [left_lane_inds, right_lane_inds], [(0,255,0), ((0,255,0))]):
        # Step through the windows one by one
        for window in range(nwindows):
            # Identify window boundaries in x and y (and right and left)
            win_y_low = binary_warped.shape[0] - (window+1)*window_height
            win_y_high = binary_warped.shape[0] - window*window_height

            win_x_low = x_current - margin
            win_x_high = x_current + margin

            # Draw the windows on the visualization image
            if visualize_flag:
                cv2.rectangle(out_img,(win_x_low+1,win_y_low+1),(win_x_high-1,win_y_high),dot_color, thickness=4)

            # Identify the nonzero pixels in x and y within the window
            good_inds = ((nonzeroy >= win_y_low) & (nonzeroy < win_y_high) &
                              (nonzerox >= win_x_low) & (nonzerox < win_x_high)).nonzero()[0]
            # Append these indices to the lists
            lane_inds.append(good_inds)
            # If you found > minpix pixels, recenter next window on their mean position
            if len(good_inds) > minpix:
                x_current = np.int(np.mean(nonzerox[good_inds]))

    # Concatenate the arrays of indices
    left_lane_inds = np.concatenate(left_lane_inds)
    right_lane_inds = np.concatenate(right_lane_inds)
    leftx = nonzerox[left_lane_inds]
    lefty = nonzeroy[left_lane_inds]
    rightx = nonzerox[right_lane_inds]
    righty = nonzeroy[right_lane_inds]
    # fit polynomial
    left_fit = np.polyfit(lefty, leftx, 2)
    right_fit = np.polyfit(righty, rightx, 2)

    if visualize_flag:
        # draw found points
        out_img[nonzeroy[left_lane_inds], nonzerox[left_lane_inds]] = [255, 0, 0]
        out_img[nonzeroy[right_lane_inds], nonzerox[right_lane_inds]] = [0, 0, 255]
        return left_fit, right_fit, out_img
    else:
return left_fit, right_fitOnce the lines are found, in next frame only need to find new lines in the nearby windows of the fit lines.
def nearby_search_from_nonzero(nonzerox, nonzeroy, prev_fit, margin):
    lane_inds = ((nonzerox > (prev_fit[0]*(nonzeroy**2) + prev_fit[1]*nonzeroy + prev_fit[2] - margin)) &
                      (nonzerox < (prev_fit[0]*(nonzeroy**2) + prev_fit[1]*nonzeroy + prev_fit[2] + margin)))

    # Extract left and right line pixel positions
    foundx = nonzerox[lane_inds]
    foundy = nonzeroy[lane_inds]
    ## Fit a second order polynomial to each
    found_fit = np.polyfit(foundy, foundx, 2)
    return found_fit

def nearby_search(binary_warped, left_fit, right_fit, margin=100):
    nonzero = binary_warped.nonzero()
    nonzeroy = np.array(nonzero[0])
    nonzerox = np.array(nonzero[1])
    new_left_fit = nearby_search_from_nonzero(nonzerox, nonzeroy, left_fit, margin )
    new_right_fit = nearby_search_from_nonzero(nonzerox, nonzeroy, right_fit, margin )
    return new_left_fit, new_right_fit

## Generate x and y values for plotting
#ploty = np.linspace(0, binary_warped.shape[0]-1, binary_warped.shape[0] )
#left_fitx = left_fit[0]*ploty**2 + left_fit[1]*ploty + left_fit[2]
#right_fitx = right_fit[0]*ploty**2 + right_fit[1]*ploty + right_fit[2]
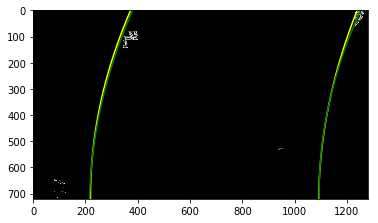
for binary_warped in warped_binary_images:
left_fit, right_fit, out_img = slide_window_search( binary_warped)
### Visualization
# Extract left and right line pixel positions
# create y values
ploty = np.linspace(0, binary_warped.shape[0]-1, binary_warped.shape[0] )
# find x value for every y values
left_fitx = left_fit[0]*ploty**2 + left_fit[1]*ploty + left_fit[2]
right_fitx = right_fit[0]*ploty**2 + right_fit[1]*ploty + right_fit[2]
plt.imshow(out_img)
plt.plot(left_fitx, ploty, color='yellow')
plt.plot(right_fitx, ploty, color='yellow')
plt.xlim(0, 1280)
plt.ylim(720, 0)
plt.show()
For polynomial \begin{equation} f(y)=Ay^2 + By + c \end{equation}
Radius of Curvature is defined as \begin{equation} Rcurve = \frac{[1+(\frac{dx}{dy})^{2}]^{3/2}}{\left | \frac{d^2x}{d^2y} \right |}) \end{equation}
So the result is \begin{equation} Rcurve = \frac{(1+(2Ay+B)^2)^{3/2}}{\left |2A \right |} \end{equation}
In order to measure the curvature near the car, y value is at the bottom of image, that is, image.shape[0]-1.
def curvature( poly_fit, y_eval):
    curverad = ((1 + (2*poly_fit[0]*y_eval + poly_fit[1])**2)**1.5) / np.absolute(2*poly_fit[0])
    return curverad
** Curvature in Real Word Space **
The value of radius of curvature we used to calculate curvature so far based on pixel values. In real world space, we need convert back to meters according to measurement of pictures.
According to U.S. regulations that require a minimum lane width of 12 feet or 3.7 meters, and the dashed lane lines are 10 feet or 3 meters long each, we define the conversion factor as follows,
ym_per_pix = 30/720 # meters per pixel in y dimension
xm_per_pix = 3.7/700 # meters per pixel in x dimension
***The Slide Window and Nearby Search are redefined as follows for add Radius of Curvature ***
def slide_window_search2( binary_warped, xm_per_pix, ym_per_pix, nwindows = 9, margin = 100, minpix = 50, visualize_flag = False):
    # Create an output image to draw on and  visualize the result
    if visualize_flag:
        out_img = np.dstack((binary_warped, binary_warped, binary_warped))*255

    histogram = np.sum(binary_warped[binary_warped.shape[0]/2:,:], axis=0)
    # Find the peak of the left and right halves of the histogram
    # These will be the starting point for the left and right lines
    midpoint = np.int(histogram.shape[0]/2)
    leftx_base = np.argmax(histogram[:midpoint])
    rightx_base = np.argmax(histogram[midpoint:]) + midpoint

    # Set height of windows
    window_height = np.int(binary_warped.shape[0]/nwindows)
    # Identify the x and y positions of all nonzero pixels in the image
    nonzero = binary_warped.nonzero()
    nonzeroy = np.array(nonzero[0])
    nonzerox = np.array(nonzero[1])
    # Current positions to be updated for each window
    leftx_current = leftx_base
    rightx_current = rightx_base
    # Create empty lists to receive left and right lane pixel indices
    left_lane_inds = []
    right_lane_inds = []
    ## for left and right
    for x_current, lane_inds, dot_color in zip(
        [leftx_current, rightx_current], [left_lane_inds, right_lane_inds], [(0,255,0), ((0,255,0))]):
        # Step through the windows one by one
        for window in range(nwindows):
            # Identify window boundaries in x and y (and right and left)
            win_y_low = binary_warped.shape[0] - (window+1)*window_height
            win_y_high = binary_warped.shape[0] - window*window_height

            win_x_low = x_current - margin
            win_x_high = x_current + margin

            # Identify the nonzero pixels in x and y within the window
            good_inds = ((nonzeroy >= win_y_low) & (nonzeroy < win_y_high) &
                              (nonzerox >= win_x_low) & (nonzerox < win_x_high)).nonzero()[0]
            # Append these indices to the lists
            lane_inds.append(good_inds)
            # If you found > minpix pixels, recenter next window on their mean position
            if len(good_inds) > minpix:
                x_current = np.int(np.mean(nonzerox[good_inds]))

    # Concatenate the arrays of indices
    left_lane_inds = np.concatenate(left_lane_inds)
    right_lane_inds = np.concatenate(right_lane_inds)
    leftx = nonzerox[left_lane_inds]
    lefty = nonzeroy[left_lane_inds]
    rightx = nonzerox[right_lane_inds]
    righty = nonzeroy[right_lane_inds]
    if ( len(lefty) == 0) or (len(righty) == 0):
        ## nothing found
        return None, None, None, None
    # fit polynomial
    left_fit = np.polyfit(lefty, leftx, 2)
    right_fit = np.polyfit(righty, rightx, 2)
    real_left_fit = np.polyfit(lefty * ym_per_pix, leftx * xm_per_pix, 2)
    real_right_fit = np.polyfit(righty * ym_per_pix, rightx * xm_per_pix, 2)

    if visualize_flag:
        # draw found points
        out_img[nonzeroy[left_lane_inds], nonzerox[left_lane_inds]] = [255, 0, 0]
        out_img[nonzeroy[right_lane_inds], nonzerox[right_lane_inds]] = [0, 0, 255]

    # calcculate curvature
    y_value =  (binary_warped.shape[0]-1) * ym_per_pix
    left_curverad = curvature(real_left_fit, y_value)
    right_curverad = curvature(real_right_fit, y_value)
    # use the more confident curverad
    if len(leftx) > len(rightx):
        right_curverad = left_curverad
    else:
        left_curverad = right_curverad
    if visualize_flag:
        return left_fit, right_fit, left_curverad, right_curverad, out_img
    else:
        return left_fit, right_fit, left_curverad, right_curverad

def nearby_search_from_nonzero2(nonzerox, nonzeroy, prev_fit, margin, xm_per_pix, ym_per_pix, max_y_value):
    lane_inds = ((nonzerox > (prev_fit[0]*(nonzeroy**2) + prev_fit[1]*nonzeroy + prev_fit[2] - margin)) &
                      (nonzerox < (prev_fit[0]*(nonzeroy**2) + prev_fit[1]*nonzeroy + prev_fit[2] + margin)))

    # Extract left and right line pixel positions
    foundx = nonzerox[lane_inds]
    foundy = nonzeroy[lane_inds]
    ## Fit a second order polynomial to each
    if len(foundx) == 0:
        return None, None, len(foundx)
    found_fit = np.polyfit(foundy, foundx, 2)
    ## find curvature
    real_fit = np.polyfit(foundy * ym_per_pix, foundx * xm_per_pix, 2)
    curverad = curvature(real_fit, max_y_value * ym_per_pix)
    return found_fit, curverad, len(foundx)

def nearby_search2(binary_warped, left_fit, right_fit, xm_per_pix, ym_per_pix, margin=100):
    nonzero = binary_warped.nonzero()
    max_y_value = binary_warped.shape[0]-1
    nonzeroy = np.array(nonzero[0])
    nonzerox = np.array(nonzero[1])
    new_left_fit, left_curvature, left_count = nearby_search_from_nonzero2(nonzerox, nonzeroy, left_fit, margin, xm_per_pix, ym_per_pix, max_y_value )
    new_right_fit, right_curvature, right_count = nearby_search_from_nonzero2(nonzerox, nonzeroy, right_fit, margin, xm_per_pix, ym_per_pix, max_y_value )
    if left_count > right_count:
        right_curvature = left_curvature
    else:
        left_curvature = right_curvature
    return new_left_fit, new_right_fit, left_curvature, right_curvature
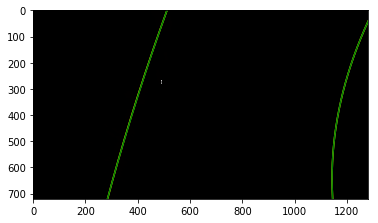
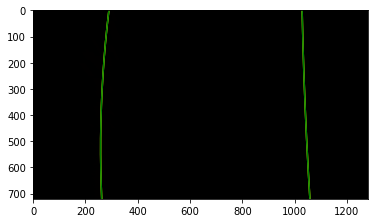
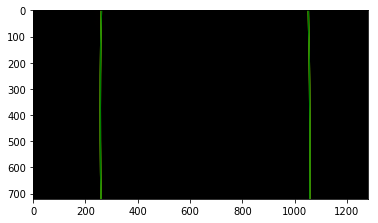
for binary_warped in warped_binary_images:
left_fit, right_fit, left_curverad, right_curverad, out_img = slide_window_search2(
binary_warped, xm_per_pix, ym_per_pix, visualize_flag = True )
new_left_fit, new_right_fit, new_left_curverad, new_right_curverad = nearby_search2(
binary_warped, left_fit, right_fit, xm_per_pix, ym_per_pix, margin=100)
### Visualization
# create y values
ploty = np.linspace(0, binary_warped.shape[0]-1, binary_warped.shape[0] )
# find x value for every y values
left_fitx = left_fit[0]*ploty**2 + left_fit[1]*ploty + left_fit[2]
right_fitx = right_fit[0]*ploty**2 + right_fit[1]*ploty + right_fit[2]
new_left_fitx = new_left_fit[0]*ploty**2 + new_left_fit[1]*ploty + new_left_fit[2]
new_right_fitx = new_right_fit[0]*ploty**2 + new_right_fit[1]*ploty + new_right_fit[2]
plt.imshow(out_img)
plt.plot(left_fitx, ploty, color='yellow')
plt.plot(right_fitx, ploty, color='yellow')
plt.plot(new_left_fitx, ploty, color='green')
plt.plot(new_right_fitx, ploty, color='green')
plt.xlim(0, 1280)
plt.ylim(720, 0)
plt.show()
print('Old Curvature ', left_curverad, 'm', right_curverad, 'm')
print('New Curvature ', new_left_curverad, 'm', new_right_curverad, 'm') Old Curvature 2388.90865777 m 2388.90865777 m
New Curvature 2577.16741506 m 2577.16741506 m
Old Curvature  462.519609118 m 462.519609118 m
New Curvature  462.519609118 m 462.519609118 m
Old Curvature  1049.85166869 m 1049.85166869 m
New Curvature  2028.51805736 m 2028.51805736 m
Old Curvature  434.077880523 m 434.077880523 m
New Curvature  379.357803959 m 379.357803959 m
Old Curvature  540.384605074 m 540.384605074 m
New Curvature  575.97060051 m 575.97060051 m
Old Curvature  2462.51233887 m 2462.51233887 m
New Curvature  2716.59504241 m 2716.59504241 m
Old Curvature  1441.25640443 m 1441.25640443 m
New Curvature  1441.25640443 m 1441.25640443 m
Old Curvature  7926.95367173 m 7926.95367173 m
New Curvature  7926.95367171 m 7926.95367171 m
def slide_window_search3( binary_warped, nwindows=9, margin=100, minpix=30, visualize_flag=False):
    # Create an output image to draw on and  visualize the result
    if visualize_flag:
        out_img = np.dstack((binary_warped, binary_warped, binary_warped))*255
    else:
        out_img = None
    histogram = np.sum(binary_warped[binary_warped.shape[0]/3*2:,:], axis=0)
    # Find the peak of the left and right halves of the histogram
    # These will be the starting point for the left and right lines
    midpoint = np.int(histogram.shape[0]/2)
    leftx_base = np.argmax(histogram[:midpoint])
    rightx_base = np.argmax(histogram[midpoint:]) + midpoint

    # Set height of windows
    window_height = np.int(binary_warped.shape[0]/nwindows)
    # Identify the x and y positions of all nonzero pixels in the image
    nonzero = binary_warped.nonzero()
    nonzeroy = np.array(nonzero[0])
    nonzerox = np.array(nonzero[1])
    # Current positions to be updated for each window
    leftx_current = leftx_base
    rightx_current = rightx_base
    # Create empty lists to receive left and right lane pixel indices
    left_lane_inds = []
    right_lane_inds = []
    ## for left and right
    for x_current, lane_inds in zip(
        [leftx_current, rightx_current], [left_lane_inds, right_lane_inds]):
        # Step through the windows one by one
        for window in range(nwindows):
            # Identify window boundaries in x and y (and right and left)
            win_y_low = binary_warped.shape[0] - (window+1)*window_height
            win_y_high = binary_warped.shape[0] - window*window_height

            win_x_low = x_current - margin
            win_x_high = x_current + margin

            # Identify the nonzero pixels in x and y within the window
            good_inds = ((nonzeroy >= win_y_low) & (nonzeroy < win_y_high) &
                              (nonzerox >= win_x_low) & (nonzerox < win_x_high)).nonzero()[0]
            # Append these indices to the lists
            lane_inds.append(good_inds)
            # If you found > minpix pixels, recenter next window on their mean position
            if len(good_inds) > minpix:
                x_current = np.int(np.mean(nonzerox[good_inds]))

    # Concatenate the arrays of indices
    left_lane_inds = np.concatenate(left_lane_inds)
    right_lane_inds = np.concatenate(right_lane_inds)
    leftx = nonzerox[left_lane_inds]
    lefty = nonzeroy[left_lane_inds]
    rightx = nonzerox[right_lane_inds]
    righty = nonzeroy[right_lane_inds]
    # fit polynomial
#    left_fit = np.polyfit(lefty, leftx, 2)
#    right_fit = np.polyfit(righty, rightx, 2)
#    real_left_fit = np.polyfit(lefty * ym_per_pix, leftx * xm_per_pix, 2)
#    real_right_fit = np.polyfit(righty * ym_per_pix, rightx * xm_per_pix, 2)

    if visualize_flag:
        # draw found points
        out_img[nonzeroy[left_lane_inds], nonzerox[left_lane_inds]] = [255, 30, 255]
        out_img[nonzeroy[right_lane_inds], nonzerox[right_lane_inds]] = [50, 0, 255]

    return leftx, lefty, rightx, righty, out_img

    # calcculate curvature
#    y_value =  (binary_warped.shape[0]-1) * ym_per_pix
#    left_curverad = curvature(real_left_fit, y_value)
#    right_curverad = curvature(real_right_fit, y_value)
#    # use the more confident curverad
#    if len(leftx) > len(rightx):
#        right_curverad = left_curverad
#    else:
#        left_curverad = right_curverad
#    if visualize_flag:
#        return left_fit, right_fit, left_curverad, right_curverad, out_img
#    else:
#        return left_fit, right_fit, left_curverad, right_curverad

def nearby_search_from_nonzero3(nonzerox, nonzeroy, prev_fit, margin, out_img, lane_color ):
    lane_inds = ((nonzerox > (prev_fit[0]*(nonzeroy**2) + prev_fit[1]*nonzeroy + prev_fit[2] - margin)) &
                      (nonzerox < (prev_fit[0]*(nonzeroy**2) + prev_fit[1]*nonzeroy + prev_fit[2] + margin)))
    # Extract left and right line pixel positions
    foundx = nonzerox[lane_inds]
    foundy = nonzeroy[lane_inds]
    if out_img is not None:
        out_img[foundy, foundx] = lane_color
    ## Fit a second order polynomial to each
    return foundx, foundy
#    if len(foundx) == 0:
#        return None, None, len(foundx)
#    found_fit = np.polyfit(foundy, foundx, 2)
#    ## find curvature
#    real_fit = np.polyfit(foundy * ym_per_pix, foundx * xm_per_pix, 2)
#    curverad = curvature(real_fit, max_y_value * ym_per_pix)
#    return found_fit, curverad, len(foundx)

def nearby_search3(binary_warped, left_fit, right_fit, margin=150, visualize_flag=False):
    if visualize_flag:
        out_img = np.dstack((binary_warped, binary_warped, binary_warped))*255
    else:
        out_img = None
    nonzero = binary_warped.nonzero()
    max_y_value = binary_warped.shape[0]-1
    nonzeroy = np.array(nonzero[0])
    nonzerox = np.array(nonzero[1])
    leftx, lefty = nearby_search_from_nonzero3(nonzerox, nonzeroy, left_fit, margin, out_img, [255, 30, 255] )
    rightx, righty = nearby_search_from_nonzero3(nonzerox, nonzeroy, right_fit, margin, out_img, [50, 0, 255] )
    return leftx, lefty, rightx, righty, out_img
# test slide window and nearby search functions
for binary_warped in warped_binary_images:
max_y_value = (binary_warped.shape[0]-1)
leftx, lefty, rightx, righty, out_img = slide_window_search3( binary_warped, visualize_flag=True )
left_fit = np.polyfit(lefty, leftx, 2)
right_fit = np.polyfit(righty, rightx, 2)
real_left_fit = np.polyfit(lefty*ym_per_pix, leftx*xm_per_pix, 2)
left_curverad = curvature(real_left_fit, max_y_value*ym_per_pix)
real_right_fit = np.polyfit(righty*ym_per_pix, rightx*xm_per_pix, 2)
right_curverad = curvature(real_right_fit, max_y_value*ym_per_pix)
# use nearby search
new_leftx, new_lefty, new_rightx, new_righty, out_img2 = nearby_search3(
binary_warped, left_fit, right_fit, margin=100)
new_left_fit = np.polyfit(new_lefty, new_leftx, 2)
new_right_fit = np.polyfit(new_righty, new_rightx, 2)
new_real_left_fit = np.polyfit(new_lefty * ym_per_pix, new_leftx * xm_per_pix, 2)
new_left_curverad = curvature(new_real_left_fit, max_y_value * ym_per_pix)
new_real_right_fit = np.polyfit(new_righty * ym_per_pix, new_rightx * xm_per_pix, 2)
new_right_curverad = curvature(new_real_right_fit, max_y_value * ym_per_pix)
### Visualization
# create y values
ploty = np.linspace(0, binary_warped.shape[0]-1, binary_warped.shape[0] )
# find x value for every y values
left_fitx = left_fit[0]*ploty**2 + left_fit[1]*ploty + left_fit[2]
right_fitx = right_fit[0]*ploty**2 + right_fit[1]*ploty + right_fit[2]
new_left_fitx = new_left_fit[0]*ploty**2 + new_left_fit[1]*ploty + new_left_fit[2]
new_right_fitx = new_right_fit[0]*ploty**2 + new_right_fit[1]*ploty + new_right_fit[2]
plt.imshow(out_img)
plt.plot(left_fitx, ploty, color='yellow')
plt.plot(right_fitx, ploty, color='yellow')
plt.plot(new_left_fitx, ploty, color='green')
plt.plot(new_right_fitx, ploty, color='green')
plt.xlim(0, 1280)
plt.ylim(720, 0)
plt.show()
print('Old Curvature ', left_curverad, 'm', right_curverad, 'm')
print('New Curvature ', new_left_curverad, 'm', new_right_curverad, 'm') Old Curvature 2233.08589113 m 550.561365076 m
New Curvature 2539.42952108 m 522.951718624 m
Old Curvature  462.519609118 m 1509.27829465 m
New Curvature  462.519609118 m 1541.85567995 m
Old Curvature  1049.85166869 m 527.742343723 m
New Curvature  2028.51805736 m 527.742343723 m
Old Curvature  434.077880523 m 356.210371419 m
New Curvature  379.357803959 m 357.073882461 m
Old Curvature  541.528566524 m 615.734007909 m
New Curvature  575.97060051 m 507.91758385 m
Old Curvature  2462.51233887 m 431.211354682 m
New Curvature  2716.59504241 m 431.211354682 m
Old Curvature  1441.25640443 m 5762.23249285 m
New Curvature  1441.25640443 m 5762.23249285 m
Old Curvature  5898.9730451 m 7926.95367173 m
New Curvature  5898.9730451 m 7926.95367171 m
The curvatures of warped images are displayed as follows.
Assume camera is mounted at the center of the car and the land center is the center between the lane lines. The offset of the lane center from the center of the image (converted from pixels to meters) is your distance from the center of the lane.
def camera_offset(left_fit, right_fit, center_pix, y_value, xm_per_pix0 = xm_per_pix):
    left_lane_x = left_fit[0]*y_value**2 + left_fit[1]*y_value + left_fit[2]
    right_lane_x = right_fit[0]*y_value**2 + right_fit[1]*y_value + right_fit[2]
    lane_center = (left_lane_x + right_lane_x) // 2
    offset_meter = (center_pix - lane_center) * xm_per_pix0
    return offset_meter
for binary_warped in warped_binary_images:
left_fit, right_fit, out_img = slide_window_search( binary_warped, visualize_flag=True )
### Visualization
# create y values
ploty = np.linspace(0, binary_warped.shape[0]-1, binary_warped.shape[0] )
# find x value for every y values
left_fitx = left_fit[0]*ploty**2 + left_fit[1]*ploty + left_fit[2]
right_fitx = right_fit[0]*ploty**2 + right_fit[1]*ploty + right_fit[2]
y_value = (out_img.shape[0]-1)
center_pix = out_img.shape[1] // 2
offset = camera_offset( left_fit, right_fit, center_pix, y_value, xm_per_pix )
hint_text = "offset: {0:6.2f}m".format( offset)
# offset
text_color = (255,255,255)
text_font = cv2.FONT_HERSHEY_SIMPLEX
font_scale = 1.5
text_thinkness = 6
cv2.putText(out_img, hint_text, (400,100), text_font,font_scale,text_color, text_thinkness)
plt.imshow(out_img)
plt.plot(left_fitx, ploty, color='yellow')
plt.plot(right_fitx, ploty, color='yellow')
plt.xlim(0, 1280)
plt.ylim(720, 0)
plt.show()A clas Line() is created to keep track of line properties, like radius of curvature, polynomial fit coefficients. Besides, some functions are defined for
# Define a class to receive the characteristics of each line detection
class Line():
    def __init__(self):
        # was the line detected in the last iteration?
        self.detected = False
        # x values of the last n fits of the line
#        self.recent_xfitted = []
        #average x values of the fitted line over the last n iterations
        self.bestx = None
        self.besty = None
        #polynomial coefficients averaged over the last n iterations
        self.best_fit = None
        #polynomial coefficients for the most recent fit
        self.current_fit = np.array([]).reshape((0,3))
        #radius of curvature of the line in some units
        self.radius_of_curvature = None
        #distance in meters of vehicle center from the line
        self.line_base_pos = None
        #difference in fit coefficients between last and new fits
        self.diffs = np.array([0,0,0], dtype='float')
        #x values for detected line pixels
        self.allx = []
        #y values for detected line pixels
        self.ally = []
-
Sanity Check
- Checking that they have similar curvature
- Checking that they are separated by approximately the right distance horizontally
- Checking that they are roughly parallel
# default tolerence of difference is 0.5 meter
# convert to pixels
default_tolerence = 0.53 / xm_per_pix
def sanity_check(left_fit, right_fit, height_px, tolerence_px = default_tolerence, nwindows=9):
    # check the parallel of lanes
    dy = np.linspace(height_px * 1 / 4, height_px-1, nwindows )
    left_fitx =  left_fit[0]*dy**2 +  left_fit[1]*dy +  left_fit[2]
    right_fitx = right_fit[0]*dy**2 + right_fit[1]*dy + right_fit[2]
    distance_x = right_fitx - left_fitx
    min_value = min( distance_x)
    max_value = max( distance_x)
    #if ( (max_value - min_value) > tolerence_px):
    #    print( "difference = {0}".format(max_value - min_value))
    return (max_value - min_value) <= tolerence_px
-
Look-Ahead Filter
Once line are found, the line in next frame is nearby so that no need to search again.
-
Reset
If loses lines in next several frames, we should search the lines from scratch using histogram and slide windows.
-
Smooth
Take average measurement from past n frames to draw the lane positions.
-
Draw
I use the best fit coefficients to generate the coordinates of lane lines, draw a polygon with these coordinates in the warped bitmap. The wraped bitbmp image is transferred back to unwarp bitmap and draw on the original image. The radius curvature and offset of car are drawn on the top of original image, too.
def lane_image(left_fit, right_fit, image_shape, Minv, draw_color=(0,255,0)):
    warp_zero = np.zeros(shape=image_shape).astype(np.uint8)
    color_warp = np.dstack((warp_zero, warp_zero, warp_zero))

    ploty = np.linspace(0, binary_warped.shape[0]-1, binary_warped.shape[0] )
    # find x value for every y values
    left_fitx = left_fit[0]*ploty**2 + left_fit[1]*ploty + left_fit[2]
    right_fitx = right_fit[0]*ploty**2 + right_fit[1]*ploty + right_fit[2]

    # Recast the x and y points into usable format for cv2.fillPoly()
    pts_left = np.array([np.transpose(np.vstack([left_fitx, ploty]))])
    pts_right = np.array([np.flipud(np.transpose(np.vstack([right_fitx, ploty])))])
    pts = np.hstack((pts_left, pts_right))

    # Draw the lane onto the warped blank image
    cv2.fillPoly(color_warp, np.int_([pts]), draw_color)

    # Warp the blank back to original image space using inverse perspective matrix (Minv)
    newwarp = cv2.warpPerspective(color_warp, Minv, (image_shape[1], image_shape[0]))
return newwarpsrc = np.float32([
[588, 455],
[697, 455],
[1055, 690],
[ 261, 690]])
dst = np.float32([
[261, 0],
[1055, 0],
[1055, 719],
[261, 719]])
INV_M_Perspective = cv2.getPerspectiveTransform(dst, src)
# test lane image
for i in range(len(undistorted_images)):
undist = undistorted_images[i]
binary_warped = warped_binary_images[i]
left_fit, right_fit, left_curverad, right_curverad = slide_window_search2( binary_warped, xm_per_pix, ym_per_pix, visualize_flag = False )
newwarp = lane_image(left_fit, right_fit, binary_warped.shape, INV_M_Perspective, draw_color=(255, 0 ,0))
### Visualization
out_image = cv2.addWeighted(undist, 1, newwarp, 0.3, 0)
y_value = (binary_warped.shape[0]-1)
center_pix = binary_warped.shape[1] // 2
offset = camera_offset( left_fit, right_fit, center_pix, y_value, xm_per_pix )
hint_text = "offset: {0:6.2f}m".format( offset)
# offset
text_color = (255,255,255)
text_font = cv2.FONT_HERSHEY_SIMPLEX
font_scale = 1.5
text_thinkness = 6
cv2.putText(out_image, hint_text, (400,100), text_font,font_scale,text_color, text_thinkness)
plt.imshow(out_image)
# plt.plot(left_fitx, ploty, color='yellow')
# plt.plot(right_fitx, ploty, color='yellow')
plt.xlim(0, 1280)
plt.ylim(720, 0)
plt.show()# Initialization
#
# 1. Get objpoints and imgpoints from previous saved file
#
dist_pickle = pickle.load( open( "calibration_image_points.p", "rb" ) )
objpoints = dist_pickle["objpoints"]
imgpoints = dist_pickle["imgpoints"]
#
# 2. perspective transform coordinate
#
src = np.float32([
[588, 455],
[697, 455],
[1055, 690],
[ 261, 690]])
dst = np.float32([
[261, 0],
[1055, 0],
[1055, 719],
[261, 719]])
M_Perspective = cv2.getPerspectiveTransform(src, dst)
INV_M_Perspective = cv2.getPerspectiveTransform(dst, src)
# Camera calibration for first frame
calibrate_camera_flag = True
# camera calibration parameters
dist = None
mtx = None
#
# 3. Initialize left and right line object
#
left_line_object = Line()
right_line_object = Line()
def save_filter(left_line, right_line, left_fit, right_fit, left_curverad, right_curverad, filter_size):
left_line.current_fit = np.concatenate(([left_fit], left_line.current_fit), axis=0)[:filter_size]
right_line.current_fit = np.concatenate(([right_fit], right_line.current_fit), axis=0)[:filter_size]
# best fit is average of current fit
left_line.best_fit = np.mean(left_line.current_fit, axis=0)
right_line.best_fit = np.mean(right_line.current_fit, axis=0)
# curvature
left_line.radius_of_curvature, right_line.radius_of_curvature = left_curverad, right_curverad
def process_image(img,
left_line =left_line_object,
right_line = right_line_object,
xm_per_pix0 = xm_per_pix,
ym_per_pix0 = ym_per_pix,
filter_size=6,
is_RGB=True):
# undistore the image
global calibrate_camera_flag, mtx, dist
if calibrate_camera_flag:
calibrate_camera_flag = False
mtx, dist = calibrate_camera(img, objpoints, imgpoints)
#undist = cal_undistort(img, objpoints, imgpoints)
undist = undistort_image(img, mtx, dist)
# get thresh binary image
#binary_image = thresh_binary(undist, s_thresh=(30, 255), sx_thresh=(30, 255))
binary_image = thresh_binary_yellow_and_white(undist, is_RGB)
#
img_size = (binary_image.shape[1], binary_image.shape[0])
warped_binary = cv2.warpPerspective(binary_image, M_Perspective, img_size, flags=cv2.INTER_LINEAR)
# center_pix for offset calculation
center_pix = binary_image.shape[1] // 2
# y value at car position
y_value = binary_image.shape[0]-1
reset_flag = False
# detect lines
if left_line.detected: #
left_fit, right_fit, left_curverad, right_curverad = nearby_search2(
warped_binary, left_line.current_fit[0], right_line.current_fit[0], xm_per_pix0, ym_per_pix0 )
if (left_fit is None) or (right_fit is None) or not sanity_check(left_fit, right_fit, binary_image.shape[0]):
current_len = left_line.current_fit.shape[0]
if current_len > 1:
left_line.current_fit = left_line.current_fit[0:current_len-1]
right_line.current_fit = right_line.current_fit[0:current_len-1]
else:
# lost lane lines, need to reset
reset_flag = True
left_line.detected, right_line.detected = False, False
left_line.current_fit = np.array([]).reshape((0,3))
right_line.current_fit = np.array([]).reshape((0,3))
else:
save_filter(left_line, right_line, left_fit, right_fit, left_curverad, right_curverad, filter_size)
# car offset
offset = camera_offset(left_line.best_fit, right_line.best_fit, center_pix, y_value, xm_per_pix0)
else:
reset_flag = True
# use slide windows
if reset_flag:
left_fit, right_fit, left_curverad, right_curverad = slide_window_search2( warped_binary, xm_per_pix0, ym_per_pix0, visualize_flag = False )
if (left_fit is not None) and (right_fit is not None) and sanity_check(left_fit, right_fit, binary_image.shape[0]):
left_line.detected, right_line.detected = True, True
# keep filter_size records
save_filter(left_line, right_line, left_fit, right_fit, left_curverad, right_curverad, filter_size)
# car offset
offset = camera_offset(left_line.best_fit, right_line.best_fit, center_pix, y_value, xm_per_pix0)
if left_line.detected:
# average curvature
average_curve = int((left_line.radius_of_curvature + right_line.radius_of_curvature) // 2)
hint_text = "curve: {0:8d}m offset: {1:6.2f}m".format(average_curve, offset)
### Visualization
newwarp = lane_image(left_line.best_fit, right_line.best_fit, warped_binary.shape, INV_M_Perspective)
out_image = cv2.addWeighted(undist, 1, newwarp, 0.3, 0)
# put curvature, offset
text_color = (255,255,255)
text_font = cv2.FONT_HERSHEY_SIMPLEX
font_scale = 1
line_thinkness = 2
cv2.putText(out_image, hint_text, (350,100), text_font,font_scale,text_color, line_thinkness)
return out_image
else:
return undist# test pipeline
# initialize line object
left_line_object = Line()
right_line_object = Line()
calibrate_camera_flag = True
images = glob.glob( '../test_images/test*.jpg' )
for fname in images:
img = cv2.imread(fname)
# repeat 3 times
for i in range(3):
out_image = process_image(img,filter_size=2, is_RGB=False)
f, (ax1, ax2) = plt.subplots(1, 2, figsize=(24, 9))
f.tight_layout()
ax1.imshow(cv2.cvtColor(img, cv2.COLOR_BGR2RGB))
ax1.set_title('Original Image ' + fname.split('\\')[-1], fontsize=50)
ax2.imshow(cv2.cvtColor(out_image, cv2.COLOR_BGR2RGB))
ax2.set_title('Output Image', fontsize=50)
plt.subplots_adjust(left=0., right=1, top=0.9, bottom=0.)
# Initialization
#
# 1. Get objpoints and imgpoints from previous saved file
#
dist_pickle = pickle.load( open( "calibration_image_points.p", "rb" ) )
objpoints = dist_pickle["objpoints"]
imgpoints = dist_pickle["imgpoints"]
#
# 2. perspective transform coordinate
#
src = np.float32([
    [588, 455],
    [697, 455],
    [1055, 690],
    [ 261, 690]])

dst = np.float32([
    [261,  0],
    [1055, 0],
    [1055, 719],
    [261,  719]])

M_Perspective = cv2.getPerspectiveTransform(src, dst)
INV_M_Perspective = cv2.getPerspectiveTransform(dst, src)
# Camera calibration for first frame
calibrate_camera_flag = True
# camera calibration parameters
dist = None
mtx = None
#
# 3. Initialize left and right line object
#
left_line_object = Line()
right_line_object = Line()

def cut_top( dx, dy, top_value):
    cond = np.array(dy) > top_value
    return np.extract(cond, dx), np.extract(cond, dy)

def process_image3(img,
                  xm_per_pix0 = xm_per_pix,
                  ym_per_pix0 = ym_per_pix,
                  filter_size=4,
                  is_RGB=True, visualize_flag=False):
    # undistore the image
    global calibrate_camera_flag, mtx, dist
    global left_line_object, right_line_object

    left_line, right_line = left_line_object, right_line_object

    if calibrate_camera_flag:
        calibrate_camera_flag = False
        mtx, dist = calibrate_camera(img, objpoints, imgpoints)
    #undist = cal_undistort(img, objpoints, imgpoints)
    undist = undistort_image(img, mtx, dist)
    # get thresh binary image
    #binary_image = thresh_binary(undist, s_thresh=(30, 255), sx_thresh=(30, 255))
    binary_image = thresh_binary_yellow_and_white(undist, is_RGB)
    #
    img_size = (binary_image.shape[1], binary_image.shape[0])
    warped_binary = cv2.warpPerspective(binary_image, M_Perspective, img_size, flags=cv2.INTER_LINEAR)
    # center_pix for offset calculation
    center_pix = binary_image.shape[1] // 2
    # y value at car position
    max_y_value = binary_image.shape[0]-1

    reset_flag = False
    # detect lines
    if not left_line.detected:
        reset_flag=True
    else:
        #print('nearby_search3')
        leftx, lefty, rightx, righty, out_binary = nearby_search3(
            warped_binary, left_line.best_fit, right_line.best_fit, margin=150, visualize_flag=visualize_flag)
        if len(leftx) == 0: # too little found
            # delete last one
            current_len = len(left_line.allx)
            if current_len > 1:
                left_line.allx = left_line.allx[1:]
                left_line.ally = left_line.ally[1:]
                right_line.allx = right_line.allx[1:]
                right_line.ally = right_line.ally[1:]
            else:
                left_line.detected=False
                right_line.detected=False
                left_line.allx=[]
                left_line.ally=[]
                right_line.allx=[]
                right_line.ally=[]
                reset_flag=True
        else:
            left_line.detected=True
            right_line.detected=True

#            left_line.allx.append(leftx)
#            left_line.ally.append(lefty)
#            right_line.allx.append(rightx)
#            right_line.ally.append(righty)

            if len(left_line.allx) >= filter_size: # too long
                left_line.allx = left_line.allx[1:]
                left_line.ally = left_line.ally[1:]
                right_line.allx = right_line.allx[1:]
                right_line.ally = right_line.ally[1:]


    if reset_flag:
        #print('slide_window_search3')
        leftx, lefty, rightx, righty, out_binary = slide_window_search3( warped_binary, visualize_flag=visualize_flag)

#        left_line.allx.append(leftx)
#        left_line.ally.append(lefty)
#        right_line.allx.append(rightx)
#        right_line.ally.append(righty)

        # prevent too many older data
        if len(left_line.allx) >= filter_size: # too long
            left_line.allx = left_line.allx[1:]
            left_line.ally = left_line.ally[1:]
            right_line.allx = right_line.allx[1:]
            right_line.ally = right_line.ally[1:]
    if len(left_line.allx) > 0:
        left_line.bestx = np.concatenate(left_line.allx)
        left_line.besty = np.concatenate(left_line.ally)
        left_line.bestx = np.concatenate((left_line.bestx, leftx))
        left_line.besty = np.concatenate((left_line.besty, lefty))
    else:
        left_line.bestx = leftx
        left_line.besty = lefty
    if len(right_line.allx) > 0:
        right_line.bestx = np.concatenate(right_line.allx)
        right_line.besty = np.concatenate(right_line.ally)
        right_line.bestx = np.concatenate((right_line.bestx, rightx))
        right_line.besty = np.concatenate((right_line.besty, righty))
    else:
        right_line.bestx = rightx
        right_line.besty = righty


    # only save bottom points for average
    leftx, lefty = cut_top( leftx, lefty, binary_image.shape[0] / 8)
    rightx, righty = cut_top( rightx, righty, binary_image.shape[0] / 8)

    left_line.allx.append(leftx)
    left_line.ally.append(lefty)
    right_line.allx.append(rightx)
    right_line.ally.append(righty)


    if len(left_line.bestx) > 0:
        left_fit = np.polyfit( left_line.besty, left_line.bestx, 2 )
    else:
        left_fit=None
    if len(right_line.bestx) > 0:
        right_fit = np.polyfit( right_line.besty, right_line.bestx, 2 )
    else:
        right_fit=None
    left_line.current_fit=left_fit
    right_line.current_fit=right_fit
    if (left_fit is not None) and (right_fit is not None) and sanity_check(left_fit, right_fit, binary_image.shape[0]):
        left_line.detected=True
        right_line.detected=True
        left_line.best_fit=left_fit
        right_line.best_fit=right_fit
        real_left_fit = np.polyfit(left_line.besty*ym_per_pix0, left_line.bestx*xm_per_pix0, 2)
        left_curverad = curvature(real_left_fit, max_y_value*ym_per_pix0)
        real_right_fit = np.polyfit(right_line.besty*ym_per_pix0, right_line.bestx*xm_per_pix0, 2)
        right_curverad = curvature(real_right_fit, max_y_value*ym_per_pix0)
        if len(left_line.bestx) > len(right_line.bestx):
            left_line.radius_of_curvature, right_line.radius_of_curvature = left_curverad, left_curverad
        else:
            left_line.radius_of_curvature, right_line.radius_of_curvature = right_curverad, right_curverad

    if left_line.detected:
        # average curvature
        offset = camera_offset(left_line.best_fit, right_line.best_fit, center_pix, max_y_value, xm_per_pix0)
        average_curve = int((left_line.radius_of_curvature + right_line.radius_of_curvature) // 2)
        hint_text = "curve: {0:8d}m  offset: {1:6.2f}m".format(average_curve, offset)

        ### Visualization
        newwarp = lane_image(left_line.best_fit, right_line.best_fit, warped_binary.shape, INV_M_Perspective)
        out_image = cv2.addWeighted(undist, 1, newwarp, 0.3, 0)
        # put curvature, offset
        text_color = (255,255,255)
        text_font = cv2.FONT_HERSHEY_SIMPLEX
        font_scale = 1
        line_thinkness = 2
        cv2.putText(out_image, hint_text, (350,100), text_font,font_scale,text_color, line_thinkness)
    else:
        out_image = undist

    if visualize_flag:
        out_image = np.concatenate( (out_image, out_binary), axis = 1)
        binary_color = np.dstack((binary_image, binary_image, binary_image))*255
        warp_color = np.dstack((warped_binary, warped_binary, warped_binary))*255
        merge_color = np.concatenate( (binary_color, warp_color), axis = 1)
        out_image = np.concatenate( (out_image, merge_color), axis = 0)

    return out_image
# test pipeline
# initialize line object
calibrate_camera_flag = True
images = glob.glob( '../test_images/test*.jpg' )
for fname in images:
img = cv2.imread(fname)
left_line_object = Line()
right_line_object = Line()
# repeat 3 times
for i in range(3):
out_image = process_image3(img,filter_size=2, is_RGB=False, visualize_flag=True)
f, (ax1, ax2) = plt.subplots(1, 2, figsize=(24, 9))
f.tight_layout()
ax1.imshow(cv2.cvtColor(img, cv2.COLOR_BGR2RGB))
ax1.set_title('Original Image ' + fname.split('\\')[-1], fontsize=50)
ax2.imshow(cv2.cvtColor(out_image.astype(np.uint8),cv2.COLOR_BGR2RGB) )
ax2.set_title('Output Image', fontsize=50)
plt.subplots_adjust(left=0., right=1, top=0.9, bottom=0.)# Import everything needed to edit/save/watch video clips
from moviepy.editor import VideoFileClip
from IPython.display import HTML# initialize line object
left_line_object = Line()
right_line_object = Line()
calibrate_camera_flag = True
project_output = 'project_output.mp4'
clip1 = VideoFileClip('../project_video.mp4')
project_clip = clip1.fl_image(process_image3)
%time project_clip.write_videofile(project_output, audio=False)[MoviePy] >>>> Building video project_output.mp4
[MoviePy] Writing video project_output.mp4
100%|█████████████████████████████████████████████████████████████████████████████▉| 1260/1261 [03:34<00:00, 5.75it/s]
[MoviePy] Done.
[MoviePy] >>>> Video ready: project_output.mp4
Wall time: 3min 35s
HTML("""
<video width="960" height="540" controls>
  <source src="{0}">
</video>
""".format(project_output))
The output video published at https://youtu.be/toB0nekdt2w.
A side by side debugging video https://youtu.be/bm8kRhplQQg
-
Data Filtering
Without filtering lane lines are flicking.
1. Moving average filter for the last n framesBut moving average is lagging, especially at the turns.
***2. Moving average with refresh changes ***
Assume the car is moving forward. Only keep data for filtering with top of frame cut out. This will keep the filtered data respond rapidly to new frame changes at turns without losing stability of the fitting curve.
-
Color Space Mask at Shadow
When I tried challenge video, I encounter several problem. The first is frame 140 (https://github.com/MichaelTien8901/CarND-Advanced-Lane-Lines/blob/master/test_images/frame140.jpg). The white lane under the shadow is very difficult to pick up.
I trid to use HSL color space and only L channel can see the lane. But adjust the L threshold for this frame will damage other frames' quality of fitlering.
The possible way for this is to use adaptive method, like normalize values before apply threshold value. -
Perspective Transform For Challenge Video
From the side by side video for Challenge Video(https://youtu.be/c_HDcAR0PCc), I can see the program still picks up left and right lanes(color dots at the right hand side). But the sanity test are not passed because the lanes are not evenly separated. It looks like problem of perspective transformation. Either the camera position is a little different from project video, or my perspective transformation coordinates are not good enough.
-
Perspective Transform Destination Coordinate Choices
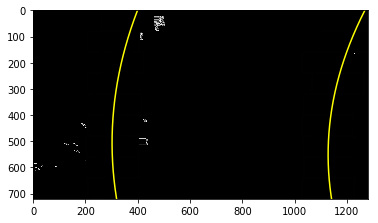
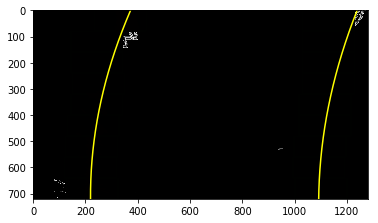
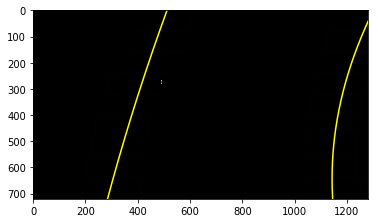
I notice my warped binary images are strange. The top lane line points are spreading sideway. The destination coordinate I used before is,
dst = np.float32([
 [261,  100],
 [1055, 100],
 [1055, 690],
 [261,  690]])
 I randomly choose top coordinate 100, expecting the output image can pick up more data after top points. Turn out
 the pick up lane are limited and distorted.

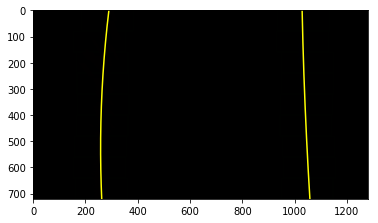
 New destination coordinate are top and bottom edges of image. The result are much cleaner and stable.

```python
dst = np.float32([
   [261,  0],
   [1055, 0],
   [1055, 719],
   [261,  719]])


