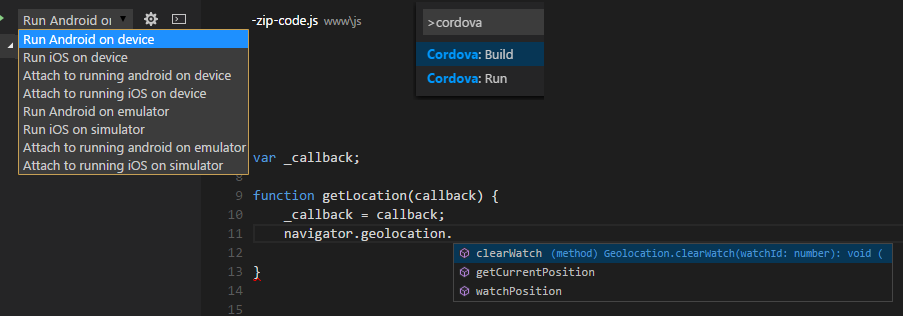
Debug your code, find commands in the Command Palette, and use IntelliSense to browse objects, functions, and parameters in plugin APIs. This extension works with any Cordova-based project.
-
Install NodeJS
-
Open a Terminal (on a Mac) or a Command Prompt (on a Windows computer).
-
Run
npm install -g cordova -
If you're planning on targeting iOS devices,
- Set up your machine by following instructions at iOS Platform Guide from Apache Cordova
- Install HomeBrew on your Mac.
- Open a Terminal and run
brew install ideviceinstaller ios-webkit-debug-proxy
-
If you're planning on targeting Android devices, set up your machine by following instructions at Android Platform Guide from Apache Cordova
-
If you're planning to targeting Electron app, install Electron using
npm install electron.
Open a Terminal or a Command Prompt and run the following command in the root directory of your project
cordova platform add android
Supported platforms: android, ios, electron
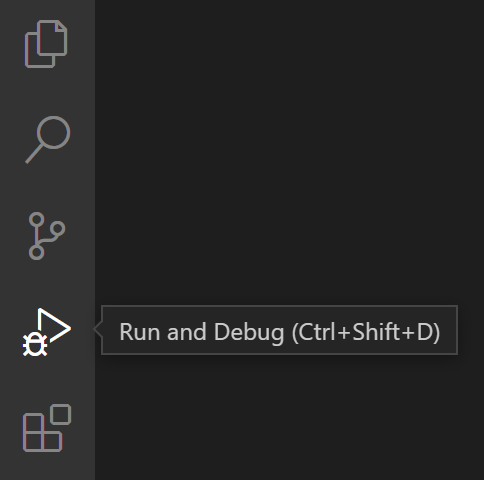
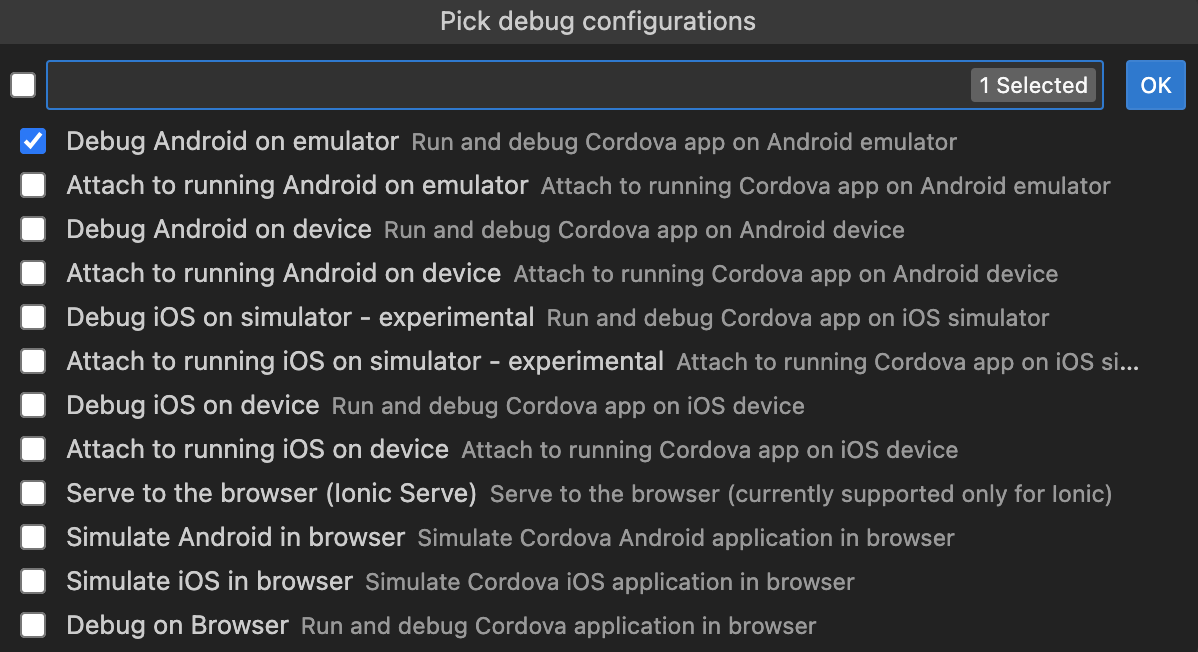
Click the Run and Debug icon in the Activity Bar on the side of VS Code, then click create a launch.json file, select Cordova as debugger and then pick debug configurations.
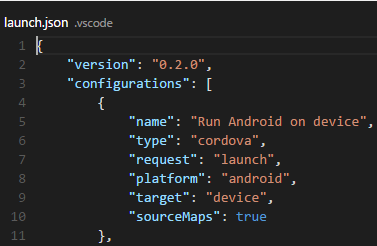
The launch configuration file appears. It contains some default configurations such as what is shown below.
You can modify these configurations or add new ones to the list. Just don't add a Windows configuration as it is not supported yet.
You can use other fields in these configurations as well. Here's the complete list:
| Name | Description | Defaults |
|---|---|---|
port |
The port number that the debugger uses to connect to a device or emulator. Type: number |
9222 |
platform |
The target platform to run for (either ios, android, browser or serve; other platforms are not currently supported).Type: string |
n/a |
target |
Target to run on. Possible values: emulator, device, <name or id of your target emulator or device>,. For simulation in the browser, you can use chrome, edge. If the value is emulator the quick pick window will be expanded with the names of the available Android virtual devices (for iOS virtual targets the list of available system versions of the target will be shown first, and after that another quick pick window will be expanded with the list of iOS simulators names with the selected version of the system), then the target value in launch.json will be changed to the AVD name/iOS Simulator udid of the selected virtual device. If you have only one virtual device available, it will be selected automatically.Note: If you're using Android emulator targets, please, make sure the emulator utility is added to PATH.Type: string |
emulator |
trace |
Trace may be set to true to print diagnostic logs of the extension to the console and write diagnostic logs of the Javascript debugger to the disk.Type: boolean |
true |
sourceMaps |
Set this field to true if you want the debugger to use javascript sourcemaps (if they exist).Type: boolean |
false |
sourceMapPathOverrides |
A set of mappings for rewriting the locations of source files from what the sourcemap says, to their locations on disk. Type: object |
{"webpack:///./*": "${cwd}/*","webpack:///src/*": "${cwd}/*","webpack:///*": "*","webpack:///./~/*": "${cwd}/node_modules/*","./*": "${cwd}/*"} |
webkitRangeMin, webkitRangeMax |
Combines to specify the port range that you want the debugger to use to find the specific device or simulator described in the configuration. Type: number |
9223, 9322 |
attachAttempts |
The maximum number of times that you want the debugger to attempt to attach to a running iOS app. Type: number |
5 |
attachDelay |
The time in milliseconds between each attempt to attach to a running iOS application. Type: number |
1000 |
attachTimeout |
Time in milliseconds to wait before the debugger is attached to the debug session. Type: number |
10000 |
iosDebugProxyPort |
The port number that you want the debugger to use when it launches iOS applications on a device. Type: number |
9221 |
electronPort |
The port number that you want the debugger to use when it launches Electron applications. Type: number |
9223 |
ionicLiveReload |
Set to true to enable Ionic live reload. Type: boolean |
false |
devServerAddress |
For Ionic live reload scenario specify the IP address the device can use to contact the Ionic server. Type: string |
n/a |
devServerPort |
For Ionic live reload scenario specify the port the device can use to contact the Ionic server. Type: number |
n/a |
devServerTimeout |
Timeout in milliseconds for starting the Ionic dev server when serving to the browser or running with Ionic live reload enabled. Type: number |
20000 |
simulatePort |
Port to use for connecting to the local Cordova Simulate server. Type: number |
8000 |
livereload |
When simulating in the browser, determines whether live reload is enabled. Type: boolean |
true |
forcePrepare |
When simulating in the browser, determines whether a file change triggers a cordova prepare before live reloading. Type: boolean |
false |
corsProxy |
When simulating in the browser, determines whether XHR requests are proxied to appear as though they originate from the same domain as the target. Type: boolean |
true |
livereloadDelay |
When simulating in the browser, set the delay in milliseconds between saving of a modified file and the application page reloading. Type: number |
200 |
simulateTempDir |
The directory where temporary browser simulation files are hosted. Type: string |
${workspaceRoot}/.vscode/simulation |
runArguments |
Run arguments (array) to be passed to cordova run/build <platform> or ionic serve command (Override all other configuration params).Type: array |
n/a |
cordovaExecutable |
The path to the local Cordova/Ionic executable. For example:
string |
n/a |
env |
Environment variables passed to the program. Type: object |
n/a |
envFile |
Absolute path to a file containing environment variable definitions. Type: string |
${workspaceFolder}/.env |
skipFiles |
An array of file or folder names, or path globs, to skip when debugging. Type: array |
[ ] |
pathMapping |
A mapping of URLs/paths to local folders, to resolve scripts in app webroot to scripts on disk. Type: object |
{"/": "${workspaceFolder}"} |
runtimeVersion |
If nvm (or nvm-windows) or nvs is used for managing Node.js versions, this attribute can be used to select a specific version of Node.js.Type: string |
n/a |
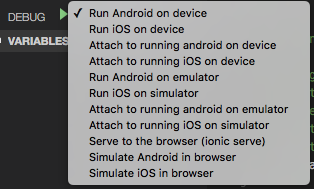
To start the debugger, choose a target from the target drop-down list, and then either click the start button (![]() ) or press F5.
) or press F5.
To restart a Cordova application debugging correctly click on the Restart Cordova debugging button. In case of a launch debug scenario the application will be rebuild otherwise the debugger will reattach to the application.
You can debug your app on an Android emulator or an Android/iOS device. If you have your app running in one already, you can attach the debugger to it. The debugger uses the application ID of your project to locate the running instance.
Visual Studio Emulator for Android: To deploy your app to the Visual Studio Emulator for Android using our extension, you first need to manually launch the emulator. Once it is running, select the
Debug Android on Devicedebug target rather than the emulator target. If ADB didn't automatically recognize the VS Android emulator when you launched it, you will need to runadb connect [EMULATOR'S IP]on the command prompt before trying to deploy. To find out the IP address of your emulator, click the double arrow icon at the bottom of the emulator's side-menu to open the "Additional Tools" window, and go to the "Network" tab. Use the IP of an appropriate network adapter in the list.
We won't go into all of the great things that you can do with the Visual Studio Code debugger, but you can read about it here.
Troubleshooting tip: If you receive an error stating that ADB is not recognized as an internal or external command, you'll have to update your path variable to include the location of your ADB executable file. The ADB executable file is located in a subfolder along with your other Android SDK files. For example, on a Windows computer, the location of the ADB executable file would likely be here:
C:\Program Files (x86)\Android\android-sdk\platform-tools.
Troubleshooting tip: If you press debug button, but nothing happens and you can see only pending spinner for a long time, make sure that Cordova project is opened as a workspace root. If, for instance, you have one parent directory, and your Cordova project is in a subdirectory, it is recommended to use a multi-root workspace approach, so that the debugger can find the necessary Cordova files properly.
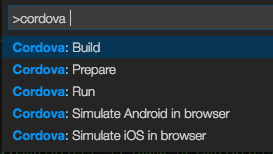
In the Command Palette, type Cordova and choose a command.
The Build command triggers cordova build and builds for all platforms that you've added to the project.
Since all platforms are built you may receive errors for incompatible configurations. For example, if you're on a Windows computer, and you've added an iOS platform to your project, you'll get an error because you need a Mac to build for iOS platforms. You can't build an iOS app on a Mac by using VSCode on a Windows computer.
The Prepare command triggers cordova prepare, which transforms config.xml metadata to platform-specific manifest files, copies icons & splashscreens, copies plugin files for specified platforms so that the project is ready to build with each native SDK.
The Run command triggers cordova run and starts your app without debugging and just like the Build command, it runs all platforms that you've added to your project.
The Simulate Android in browser and Simulate iOS in browser launch your application in the browser and they are described in the next section.
The full list of commands is:
| Name | Command ID | Description |
|---|---|---|
| Cordova: Build | cordova.build |
Build all platforms in project |
| Cordova: Prepare | cordova.prepare |
Copy files into platform for building |
| Cordova: Run | cordova.run |
Starts your app without debugging for each platform |
| Cordova: Clean | cordova.clean |
Cleanup project from build artifacts |
| Ionic: Build | ionic.build |
Build web assets and prepare your app for any platform targets |
| Ionic: Prepare | ionic.prepare |
Copies assets to Cordova platforms, preparing them for native builds |
| Ionic: Clean | ionic.run |
Run an Ionic project on a connected device |
| Cordova: Simulate Android in browser | cordova.simulate.android |
Simulate and launch android application in the browser using cordova-simulate |
| Cordova: Simulate iOS in browser | cordova.simulate.ios |
Simulate and launch ios application in the browser using cordova-simulate |
The debugging target list includes two additional targets: Simulate Android in browser and Simulate iOS in browser. If you don't see these targets in your debugging target list, you might have to remove your .vscode/launch.json configuration file and regenerate it
by following the steps described in the Choose the Cordova debug environment section.
If you just want to run the application in the browser without debugging, two commands with the same names are available in the Command Palette.
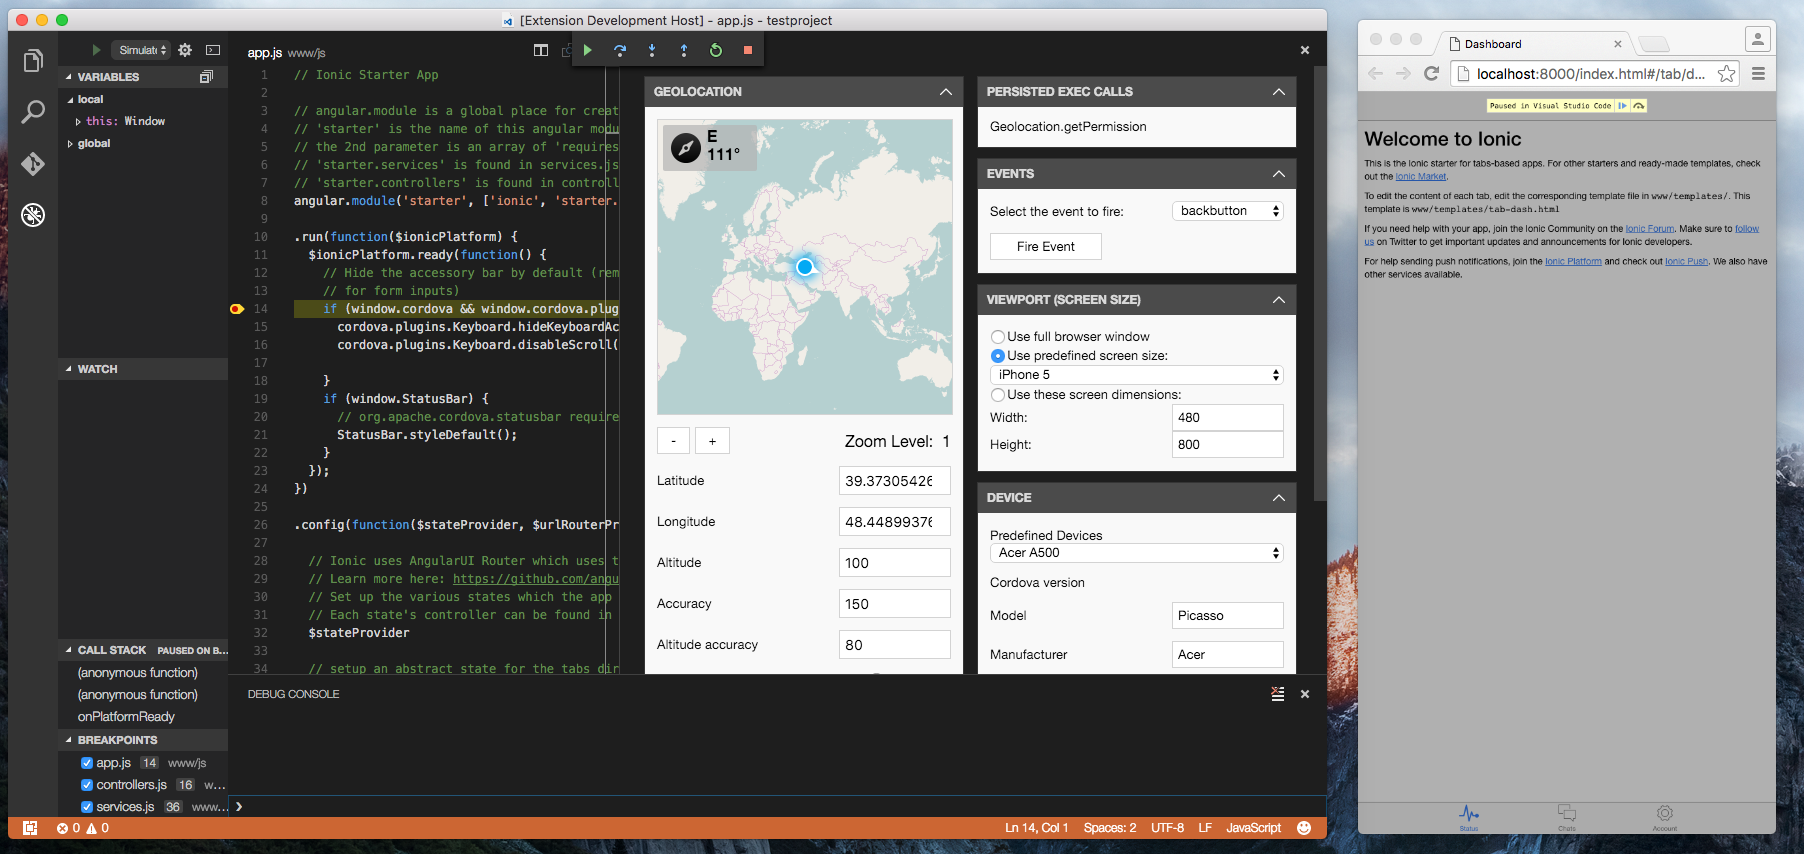
If you launch the application using one of these debug targets or commands, the application will launch in Chrome, and Visual Studio Code will display an additional panel that controls the simulation for the core plugins added to your project. Here are some of the new features:
- support for the majority of core plugins
- live reload
- event firing
- device screen resizing (while debugging only)
Note: If the simulate panel is closed accidentally when you navigate to a new file in your editor, it can be reopened by using
Ctrl+Tab. This is the same command you use for navigating through your open documents.
Here is a video demo of the feature. If you have feature requests or suggestions, please reach out to us here.
-
The debug target includes the ability to serve to the browser for use with Ionic projects. You can now deploy and debug directly to Chrome, live reload is enabled by default.
-
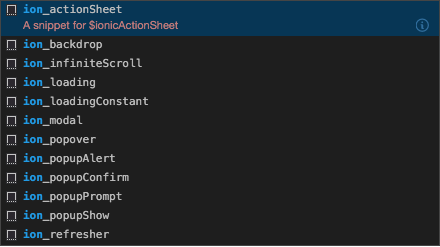
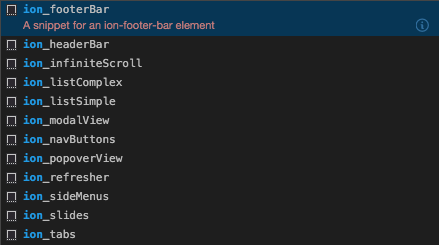
We've included a number of useful JavaScript and HTML code snippets for your project, try typing
ion_in the editor to see what's available.
-
New Ionic commands have also been added to the Command Palette, type
Ionicin the palette to see the full list. -
Ionic live reload is supported on devices and emulators.
-
Additional IntelliSense has been added for Ionic, Angular and JQuery.
You can now launch and debug your Electron application using the Debug on Electron configuration. This requires Electron to be installed in your project to run its browser. You can install it by running npm install electron.
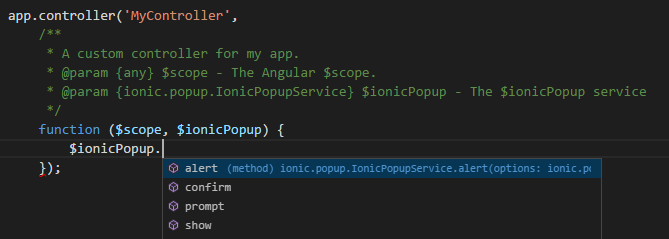
Intellisense helps you discover objects, functions, and parameters in libraries that your project consumes. Now you can use it for the more popularly used core plugins.
IntelliSense appears only for plugins that you've added to your project, but it doesn't matter whether you add the plugin before or after you install this extension.
Just start typing in the code editor to see the objects, functions, and parameters of your plugin's API.
By default, this extension supports the typings for the following plugins. To add typings for other plugins, place the appropriate .d.ts file(s) in your project's .vscode/typings folder.
- cordova-plugin-battery-status
- cordova-plugin-camera
- cordova-plugin-contacts
- cordova-plugin-device
- cordova-plugin-device-motion
- cordova-plugin-device-orientation
- cordova-plugin-dialogs
- cordova-plugin-file
- cordova-plugin-file-transfer
- cordova-plugin-globalization
- cordova-plugin-inappbrowser
- cordova-plugin-media
- cordova-plugin-media-capture
- cordova-plugin-network-information
- cordova-plugin-splashscreen
- cordova-plugin-statusbar
- cordova-plugin-vibration
- cordova-plugin-websql
- cordova-plugin-x-toast
- ionic-plugin-keyboard
- phonegap-plugin-barcodescanner
- phonegap-plugin-push
While IntelliSense is also available for Ionic and Angular, these frameworks use a dependency injection model for built-in services that VSCode's language service cannot understand by default.
To properly enable IntelliSense in these scenarios, you will need to use JSDoc headers.
Our extension will provide the typings for you, so all you have to do is create the JSDoc headers above the functions you wish to receive IntelliSense for.
Note: JSDoc headers may not be supported (for IntelliSense purposes) in old VSCode versions.
For Ionic services, the service type will be in the following format: ionic.[service].Ionic[Service]Service, where [service] and [Service] should be replaced with the service's name, without the $ionic prefix. For example:
@param {ionic.popup.IonicPopupService} $ionicPopup - The $ionicPopup service
@param {ionic.modal.IonicModalService} $ionicModal - The $ionicModal service
For Angular services, the service type will be in the following format: angular.I[Service]Service, where [Service] should be replaced with the capitalized service's name, without the $ prefix. For example:
@param {angular.ITimeoutService} $timeout - The Angular $timeout service
@param {angular.IHttpService} $http - The Angular $http service
For a list of supported services for IntelliSense, see the angular.d.ts and ionic.d.ts typing files, which our extension places by default under .vscode/typings in your project.
VS Code Cordova extension collects usage data and sends it to Microsoft to help improve our products and services. Read our privacy statement to learn more.
If you don’t wish to send usage data to Microsoft, please follow the instructions below to disable its collection.
- Edit VSCodeTelemetrySettings.json file at
%appdata%\vscode-cordovaand add "optIn":false.
- Edit VSCodeTelemetrySettings.json file at
~/.vscode-cordovaand add "optIn":false.
We used ios-webkit-debug-proxy for the iOS debugging. For the tool limitation in chrome-devtools, the iOS debugging is not working on some new iOS version both on real device and simulator. If you have this issue in development, we suggest that you can use safari direct debugging on MacOS. You can get reference here.
Error 'Cannot connect to runtime process, timeout after {0} ms - (reason: {1}).', '{_timeout}', '{_error}' occured while running debug scenarios
Try to increase attach timeout by adding attachTimeout configuration parameter.
It caused by ionic cli bug. As workaround, you can use Node JS v10+.
After running Ionic 4 project on native platform I get white screen in application and error (intermediate value).fill is not a function in Debug Console.
Explanation and solution for it.
I try to attach to Ionic 4 app running with livereload but breakpoints are not being hit or being placed to incorrect positions
Add "ionicLiveReload": true to your attach debug configuration and reattach.


