查看中文文档README_CN
Compared with the traditional architecture model, microservices enjoy advantages on the following aspects:language independence, independent process communication, high decoupling, fixed task boundary and on-demand expansion. It's a perfect tool for internet business which requires fast delivery, quick response and constantly testing. Tech gaints such as Twitter, Netflix, Amazon and eBay are all loyal customers of the mircoservices architecture model.
At present, three mainstream microservice frameworks are named Spring Cloud, Dubbo and API Gateway. Spring Cloud is a set of tools for rapid construction of distributed systems. Thanks to Spring Boot's development convenience, Spring Cloud provides JVM cloud application which could provide a simple way forconfiguration, service discovery, circuit breakers, intelligent routing, micro-agents, control buses, global locks, decision-making campaigns, distributed sessions, cluster state management and many other functions.
Compared to Dubbo and other RPC frameworks, Spring Cloud is a pretty new choice among microservice architecture frameworks. Version 1.0 was released in 2016, integrity of the Spring Cloud's programis very high, sub-projects of the program could cover almost every part of micro-service architecture. Considering its high degree of attention received and frequency of activities, Spring Cloud is likely to become the micro service architecture standard. (Spring Cloud技术分析)
This CloudFramework summarizes the successful experiences of dozens of micro service architecture projects in the past. Combined with a typical case PiggyMetrics (a personal financial management application), Spring Cloud is promised to provide best practices of Microservices Architecture.
-
Beginners can master Spring Cloud and microservices techniques quickly through this project, and open discussions are welcome in this community
-
Developers with preknowledge and relavent backgrounddo not have to start from scratch, you only need to replace some business code to apply the best practice to the production environment and value will be generated immediately
Related CloudFramework: [CloudFrameworks]KONG API Gateway
- Quick Deploy
- Framework details - Business
- Framework details - Components
- Make It Your Own Project
- Production Environment
- Roadmap
- Community & Contribution
One Click deployment with Goodrain Cloudbang
-
Clone code
git clone https://github.com/cloudframeworks-springcloud/PiggyMetrics -
Environment variable configuration
export CONFIG_SERVICE_PASSWORD=root export NOTIFICATION_SERVICE_PASSWORD=root export STATISTICS_SERVICE_PASSWORD=root export ACCOUNT_SERVICE_PASSWORD=root export MONGODB_PASSWORD=root ## MUST -
Run the following command with docker-compose(docker-compose.yml)(or check Deploy via script)
docker-compose -f docker-compose.yml up -d -
Access paths
http://DOCKER-HOST:80 - Gateway
http://DOCKER-HOST:8761 - Eureka Dashboard
http://DOCKER-HOST:9000/hystrix - Hystrix Dashboard
http://DOCKER-HOST:8989 - Turbine stream (source for the Hystrix Dashboard)
http://DOCKER-HOST:15672 - RabbitMq management (default account: guest/default pwd: guest)
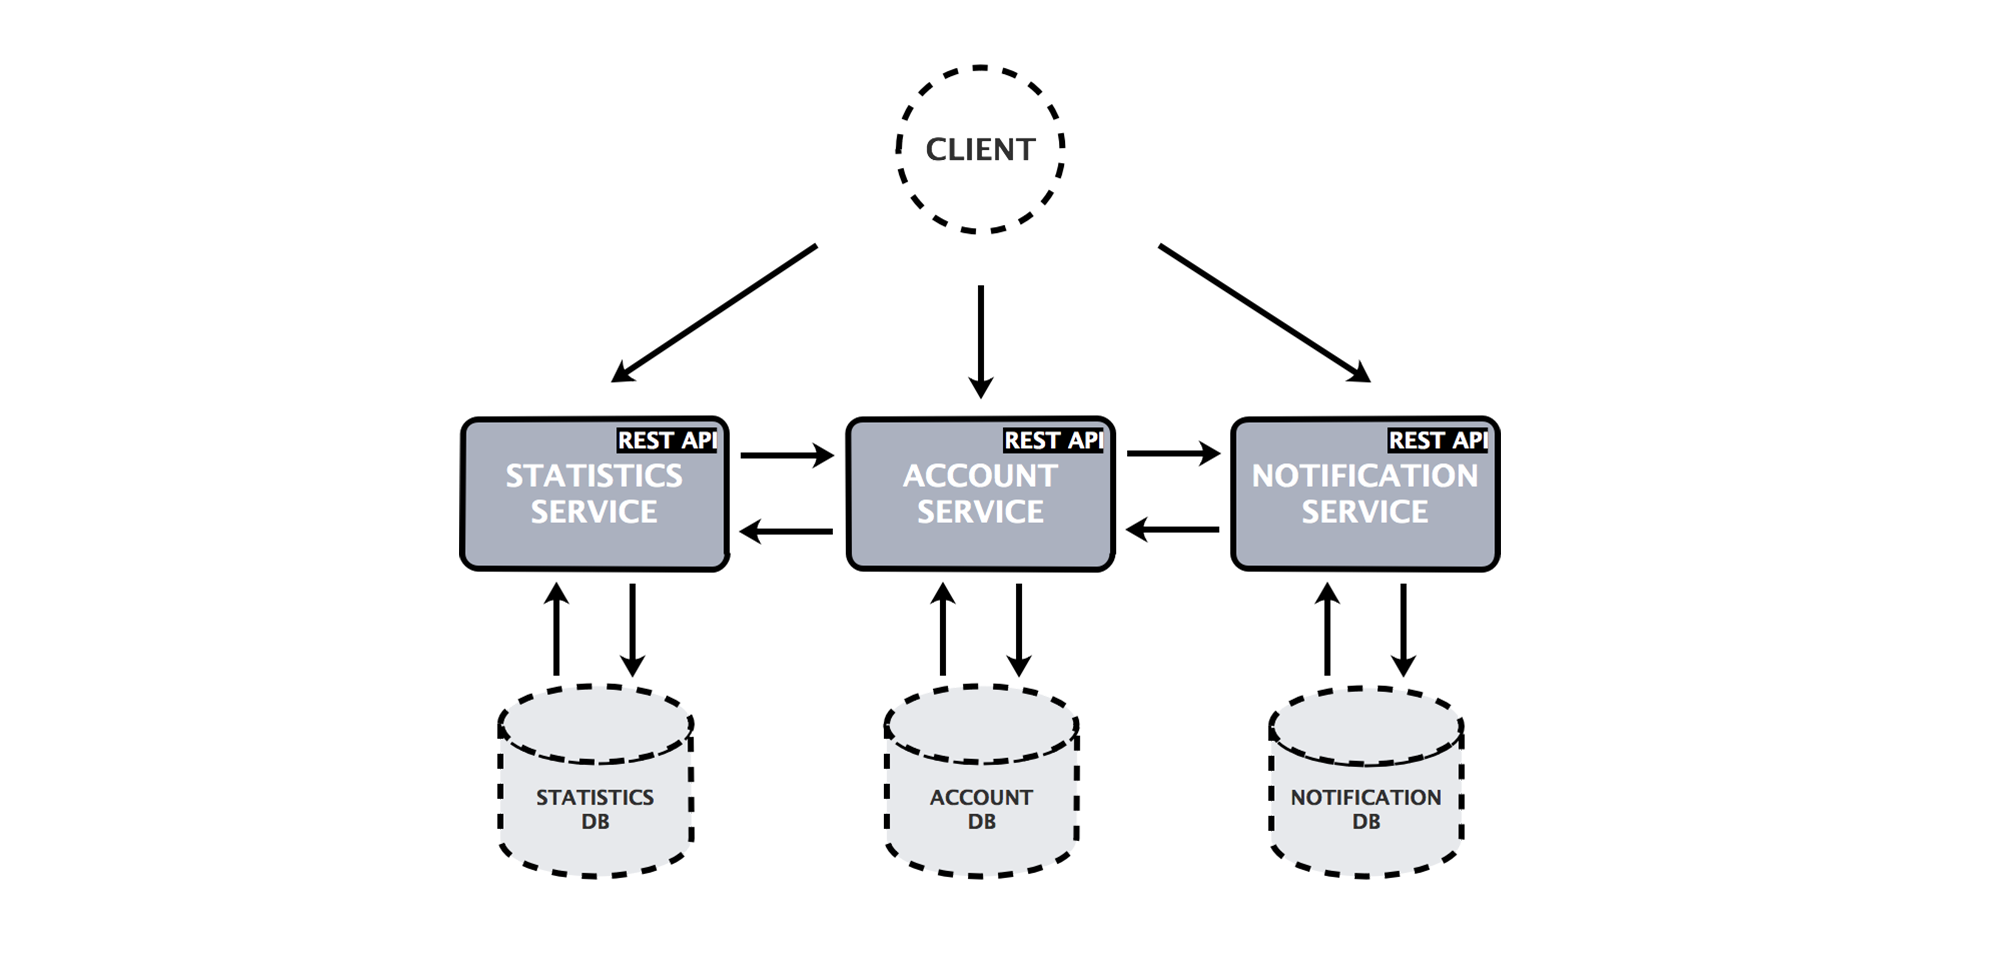
Piggymetrics implement microservices architecture with Spring Cloud, and the application is divided into three micro-services, ACCOUNT SERVICE、STATISTICS SERVICE、NOTIFICATION SERVICE. Each micro-service is an independently deployable application with separate database that is organized around business capabilities, and uses synchronized REST API to communicate between micro-services.
PiggyMetrics's business architecture:
The account service module contains general user input logic and validation: revenue / expense items, savings, and account settings.
| Method | Path | Description | User Authenticated | Available from UI |
|---|---|---|---|---|
| GET | /accounts/{account} | Get specified account data | ||
| GET | /accounts/current | Get current account data | × | × |
| GET | /accounts/demo | Get demo account data (pre-filled incomes/expenses items, etc) | × | |
| PUT | /accounts/current | Save current account data | × | × |
| POST | /accounts/ | Register new account | × |
The statistics service module performs the calculation of the main statistical parameters and captures the time series of each account.
| Method | Path | Description | User Authenticated | Available from UI |
|---|---|---|---|---|
| GET | /statistics/{account} | Get specified account statistics | ||
| GET | /statistics/current | Get current account statistics | × | × |
| GET | /statistics/demo | Get demo account statistics | × | |
| PUT | /statistics/{account} | Create or update time series datapoint for specified account |
The notification service module stores user contact information and notification settings (such as reminders and backup frequencies), and the program staff collects the required information from other services and sends an e-mail to the subscribed customers.
| Method | Path | Description | User Authenticated | Available |
|---|---|---|---|---|
| GET | /notifications/settings/current | Get current account notification settings | × | × |
| PUT | /notifications/settings/current | Save current account notification settings | × | × |
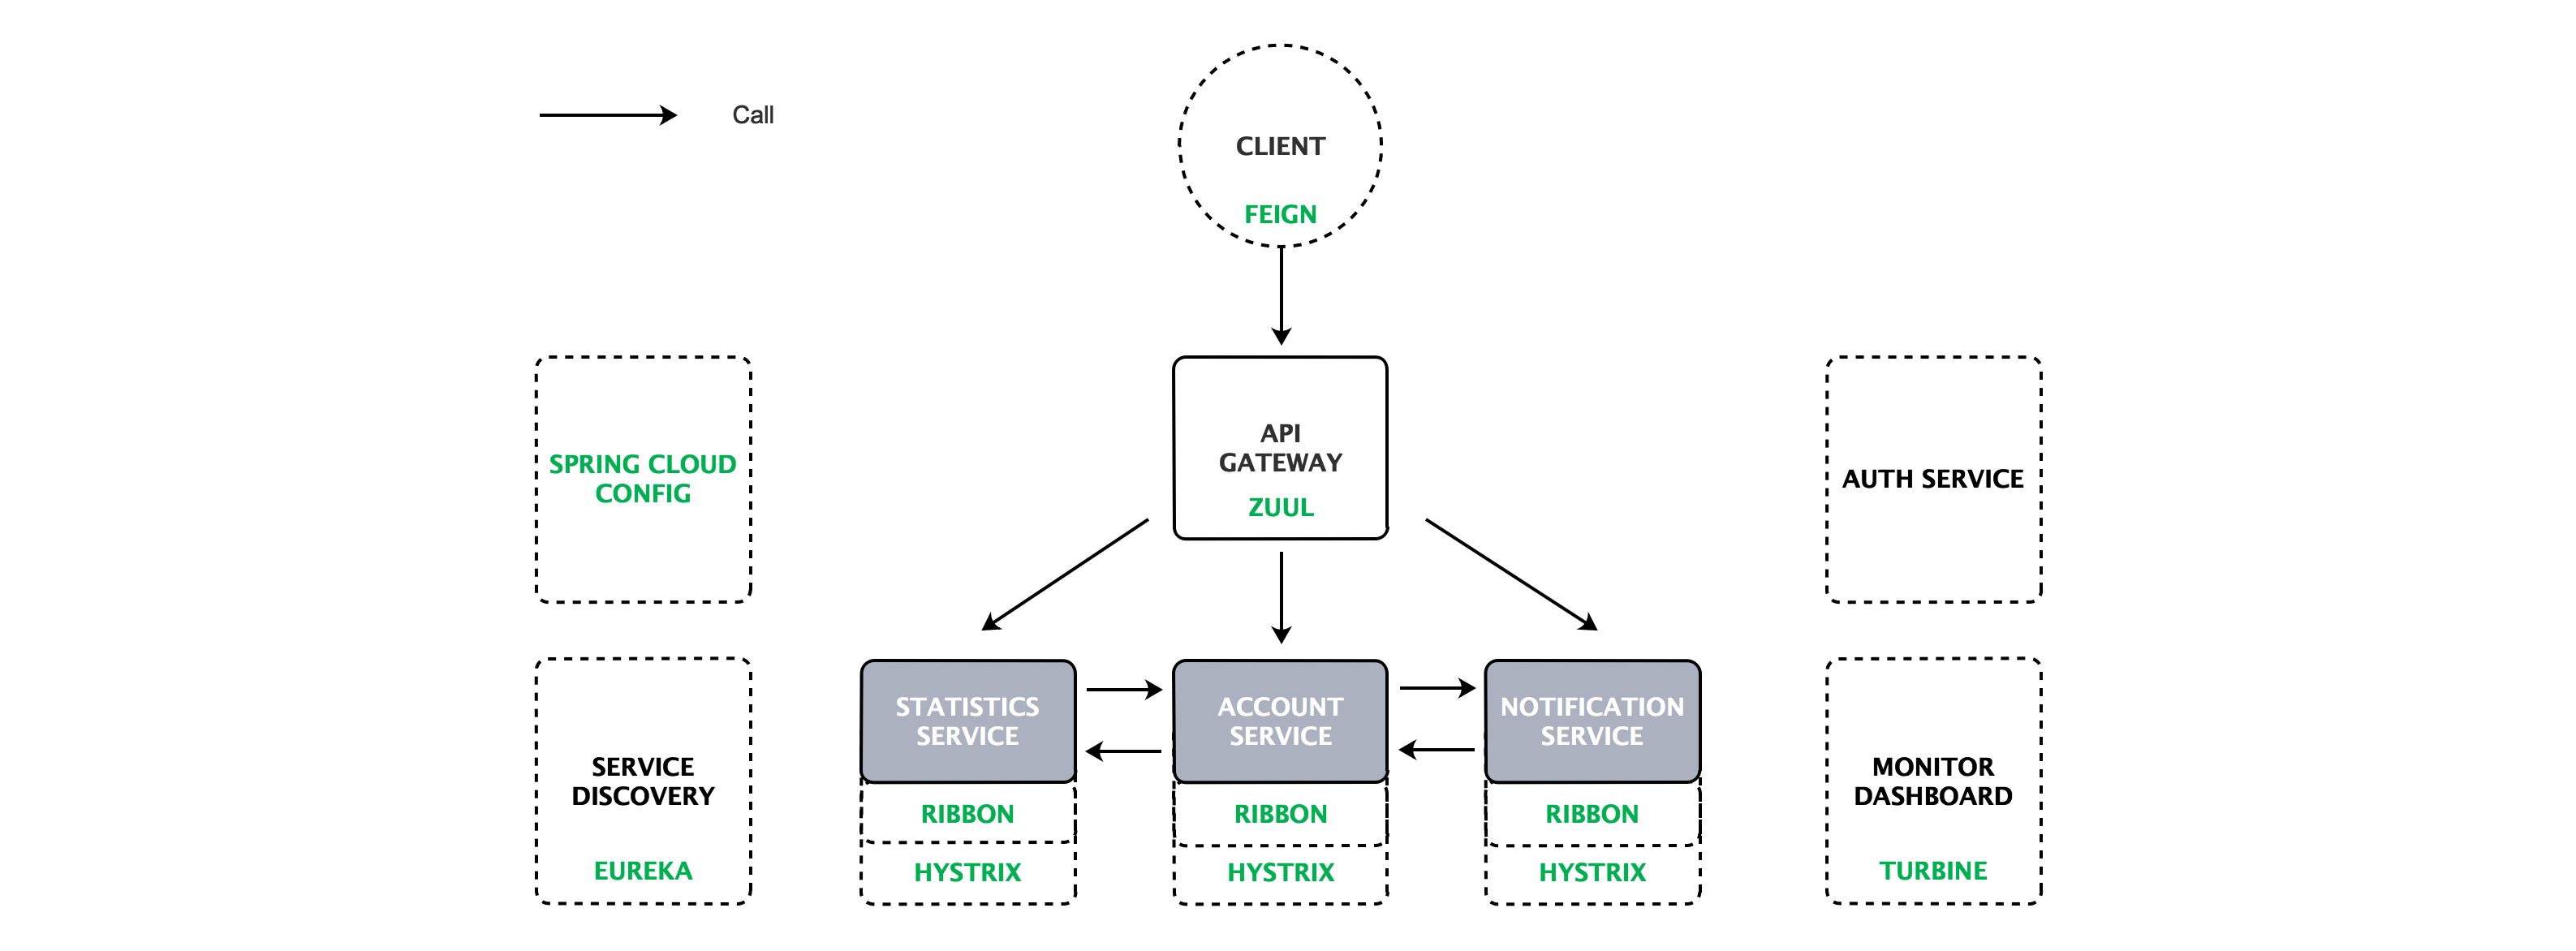
Piggymetrics uses Spring Cloud Config、Netflix Eureka、Netflix Hystrix、Netflix Zuul、Netflix Ribbon、Netflix Feign in its infrastructure service, these are also core components of Spring Cloud distributed development.
Components architecture is shown below:
-
The account service invokes the statistics service and notification service through the remote client (Feign), implements load balancing through the Ribbon, and adds the function of the circuit breaker (Hystrix) during the call;
-
Because the service can be called after the discovery, so account services, statistics services, notification services discover (mutual discovery) each other through the registration center (Eureka);
-
API Gateway (Zuul) provides a unified service gateway, it get corresponding service from the registration center (Eureka), and then call the real business logic according to the service;
-
The service call process unifies all break information through the Turbine;
-
The entire business process of all services in the configuration file through the Spring Cloud Config to manage, such as what port or what parameters to config;
-
The authentication mechanism is implemented through the Auth service to provide basic authentication services.
-
Spring Cloud Config, Eureka, Ribbon, Hystrix, Feign, and Turbine are standard components, and there is no strong relationship between them and business, not related to business code, simply configure to work.
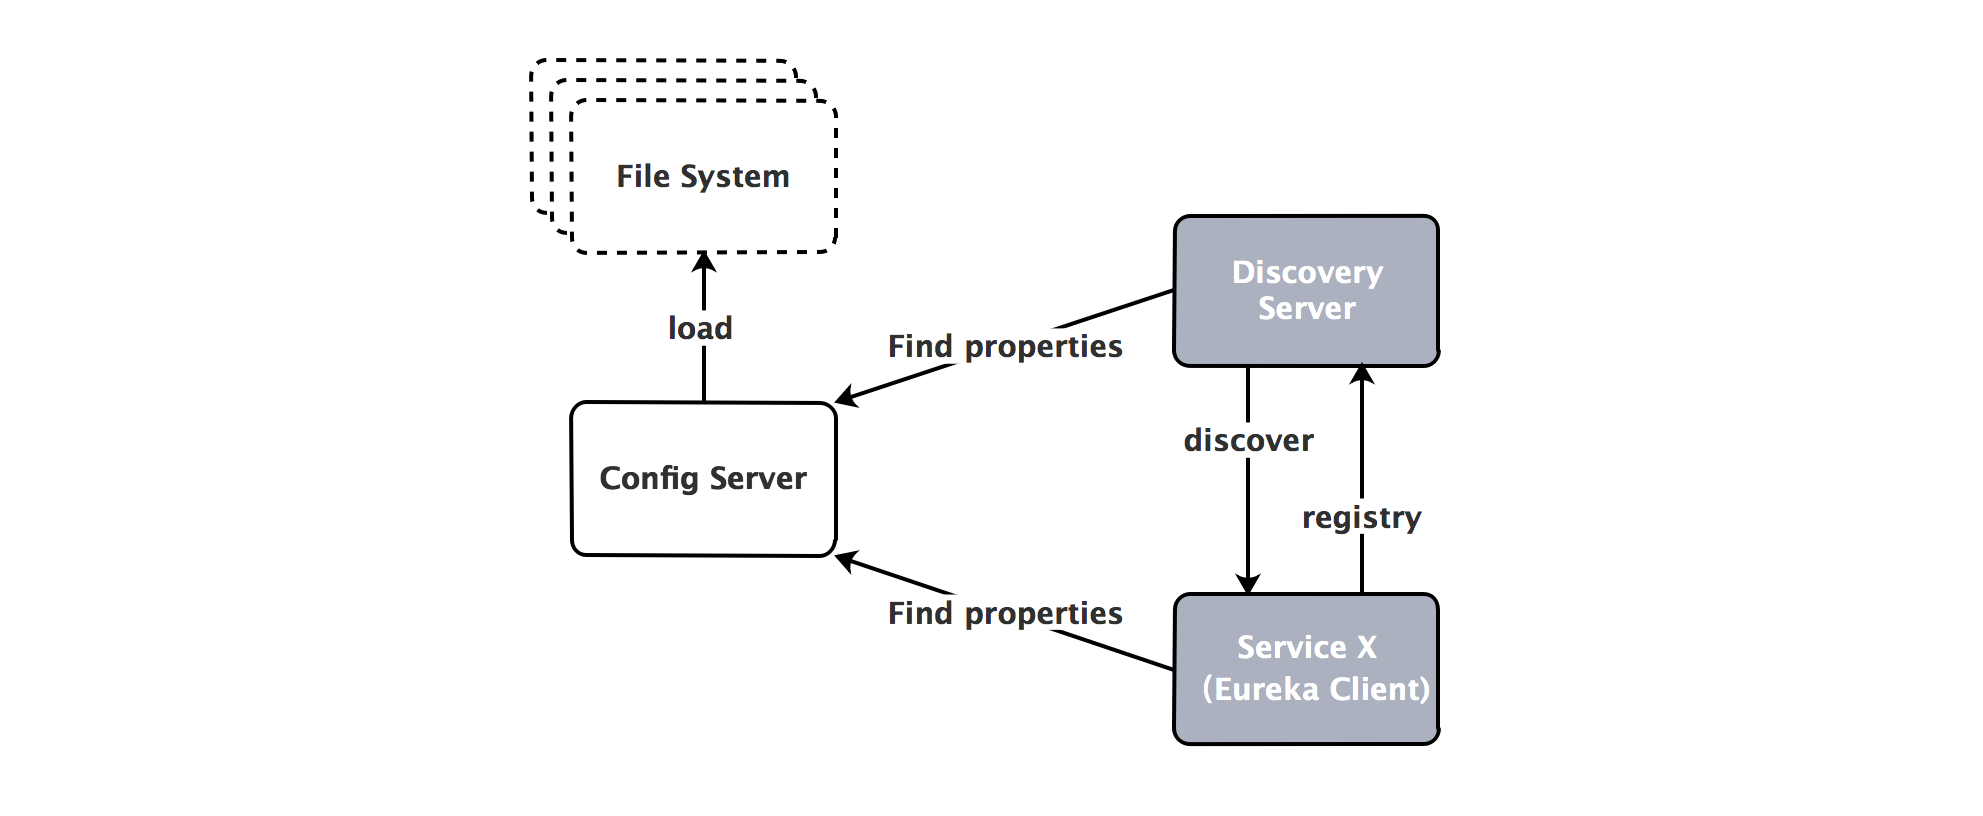
In PiggyMetrics,config_server load configuration file from local classpath:
We can check Shard directory resource in config service, where application.yml is shared by all client applications, for example, when Notification-service request configuration, use shared/notification-service.yml and shared/application.yml to config service responses.
To use Spring Cloud config, we need add spring-cloud-starter-config (it will get configurations from config center automatically) into pom.xml and add following code into the resource directory bootstrap.yml, for example add into monitoring bootstrap.yml:
spring:
  application:
    name: service name
  cloud:
    config:
      uri: http://config:8888
      fail-fast: true
After that, we can refresh configurations through http://DOCKER-HOST:DOCKER-PORT/xxx/refresh (xxx is service root path) without restart.
Read more about Spring Cloud Config
PiggyMetrics uses Eureka server for registy, code logic is simple and standard, we don't need to make any changes, but should be noted to add configuration center service address information into bootstrap.yml.
spring:
 cloud:
   config:
     uri: http://config:8888
     fail-fast: true
     password: ${CONFIG_SERVICE_PASSWORD}
     username: user
Read more about Netflix Eureka
PiggyMetrics implements gateway, proxy authorization service, account service, statistics service and notification service, with Netflix Zuul. The code is simple and standard, no need to make any changes.
In development, replace the corresponding service in GatewayApplication.java.
@EnableZuulProxy        ## add zuul proxy
public class GatewayApplication {
    public static void main(String[] args) {
        SpringApplication.run(GatewayApplication.class, args);
    }
}
Add static in resources directory to restore yout statics resources (html、css、images etc.).
Add proxy service configuration in Zuul's configuration file gateway.yml.
zuul:
ignoredServices: '*'
host:
  connect-timeout-millis: 20000        ## overtime
   ocket-timeout-millis: 20000
routes:
  auth-service:                        ## authroization serive
      path: /uaa/**                    ## mathcing path
      url: http://auth-service:5000    ## service path(http)
      stripPrefix: false               ## with prefix or not
      sensitiveHeaders:
  account-service:
      path: /accounts/**
      serviceId: account-service       ## dynamic search through service ID
      stripPrefix: false
      sensitiveHeaders:
  statistics-service:
      path: /statistics/**
      serviceId: statistics-service
      stripPrefix: false
      sensitiveHeaders:
  notification-service:
      path: /notifications/**
      serviceId: notification-service
      stripPrefix: false
      sensitiveHeaders:
PiggyMetrics does not explicitly define the use of Netflix Ribbon, but in Zuul, Feign and other components use Ribbon implicitly. In actual development, no need to deliberately define the Ribbon.
Read more about Netflix Ribbon
The project defined a unity of circuit breaker mechanism (without code intrusion):
hystrix:
  command:
    default:
      execution:
        isolation:
          thread:
            timeoutInMilliseconds: 10000   ## 10000ms overtime limiting
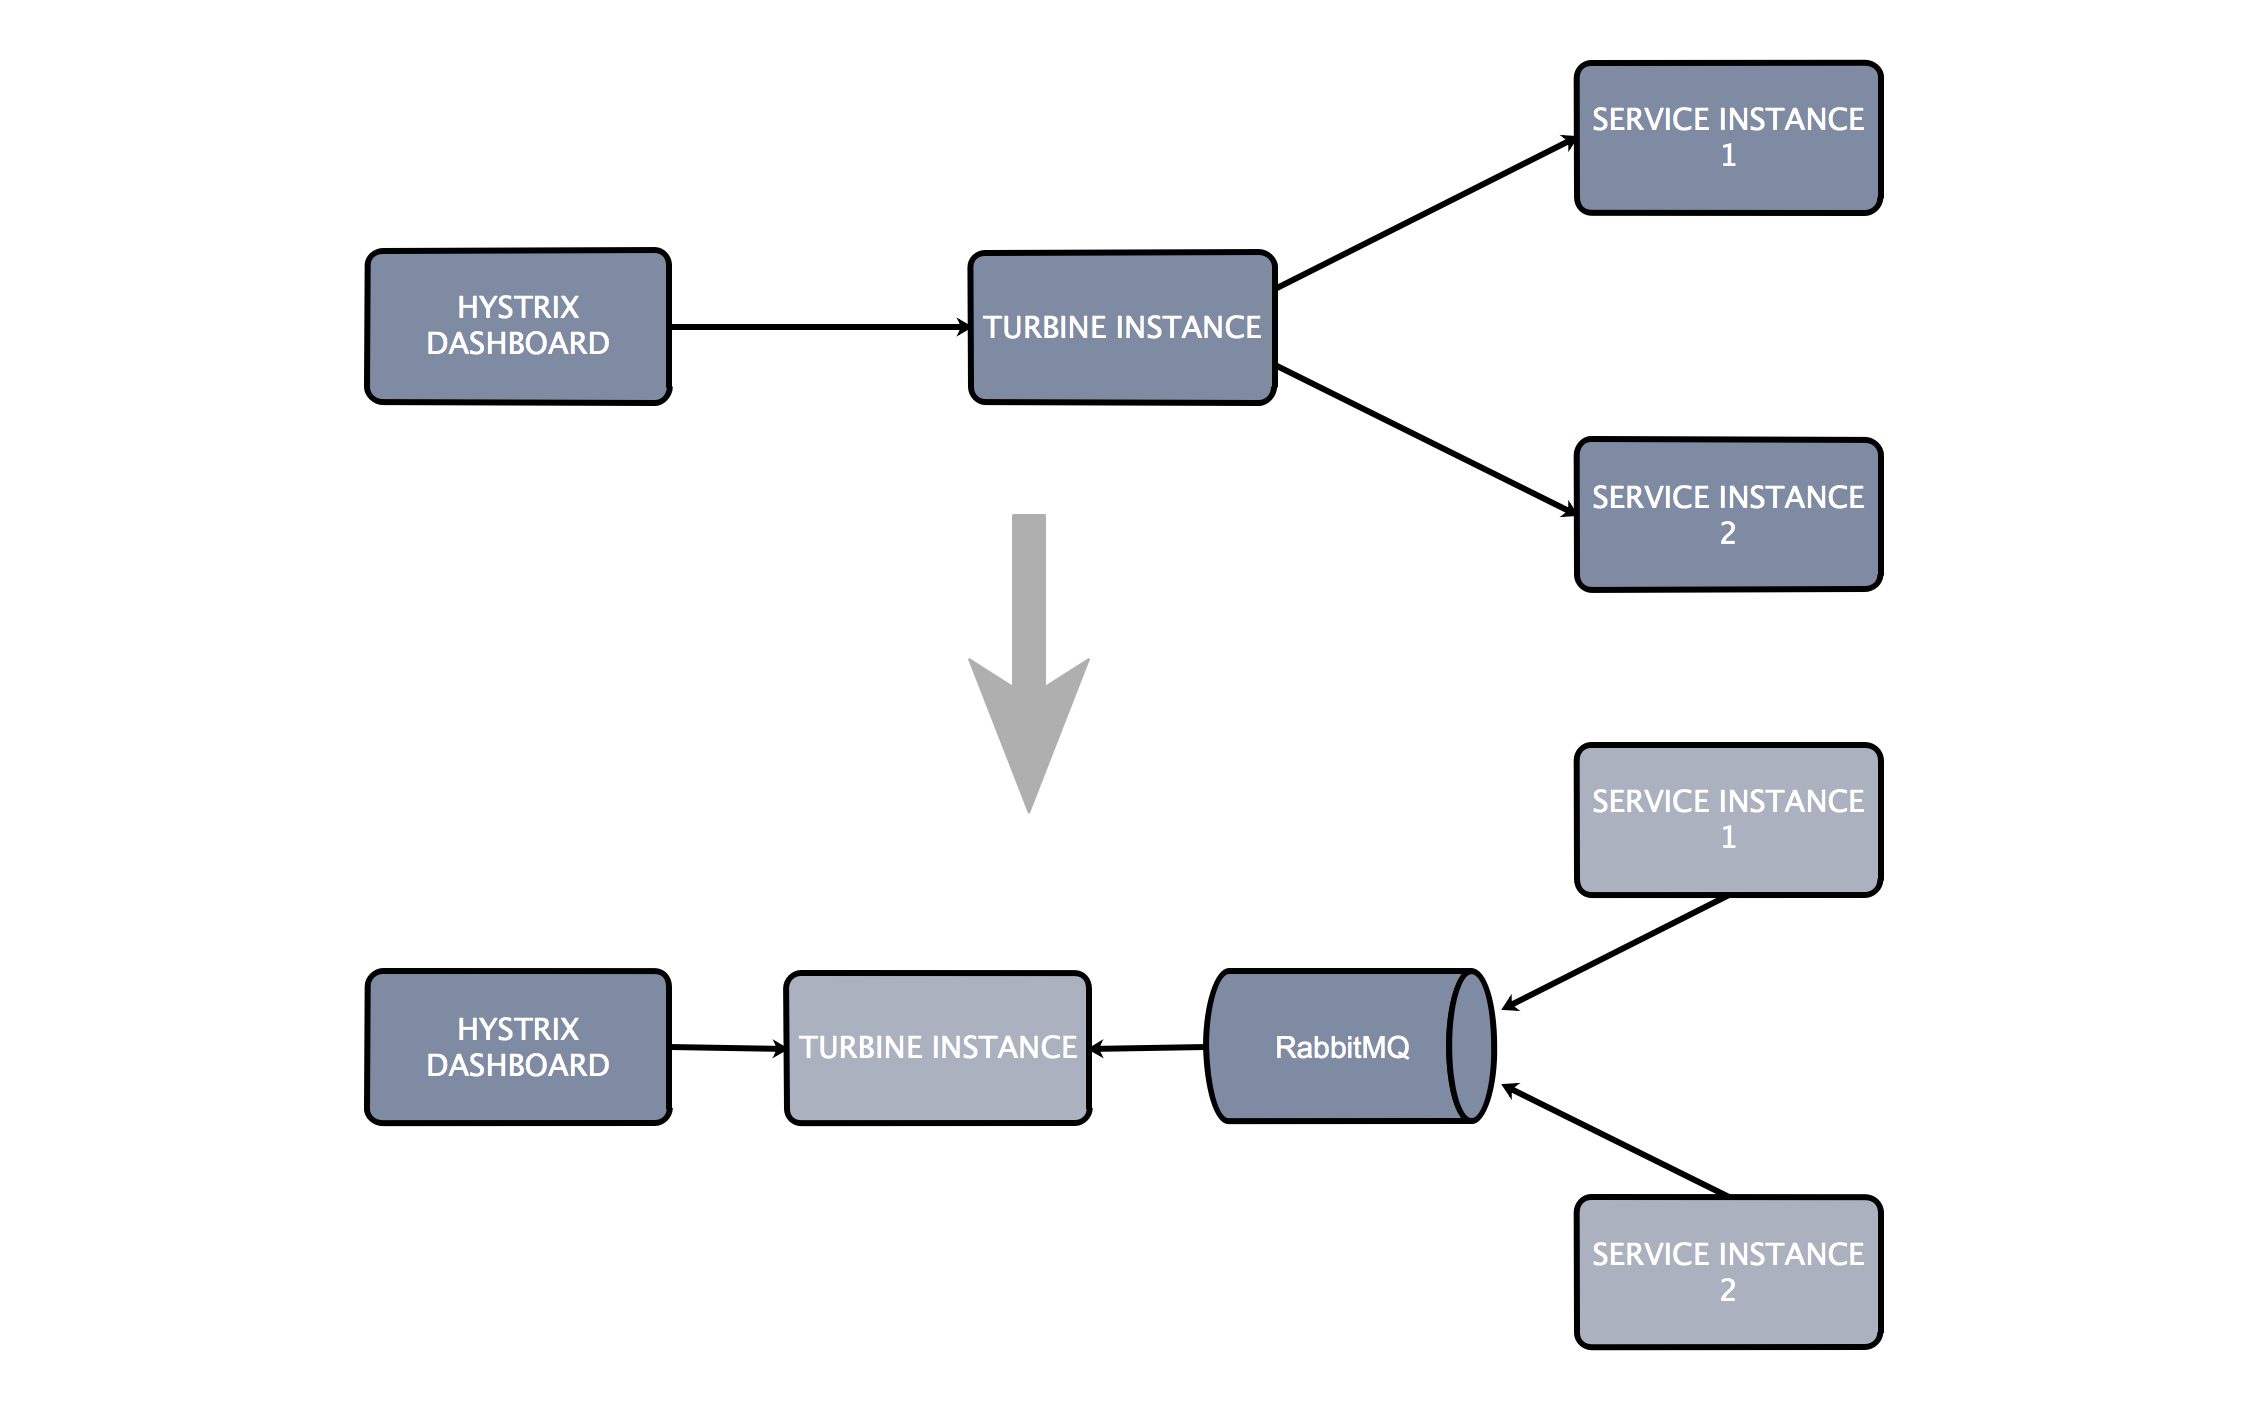
Since Hystrix's monitoring is only for single node, PiggyMetrics monitors the Hystrix metrics situation under the cluster through Netflix Turbine.
Add following code into client, client will be able to push Hystrix command to Turbine, for example /notification-service/pom.xml.
<dependency>
    <groupId>org.springframework.cloud</groupId>
    <artifactId>spring-cloud-netflix-hystrix-stream</artifactId>
</dependency>
Read more about Netflix Hystrix
PiggyMetrics uses Feign many times by adding following code into client, for example StatisticsServiceClient.java.
  @FeignClient(name = "auth-service")      ## declare a client authentication service client, find auth-service through the registry
 public interface AuthServiceClient {

     @RequestMapping(method = RequestMethod.POST, value = "/uaa/users", consumes = MediaType.APPLICATION_JSON_UTF8_VALUE)
     void createUser(User user);

 }
Feign can also appoint external services, for example in statistics module, Feign appointed an ExchangeRatesClient.java.
@FeignClient(url = "${rates.url}", name = "rates-client") ## declare a exchange rate client, based on specific url (can be external service)
public interface ExchangeRatesClient {

    @RequestMapping(method = RequestMethod.GET, value = "/latest")
    ExchangeRatesContainer getRates(@RequestParam("base") Currency base);

}
-
git clone, and create mvn project based on this CloudFramework
-
replace auth-service、account-service、notification-service、statistics-service with your own services
- no need to modify code of config、registry、gateway and monitoring
-
Modify configuration in config, such as service name and port
-
Generate mvn and build image
-
run all images Quick Deploy
The application and services in the production environment need to meet the following basic characteristics:
1. Part of the software, hardware or network anomalies, the application is still able to work reliably
2. Multi-user support and applications continue to work
3. Can add or remove resources to adapt to different needs and changes
4. Easy to deploy and monitor
In other words, in the production environment, we need to consider more and more complex factors to meet the actual business and support business characteristics.
For the micro service architecture, it is recommended to use Docker+Kubernetes PaaS, reasonable structure is as follows:
Container, Docker, and Kubernetes
Kubernetes offers a variety of detailed installation methods, proposed reference:
Service Orchestration is the process of designing, creating and delivering end-to-end services, often discuss with service-oriented architecture, virtualization, configuration, converged infrastructure, dynamic data centers, and so on. The most popular service Orchestration tool is Kubernetes (K8s).
Kubernetes combines the containers that make up the application into logical units for easy management and discovery. It provides resource scheduling, service discovery, operational monitoring, expansion and contraction, load balancing, gray scale upgrade, failure redundancy, disaster recovery, DevOps and a series of options to help achieve large-scale, distributed, Highly available Docker cluster, to solve the business of distributed architecture, service design, a complete definition of the business system to build a standardized architecture layer, that is, Cluster, Node, Pod, Label and a series of abstract are defined, for the service The choreography provides a simple, lightweight way. Kubernetes: a platform for automating deployment, scaling, and operations
Before deploying application on Kubernetes, we need to understand the lifecycle of application.
-
Use Git to manage code version (with Git being distributed, Git vs SVN)
-
Clear the construction rules
-
Use Image or Binary for application package management
-
Make a service deployment rule that includes development, testing, production, and auditing
-
Choose the appropriate release mechanism according to the actual business needs.(gray release, AB test, blue and green deployment, canary deployment)
Deploy PiggyMetrics on Kubernetes
Check PiggyMetrics application architecture
Steps:
-
install Kubernetes and Docker
-
create namespace
kubectl -s 127.0.0.1:8080 create namespace springcloud -
configure containers' DNS (Check dns/dns-addon.yaml)
kubectl -s 127.0.0.1:8080 create -f dns/dns-addon.yaml file --namespace=springcloud -
create services (Check svc/yaml file)
kubectl -s 127.0.0.1:8080 create -f svc/yaml file --namespace=springcloud -
create application deployment (Check deployment/yaml file)
kubectl -s 127.0.0.1:8080 create -f deployment/yaml file --namespace=springcloudRemarks:
127.0.0.1:8080----kubernetes api server
svc/yaml file----svc deploy yaml file
deployment/yaml file----deployment deploy yaml file
In the production environment, services read configuration file from the configuration center, and the configuration center reads the configuration file from Gitlab, making the configuration center a clustered microservice to achieve high availability and meet the needs of a large number of services.
The structure is as follows:
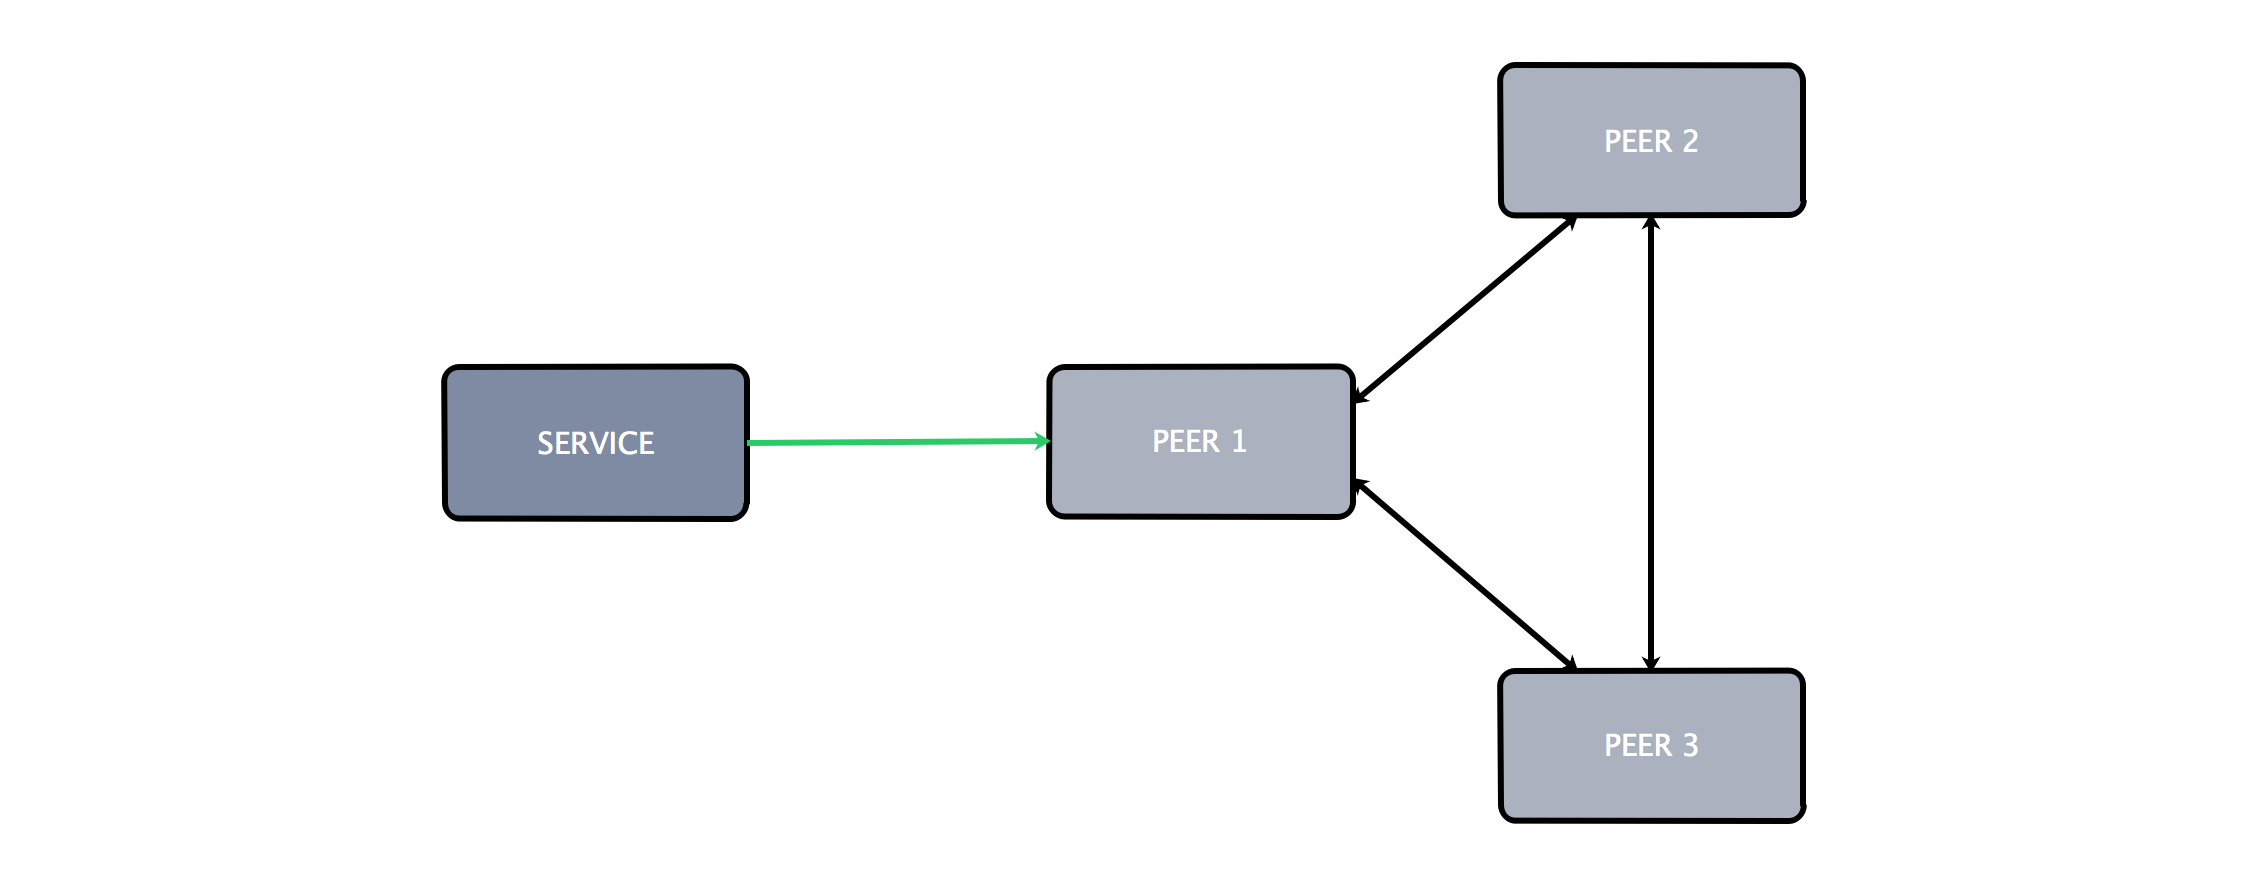
In the production environment, service registration discovery management is carried out using Eureka Server, and three peer nodes are used to register both for high availability.
The structure is as follows:
Implement circuit breaker with Hystrix, and get graphical dispaly with Hystrix Dashboard, and use RabbitMQ to change the default "pull" into MQ message queue through the "push" mode to ensure simple structure and real-time efficiency.
The structure is as follows:
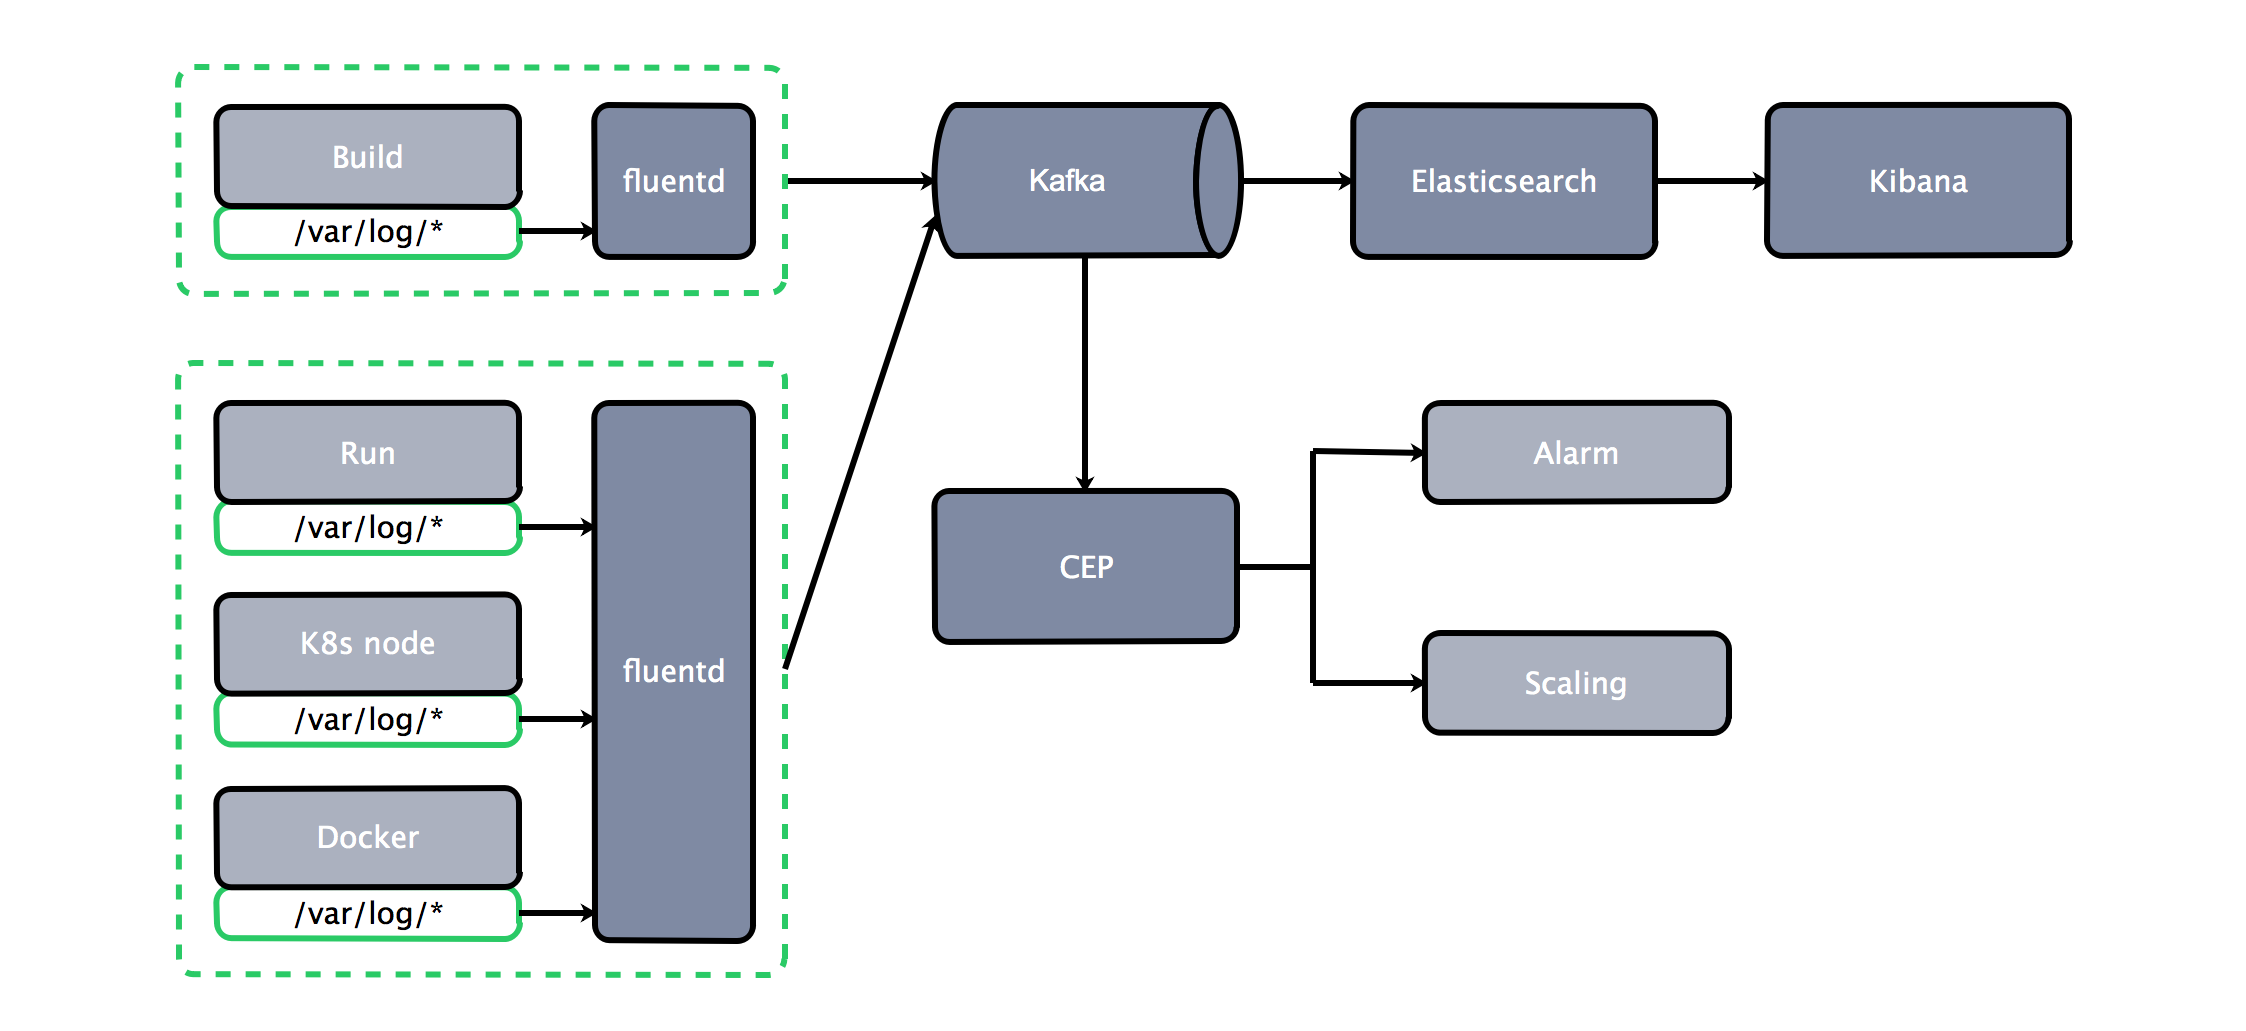
Logs are collected and displayed via EFKA (elasticsearch fluentd kibana kafka) in production environment.
The structure is as follows:
Get log infomations through the real-time log collection system, and use time window technology for log analysis.
The structure is as follows:
In production environment, follow the following tips to do performance optimization:
1、configuration center optimization
eureka:
  instance:
    prefer-ip-address: true
  client:
    registerWithEureka: false
    fetchRegistry: false
    server:
      waitTimeInMsWhenSyncEmpty: 0
  server
    eviction-interval-timer-in-ms: 4000
    enableSelfPreservation: false
    renewalPercentThreshold: 0.9
2、zuul configuration optimization
ribbon:
  ReadTimeout: 20000
  ConnectTimeout: 20000
  MaxAutoRetries: 1

zuul:
  host:
    connect-timeout-millis: 20000
    socket-timeout-millis: 20000
3、Feign configuration optimization
#request and response GZIP compress
feign.compression.request.enabled=true
feign.compression.response.enabled=true
#compress supportive mime types
feign.compression.request.enabled=true
feign.compression.request.mime-types=text/xml,application/xml,application/json
feign.compression.request.min-request-size=2048
READMEadd related information linksComponentadd detailed information for componentsFAQadd questions and answers
- QQ GROUP: 531980120
- CONTRIBUTING
- CONTACT US
A CloudFrameworks project, released under the APACHE LICENSE 2.0


