The Wind Turbine Planner is a React-based application designed to help plan maintenance activities for wind turbines by leveraging real-time wind data. The application fetches and displays wind speed, direction, and other weather-related metrics for the next two days. Users can input the coordinates of their turbines and visualize the data through intuitive charts, tables, and interactive maps.
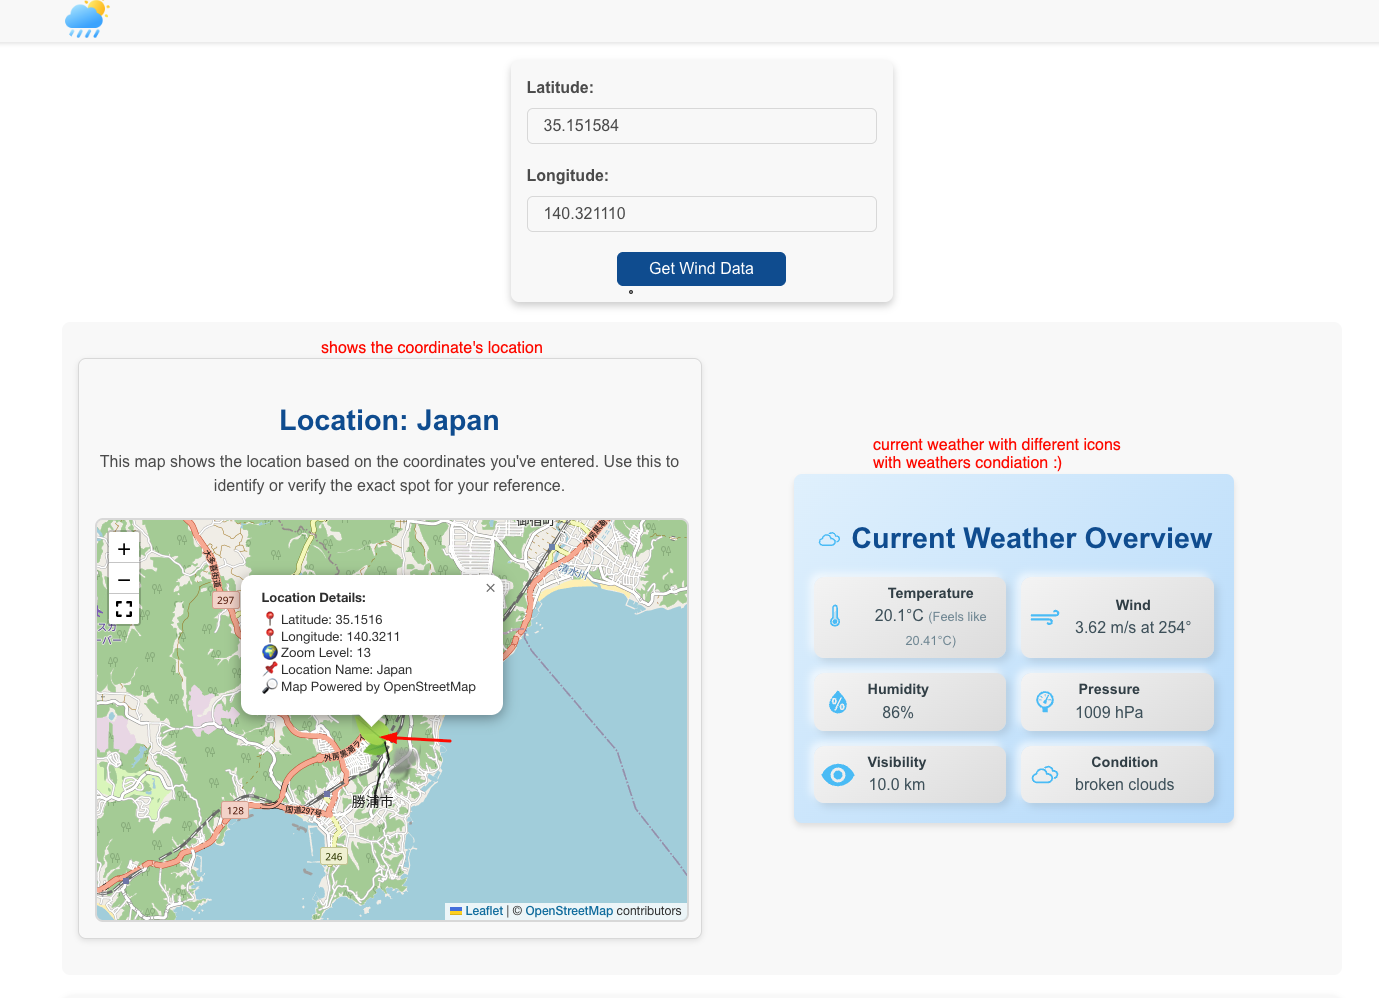
screen shorts and the example of the App.
This is how input form.
This is how map and weather data is shown.
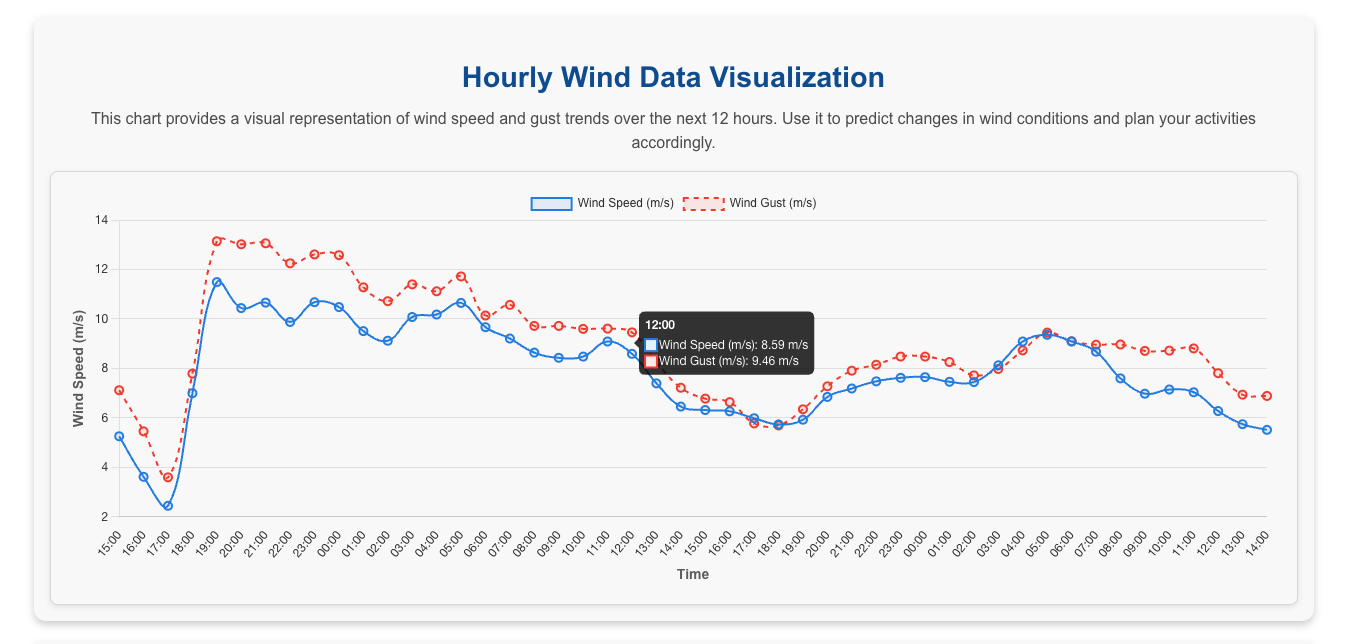
This is how our wind chart is shown.
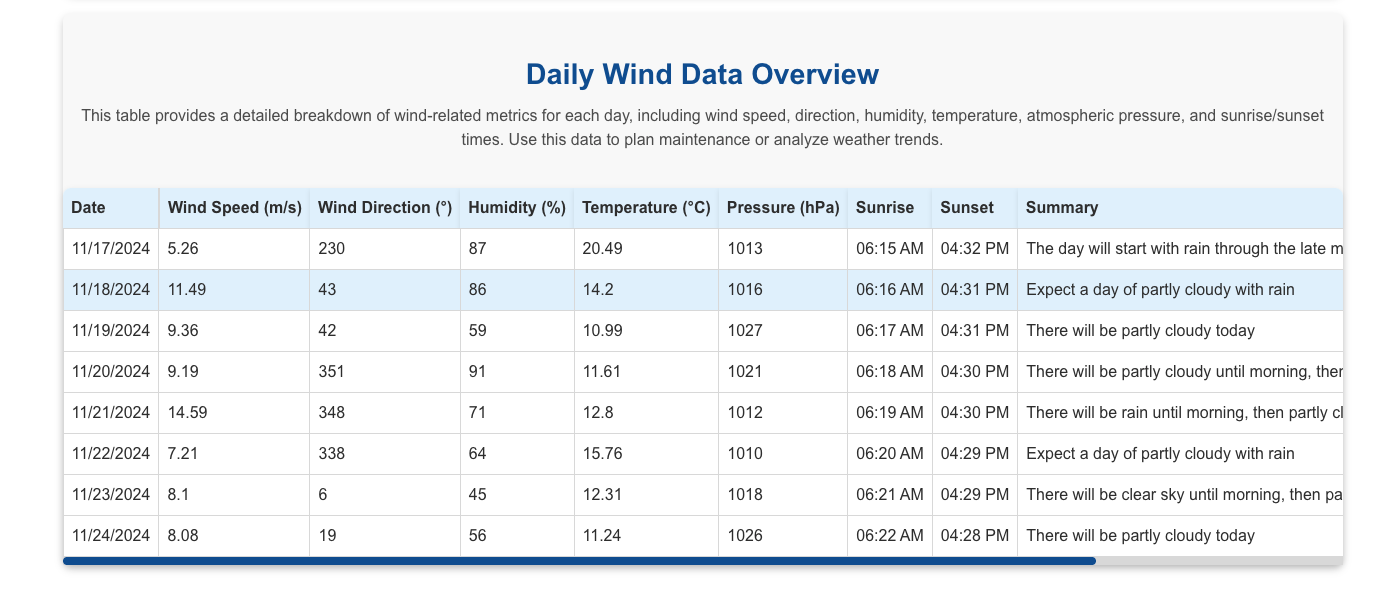
This is how our wind data is shown.
-
Live Wind Data:
- Fetches real-time weather data, including wind speed, direction, humidity, pressure, and visibility.
- Displays forecasts for hourly and daily wind conditions using the OpenWeatherMap API.
-
User-Friendly Data Display:
- Charts: Visualizes hourly wind speed and gust trends with interactive and responsive line charts.
- Tables: Provides detailed daily metrics, such as wind speed, direction, humidity, temperature, and pressure etc.
- Weather Summary: Displays a compact summary of current weather conditions for the selected coordinates.
-
Turbine Coordinates Input:
- Intuitive form for entering turbine coordinates (latitude and longitude).
- Real-time validation ensures users enter valid latitude (
-90 to 90) and longitude (-180 to 180).
-
Interactive Map:
- Displays the turbine's location on a dynamic map using Leaflet.
- Includes reverse geocoding to fetch the nearest location name based on coordinates.
- Features zoom controls and full-screen map view for a better user experience.
-
Error Handling:
- Gracefully handles API errors with user-friendly error messages.
- Provides instant feedback for invalid coordinate inputs.
-
Responsive UI:
- Optimized for both desktop and mobile devices.
- Ensures smooth interaction and visual clarity across varying screen sizes.
-
Build and Deployment:
- Ready to deploy application with a simple build process using Vite.
- Modular codebase with TypeScript and linting ensures high-quality and maintainable code.
-
Accessibility:
- Uses semantic HTML and ARIA roles for enhanced accessibility.
- Tables and charts are designed to be screen-reader-friendly.
- 🖥️ Frontend: React (with TypeScript and SWC for fast builds)
- 🎨 Styling: SCSS module for styling (future we can add tailwind or something else if needed)
- 📊 Data Visualization: Chart.js (via
react-chartjs-2) for interactive charts - 🗺️ Maps: Leaflet and React-Leaflet for interactive maps
- ✅ Validation: Zod for real-time input validation
- 🌐 HTTP Client: Axios for API communication
- 🌥️ API: OpenWeatherMap API (One Call 3.0) for live weather data
- ⚡ Build Tool: Vite for a fast and efficient build process
- Node.js (v16+ recommended)
- An API key from OpenWeatherMap (sign up for a free tier).
-
Clone the repository:
git clone https://github.com/Milan-960/Wind-turbine-solutions.git cd wind-turbine-planner -
Install dependencies:
npm install
-
Add your OpenWeatherMap API key:
- Create a .env file in the project root.
- Add the following line:
OPENWEATHER_API_KEY=your_api_key_here
-
Start the development server:
npm run dev #OR npm start -
Open the app in your browser at http://localhost:3000.
- npm run dev: Start the development server.
- npm run build: Build the application for production.
- npm run preview: Preview the production build locally.
- npm run lint: Run ESLint to check for code quality issues.
-
The application uses the One Call 3.0 API from OpenWeatherMap:
- Endpoint: https://api.openweathermap.org/data/3.0/onecall
- Required Parameters:
- lat: Latitude of the location
- lon: Longitude of the location
- exclude: Data blocks to exclude (e.g., minutely,alerts)
- units: Units of measurement (metric for °C, m/s)
- appid: Your API key
- Response: JSON with weather data (current, hourly, daily).
- Add caching for API responses to reduce redundant network requests. consider using tanstack/react-query.
- Add additional visualizations (e.g., heatmaps).
- Add darkmode, lung support, dashboard, login, sign up and many more..
- Support for multiple turbine locations with a saved list feature.
- Enhance Map Interaction:
- Allow users to click on the map to select coordinates.
- Use memoization (React.memo) for components like WindChart to avoid unnecessary re-renders.
- Implement unit tests for critical components and hooks.
In case of if the javascript is disable on the users browser we show this message check this out on the below IMG:
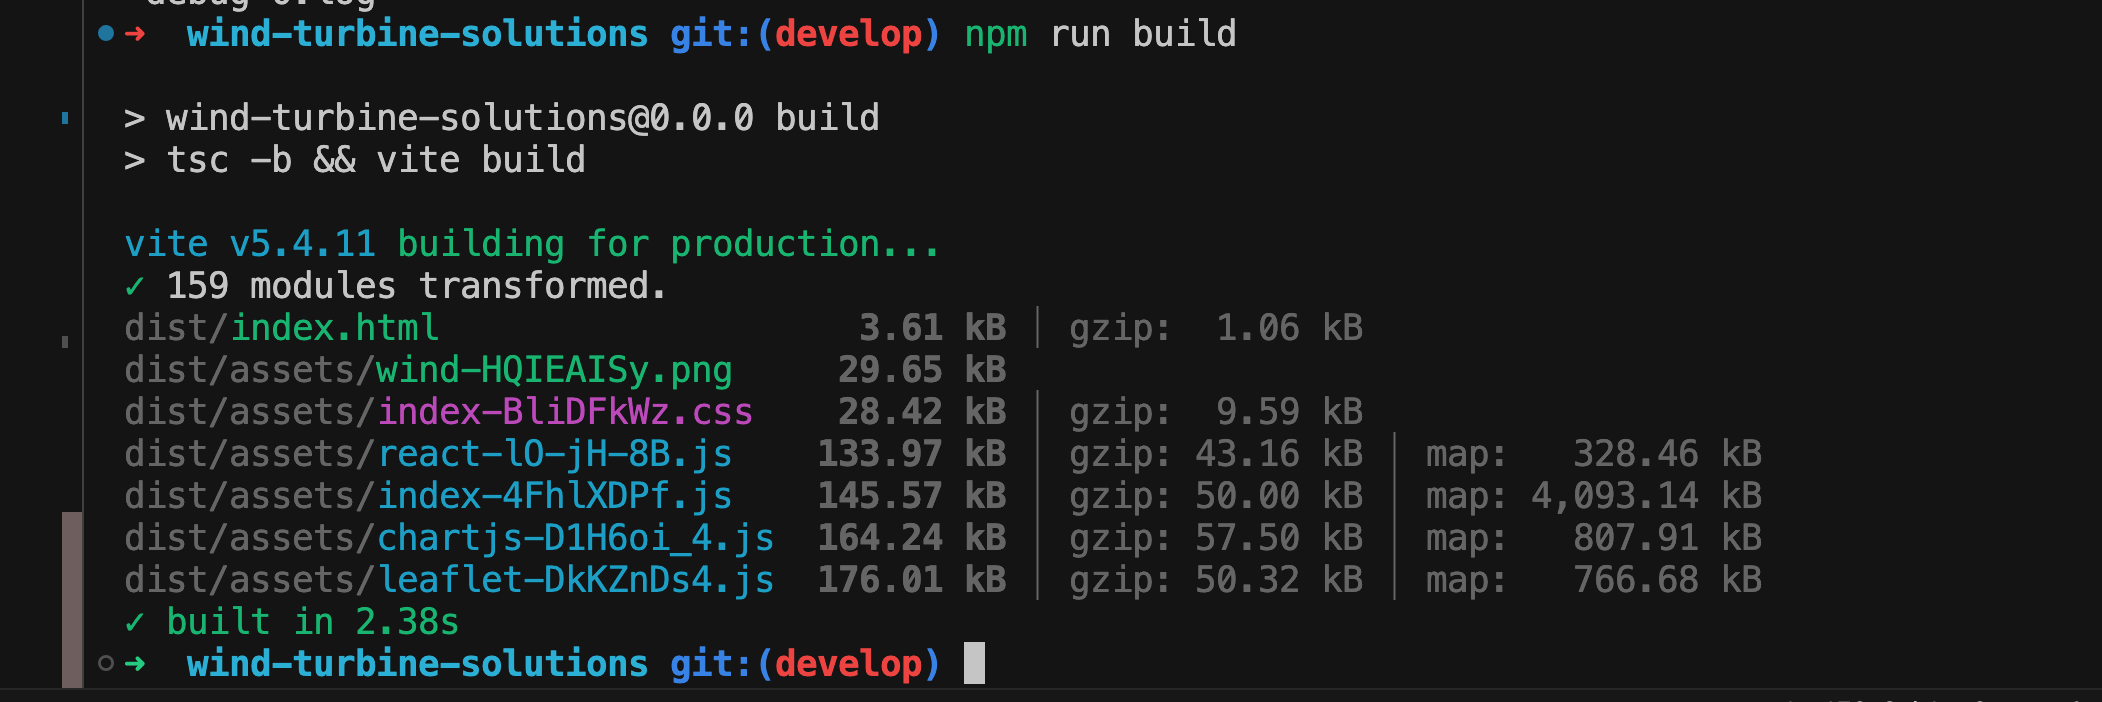
This img shows the build time of the application in small chunks:


