Fastgrind is a head-only, lightweight, fast, thread safe, valgrind-like memory profiler designed for runtime memory allocation tracking and call stack analysis in C++ applications. Fastgrind provides comprehensive memory usage insights through both automatic and manual instrumentation approaches.
fastgrind/
├── include/fastgrind.h           # Core code (head only)
|
├── demo/
│   ├── manual_instrument/        # Manual instrumentation demos
│   ├── auto_instrument/          # Automatic instrumentation demos
|   └── build_all_demo.sh         # Build all individual demo
|
├── testcase/
│   ├── benchmark_box_grouping/   # Performance benchmarking
│   ├── cpp_feature_test/         # Modern C++ feature test
│   ├── glibc_je_tc_availabe/     # Allocator compatibility test
│   ├── multi_pkg_compile/        # Multi-package compilation test
|   ├── thirdparty_leveldb_test/  # Third-party open source library test (https://github.com/google/leveldb)
|   └── thirdparty_zlib_test      # Third-party open source library test (https://zlib.net)
|
├── doc/
|   ├── compile.md                # Description of integrate and compile
|   ├── demo.md                   # Description of demo
|   ├── feature_list.md           # Description of fastgrind's feature
|   ├── querstion_list.md         # Description of problems and solutions in using fastgrind
|   └── testcase.md               # Description of testcase
|
├── tools/fastgrind.py            # Visualize utilities (python fastgrind.py fastgrind.json)
|
├── CMakeList.txt                 # Top Cmake for testcase
├── Doxyfile                      # Doxyfile to generate manual
└── README.md                     # Description of repository
mkdir build && cd build
cmake ..
make -j$(nproc)cd build/testcase/benchmark_box_grouping
./benchmark_raw
./benchmark_fastgrind
./run_valgrind.sh
cd build/testcase/cpp_feature_test
./cpp_feature_test
...
cd build/testcase/multi_pkg_compile
./multi_pkg_mainTwo report file will be generated when program exits
[FASTGRIND] Start summary memory info
[FASTGRIND] saved: fastgrind.text (size=2335 bytes)
[FASTGRIND] saved: fastgrind.json (size=65952 bytes)
For more file detail, please check: Output and Analysis
Additional compile flags are needed in manual or auto instrumentation
For detail compile & link options, please check: doc/compile.md
#include "fastgrind.h"

using namespace __FASTGRIND__;

void processData() {
    FAST_GRIND;                       // Enable call stack tracking for this function

    int* data = new int[1000];
    // ... process data ...
    delete[] data;
}

int main() {
    FAST_GRIND;                       // Enable call stack tracking for this function
    processData();
    return 0;
}Include fastgrind.h in any one of source code, and with compile options, All functions outside the exclude file are automatically instrumented
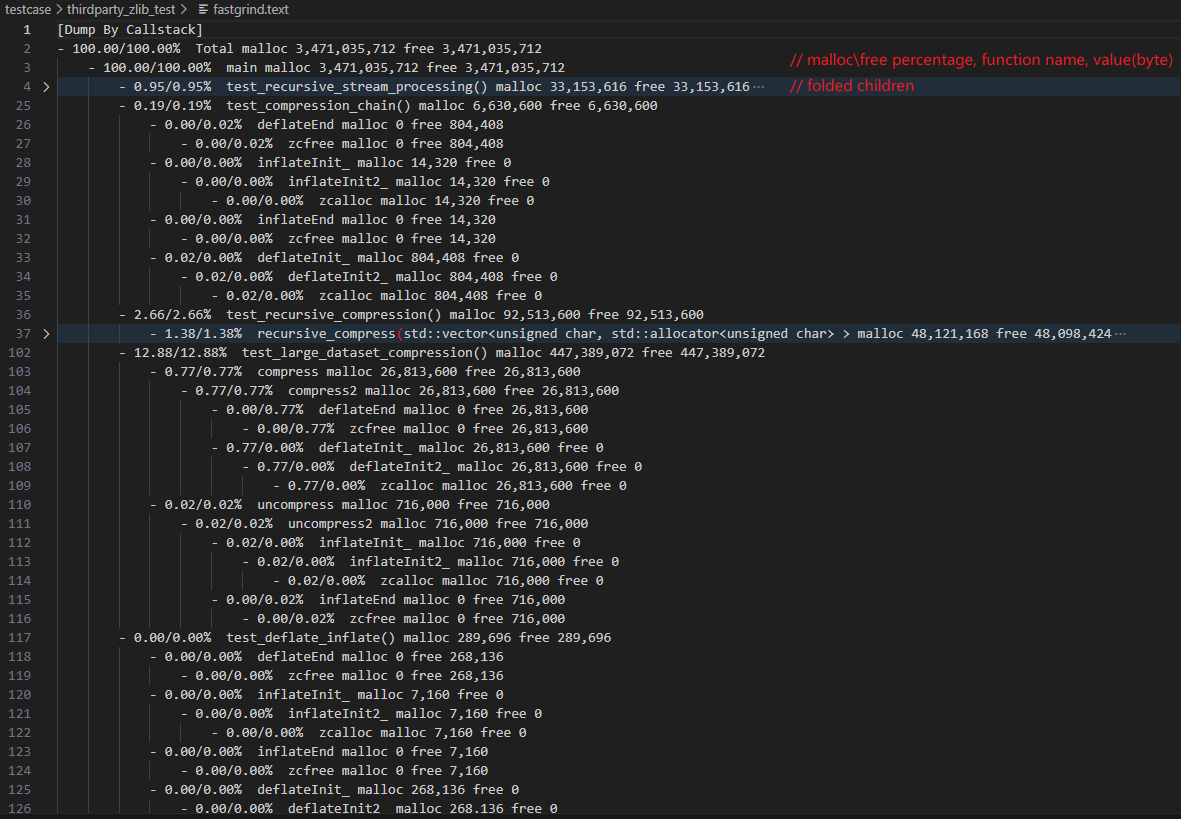
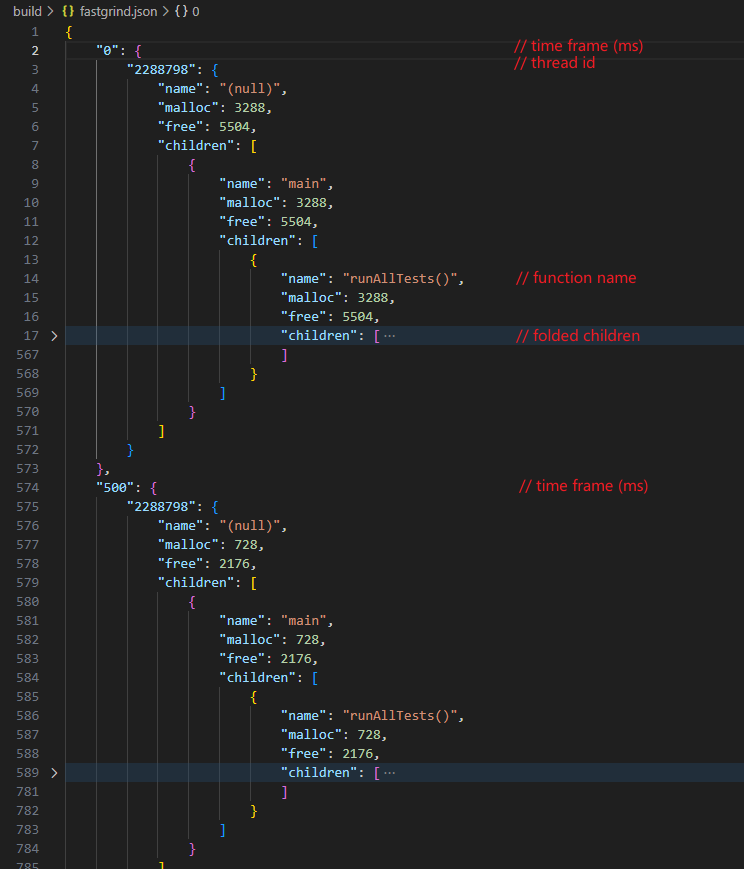
When a Fastgrind-instrumented application exits, two files are automatically generated: fastgrind.text and fastgrind.json
This is a linux perf like report
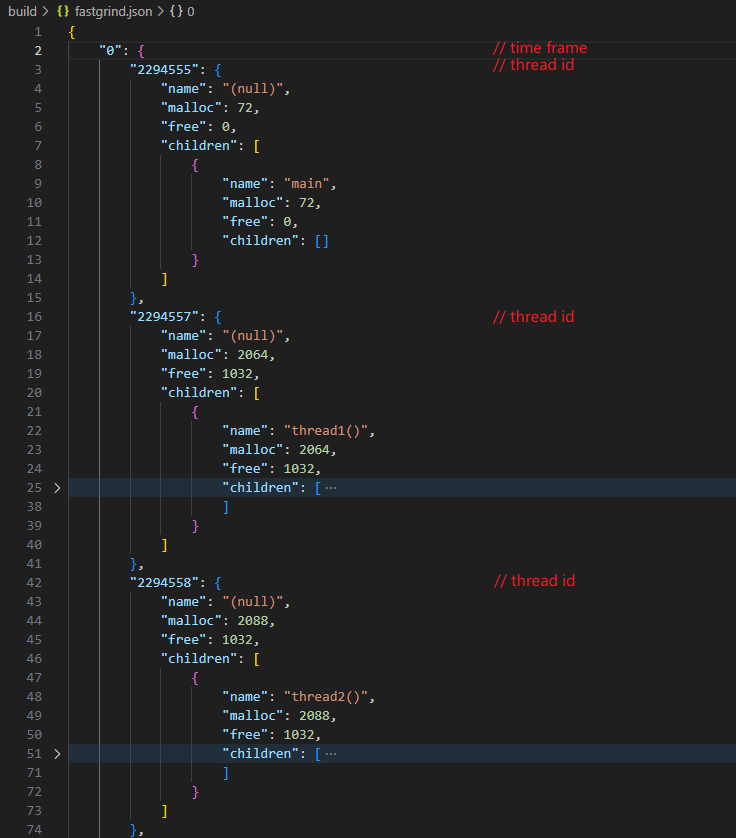
Structured JSON format containing:
- Time-sliced memory usage statistics
- Per-thread memory allocation details
- Complete call stack information
- Function-level allocation breakdown
Per-time frame, per-thread, per function recorder:
- Single thread
- Multi thread
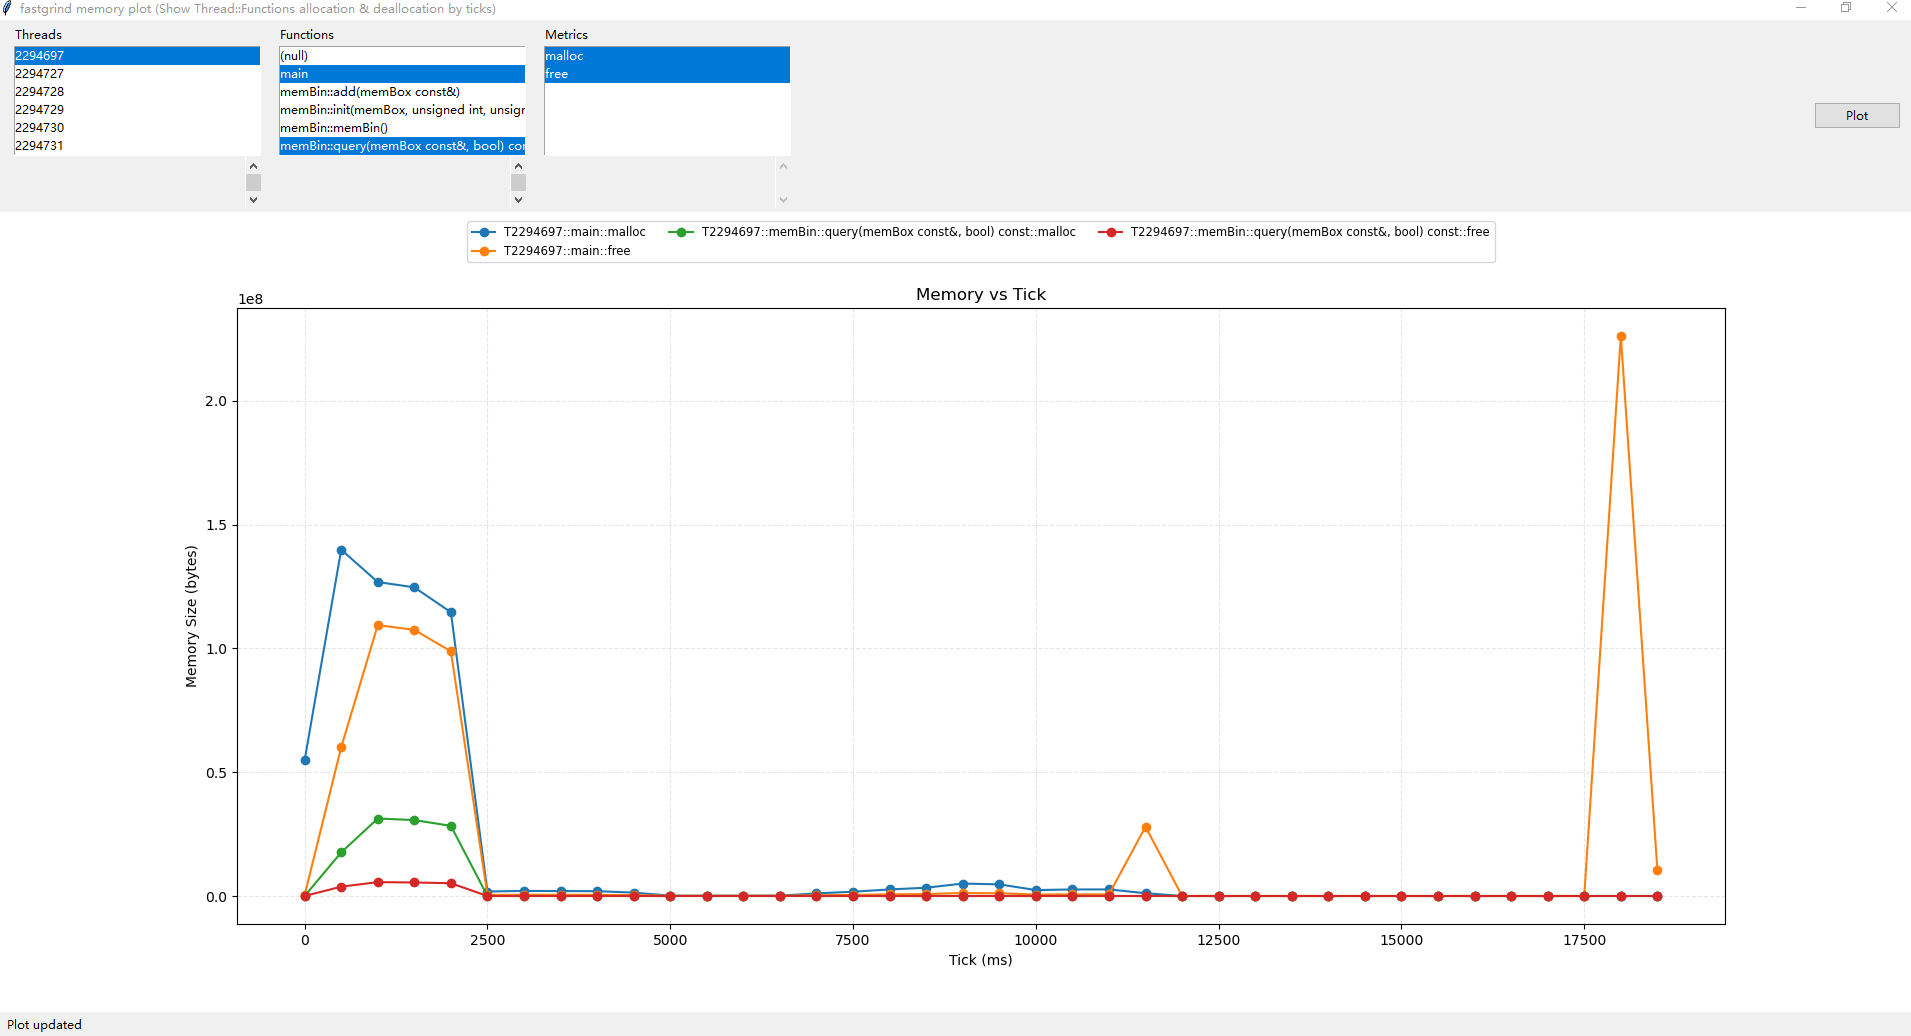
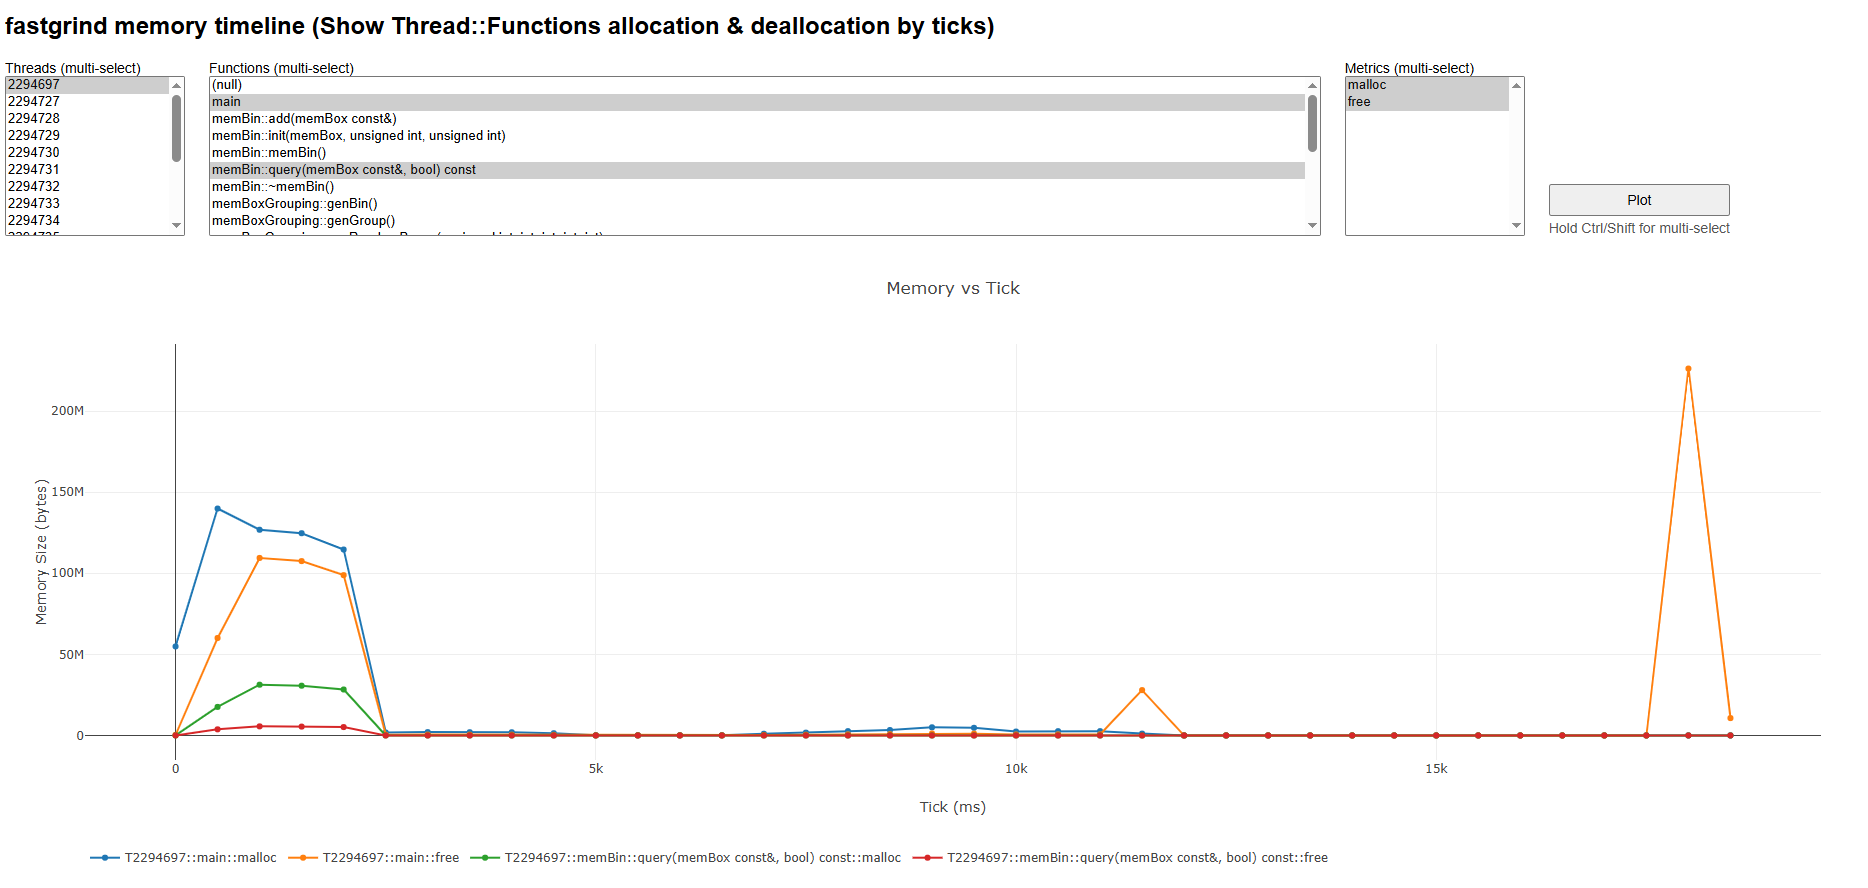
Use tools/fastgrind.py to generate interactive visual line chart
It will call matplotlib to draw line chart, and generate fastgrind.html in case without matplotlib
Use web browser to open fastgrind.html can get same line chart as matplotlib
Usage
python fastgrind.py fastgrind.json
or
python fastgrind.py # auto search fastgrind.json in current folder- matplot
- html
- Cross-Frame Allocation: Memory allocated in one function and freed in another will be recorded truthfully, resulting in those function stack frames freed less or more then allocated.
- Template Complexity: Complex template metaprogramming may show generic names in reports
- File Overwriting: Output files overwrite previous content on each run
- System Dependencies: Requires GNU ld for
--wrapfunctionality
For questions, bug reports, or contributions, please contact us:
- Email: zfzmalloc@gmail.com
- GitHub: https://github.com/adny-code/fastgrind
- Issues: Report bugs and feature requests via GitHub Issues
This project is licensed under the MIT License. See LICENSE file for details.
