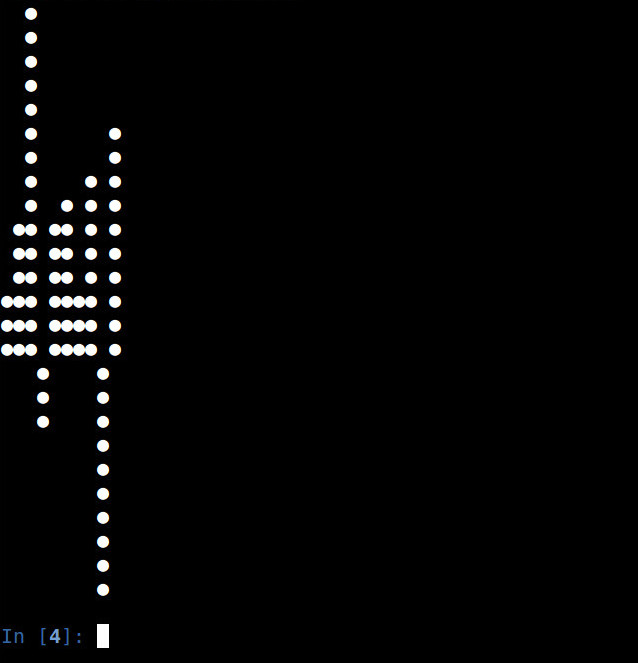
Takes a list of numbers and creates a very basic vertical bar plot in bash. Scales data to plot_height in number of characters. Number of data points should be less than the number of terminal columns or it will make an inaccurate plot if line wrap is enabled.
Installation
pip install termplotExamples:
import termplot
x = [3,6,15,-3,6,7,3,8,-10,10]
termplot.plot(x)
termplot.plot([1,2,3,4,-5,5,-4,-1,0,-10,-4,-2,3,5,8,10,12,10,8,7,6,5,4,3,2,1])
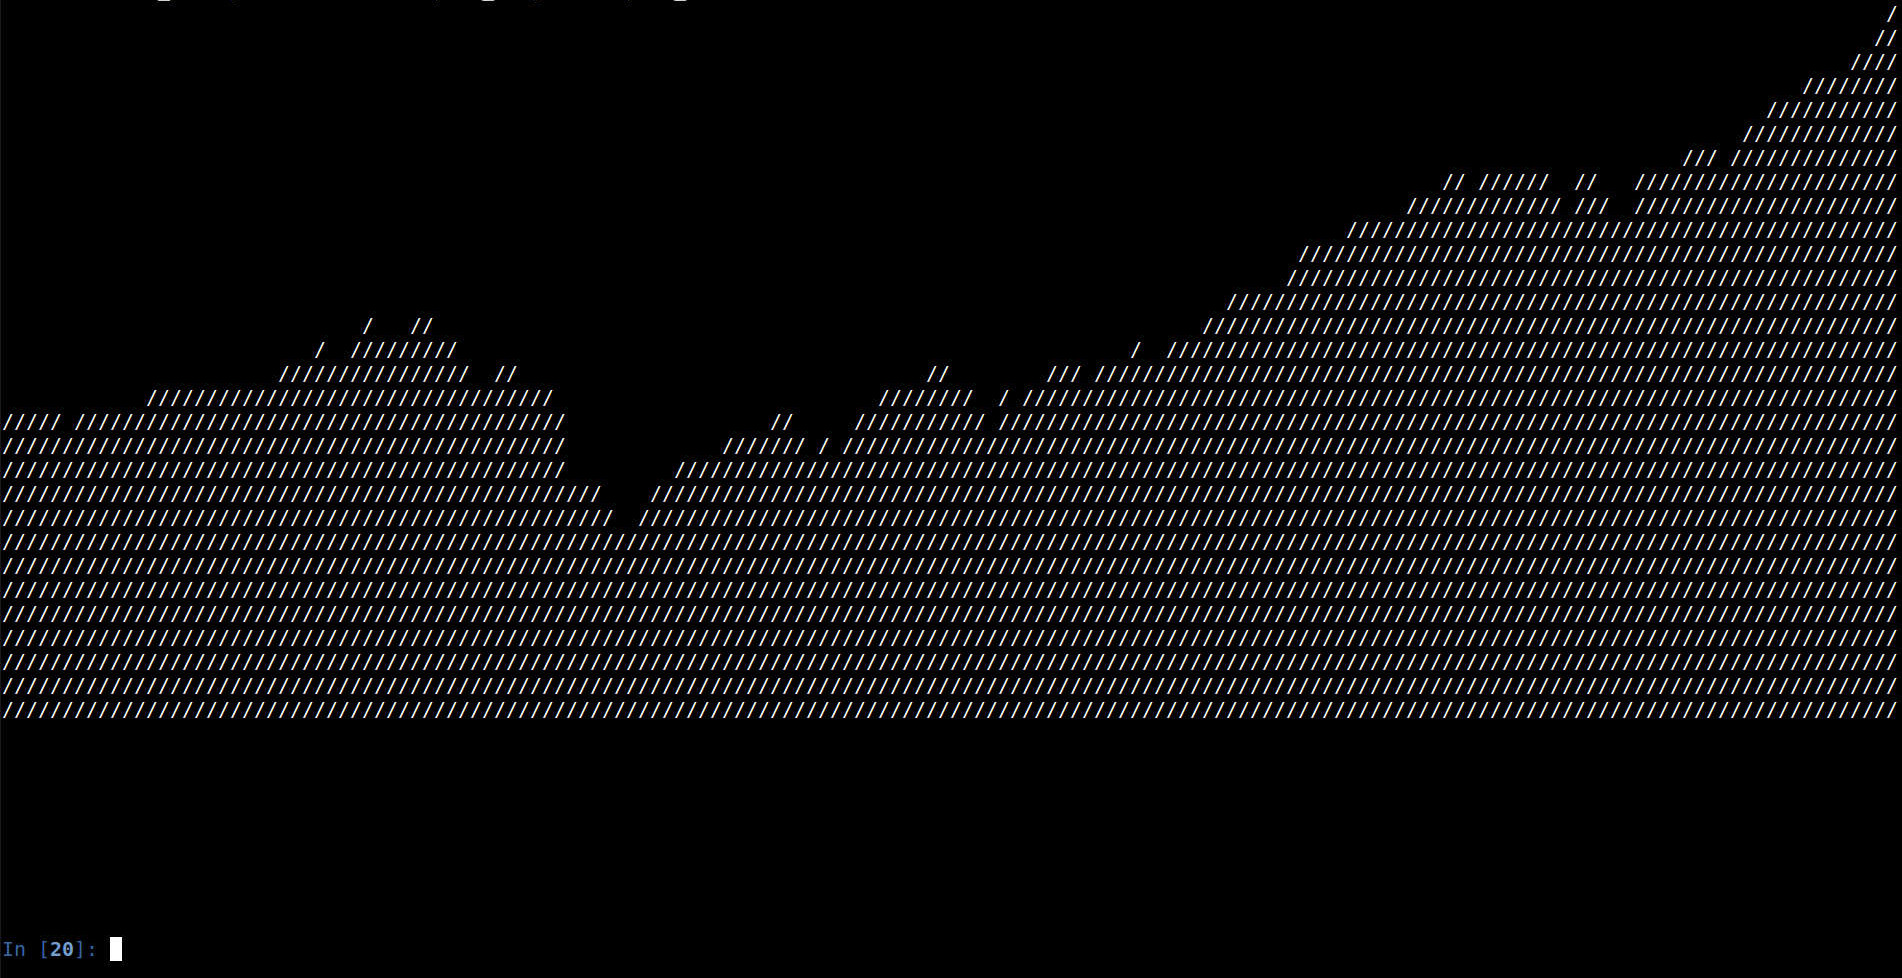
Previous 159 month adj closes from the S&P 500:
termplot.plot(x[-159:-1], plot_height=30, plot_char='/')


