Rainmeter-like Widgets for your desktop using the easy to use PySimpleGUI package
You will need to install PySimpleGUI for any of these widgets to execute.
NOTE - The COVID19 Widget has been removed. The data sources were changed and it no longer properly worked. Sorry about that!
Displays some stats found via the psutil package (required)
This is one of the older programs. Hopefully the coding conventions are up to date.
It uses a class to define the individual graphs which is likely a great way to have done it. It's worth a look to see if it gives you some ideas. Only recently re-discovered.
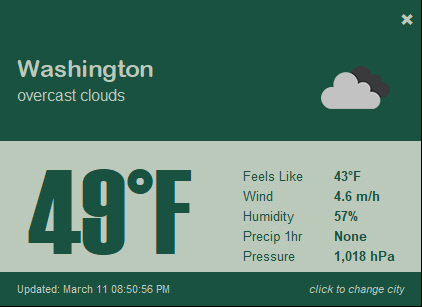
You will need to obtain an API key (APPID) from https://home.openweathermap.org/ in order to run this Widget.
Change the colors to any of the PySimpleGUI Themes.
Your key and location are saved in a config file (.CFG). Any time you change the key or the location it will be saved in your config file.
This one uses psutil to graph the CPU time used by each of your CPU's cores.
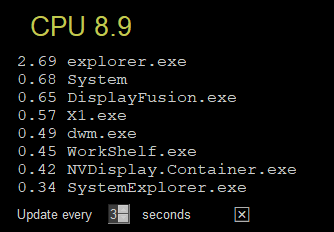
Another psutil based Widget.
Adjust how often you want the widget to refresh using the spinner.
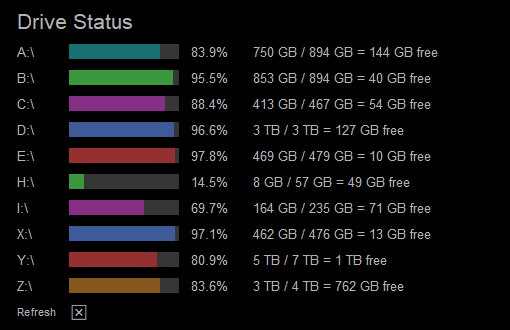
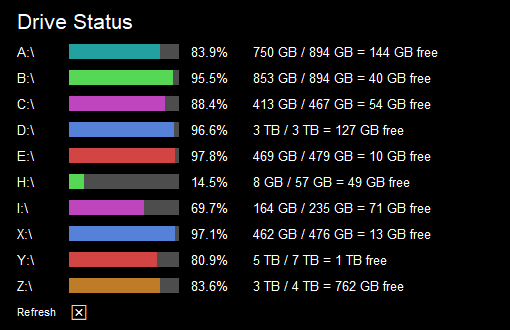
Another one based on psutil. The Windows version works well, however the partition stats returned on Linux don't have values populated to determine the stats. Maybe it works differently on Linux? They come out to all 0's on Linux (sorry Linux users)
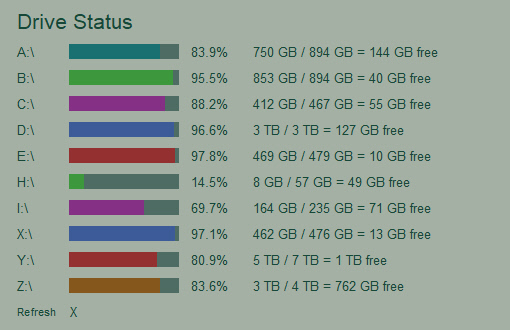
Changing the theme will instantly give you a different text and background color, but it is not what is used to determine the bar colors. Those are created from a simple list of colors defined at the top. It's the same color combination used in the CPU core usage, so those 2 widgets match. Feel free to replace with your own color scheme.
Standard black color theme
A dark green
A light green
One of the grays
The default alpha value is .7 which is why these images' colors are muted. This is what no transparency (alpha 1.0) with a black theme looks like:
To exit click the "X" at the bottom. Kept the interface super minimal by not using buttons, but instead simple clickable Text.
Another psutil based widget.
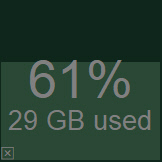
It's a simple square that is shaded to represent the amount of RAM being used. The percent used and the number of bytes used is then shown in text on top of the shaded bar.
Clicking the bottom left corner will allow you to exit. There's a text X there, but it's the lower 20x20 pixel area that's actually being watched.
The color scheme is based on the chosen theme's button color. The background color for the window is the theme's background color. The filled portion is the theme's button background color and the text is the theme's button text color.
Copyright 2020 PySimpleGUI.org

