In this project, Lane Segmentation and Traffic Sign Detection/Classification are aimed in the images.
Developers of this project:
Some of the technologies used in the project; Python, OpenCV, Pytorch, TensorFlow, YOLOv4
The results of the project can be viewed in the video below;
multi_prediction.mp4
(The data in this video is not related to Ford Otosan, it is the data we collect to test the model.)
In training Lane Segmentation and Traffic Sign Detection models, 8.555 image data collected from the highway by Ford Otosan were used.
Examples from the dataset;
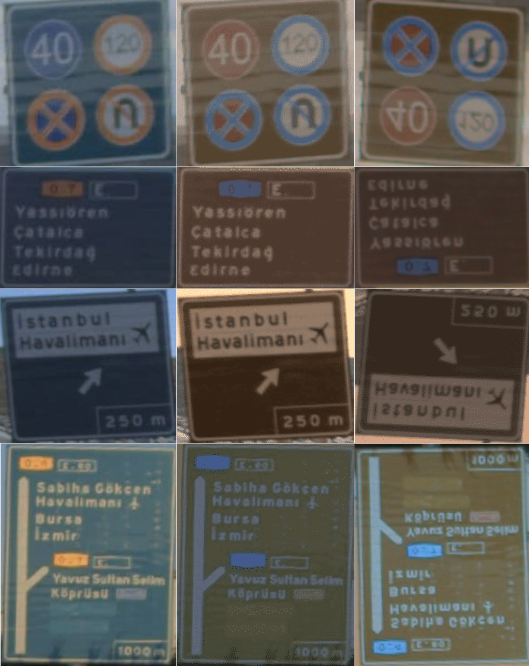
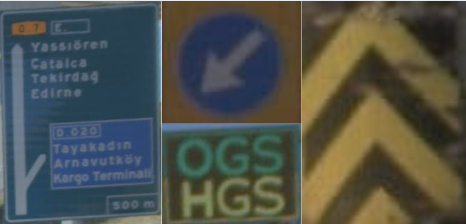
In the traffic sign classification model, the German Traffic Sign dataset from Kaggle was used. Data were collected for traffic signs specific to Turkish highways and new classes were added to the dataset. It has 40+ classes and 50,000+ image data.
Examples from the dataset;
Many steps in the Lane Segmentation section have the same content as the Drivable Area Segmentation project.
Click for the GitHub repository of the Drivable Area Detection project.
You can review my notes, which contain basic information about Semantic Segmentation and Deep Learning; Questions and Answers
JSON files are obtained as a result of highway images labeled by Ford Otosan Annotation Team. The JSON files contain the locations of the Solid Line and Dashed Line classes.
A mask was created with the data in the JSON file to identify the pixels of the lines in the image.
The polylines function from the cv2 library was used to draw the masks.
for obj in json_dict["objects"]: #To access each list inside the json_objs list
    if obj['classTitle']=='Solid Line':
       cv2.polylines(mask,np.array([obj['points']['exterior']],dtype=np.int32),
       False,color=1,thickness=14)
    elif obj['classTitle']=='Dashed Line':
       cv2.polylines(mask,np.array([obj['points']['exterior']],dtype=np.int32),
       False,color=2,thickness=9)
Mask example;
Click for the codes of this section; json2mask_line.py, mask_on_image.py
SegNet was used as we got better results in lanes. U-Net was used for Drivable Area Segmentation. In this way, different models were experienced.
SegNet is a semantic segmentation model. This core trainable segmentation architecture consists of an encoder network, a corresponding decoder network followed by a pixel-wise classification layer. The architecture of the encoder network is topologically identical to the 13 convolutional layers in the VGG16 network. The role of the decoder network is to map the low resolution encoder feature maps to full input resolution feature maps for pixel-wise classification. The novelty of SegNet lies is in the manner in which the decoder upsamples its lower resolution input feature maps. Specifically, the decoder uses pooling indices computed in the max-pooling step of the corresponding encoder to perform non-linear upsampling.
SegNet architecture. There are no fully connected layers and hence it is only convolutional. A decoder upsamples its input using the transferred pool indices from its encoder to produce a sparse feature map(s). It then performs convolution with a trainable filter bank to densify the feature map. The final decoder output feature maps are fed to a soft-max classifier for pixel-wise classification.
Click for the codes of this section; SegNet.py
To see the results of the trained model, estimation was done with test data never seen before by the model.
The images in the test data set are converted to tensor. It is given to the model. And the outputs are converted to masks. Then, these masks are printed on the images and the results are observed.
Click for the codes of this section; full_predict.py
You can review my notes, which contain basic information about semantic segmentation and deep learning; Questions and Answers
This section consists of 2 subtitles.
First, the location of the traffic sign is determined in the image. The image is cropped according to the detected location, the cropped image is classified.
For basic information about this section, you can view my notes under the following headings;
- What is an image classification task?
- What is an object localization task?
- What is an object detection task?
- What is an object recognition task?
- What is non-max suppression?
- YOLO Object Detection Model
The YOLOv4 model, which is very popular today, was used for object detection.
JSON files are obtained as a result of highway images labeled by Ford Otosan Annotation Team. The JSON files contain the locations of the Traffic Sign class.
Data labels have been adjusted to the YOLOv4 model.
xmin=obj['points']['exterior'][0][0]
ymin=obj['points']['exterior'][0][1]
xmax=obj['points']['exterior'][1][0]
ymax=obj['points']['exterior'][1][1]

def width():
    width=int(xmax-xmin)
    return width
def height():
    height=int(ymax-ymin)
    return height
def x_center():
    x_center=int(xmin + width()/2)
    return x_center
def y_center():
    y_center=int(ymin + height()/2)
    return y_center
annotations.append(str(obj_id)+" "+str(x_center()/1920)+" "+str(y_center()/1208)
			    +" "+str(width()/1920)+" "+str(height()/1208))
The folder structure of the train and validation data to be used in the model;
txt files contain the classes and coordinates of the data;
Model parameters have been updated according to our dataset;
Before starting the model training, the pre-trained model weights were downloaded. In this way, the training time was shortened and more accurate operation was ensured.
def Detection(imageDir):
    os.system("./darknet detector test data/obj.data cfg/yolov4-obj.cfg ../yolov4-obj_last.weights
		   {} -ext_output -dont_show -out result.json -thresh 0.5".format(imageDir))
The point positions estimated with YOLOv4 are saved in the result.json file with the parameter in the Detection function;
As a result of the training, our object detection model reached 87% accuracy.
A sample prediction at the end of the training is as follows;
Click for the codes of this section; Detection
In the traffic sign classification model, the German Traffic Sign dataset from Kaggle was used. Data were collected for traffic signs specific to Turkish highways and new classes were added to the dataset. It has 40+ classes and 50,000+ image data.
Images representing the classes in the dataset;
Data augmentation was applied to increase the data collected from Turkish highways;
Images are cropped from locations detected with the YOLOv4 model;
A CNN model was used in the following layer structure for the classification;
Model evaluation;
The image of the class predicted as a result of the classification was sized to 70% of the short side of the bounding box and added to the upper left corner of the box. Adjusted its length to 40px to prevent it from getting too large if it is over 40px in length.
The image.c file in Darknet has been edited and the bounding box's has been personalized.
Examples of classification results;
Click for the codes of this section; Classification
Test results with random data collected on different days;
(Click Right click->open image in new tab or save image as.. to view larger images.)


